
✅
Link to the plugin page: https://zeroqode.com/plugin/map-charts-plugin-for-bubble--1588616840542x584071926349390300
Demo to preview the plugin:
✅
Introduction
The Map Charts plugin provides an interactive geographic map that includes all countries and major cities worldwide. Users can hover over a region (country, state, or city), and the selected area will change color while detailed information becomes visible. It’s a no-code solution for building interactive data visualizations, analytics dashboards, or educational projects in Bubble.
Key Features
- Global coverage — includes all countries and major states/cities.
- Hover interaction — highlights areas when mouse hovers.
- Custom styling — set hover and default colors to match your brand.
- Dynamic data display — show custom info when a region is selected or hovered.
- Ideal for dashboards and data visualization.

How to setup
Step 1 – Install the Plugin
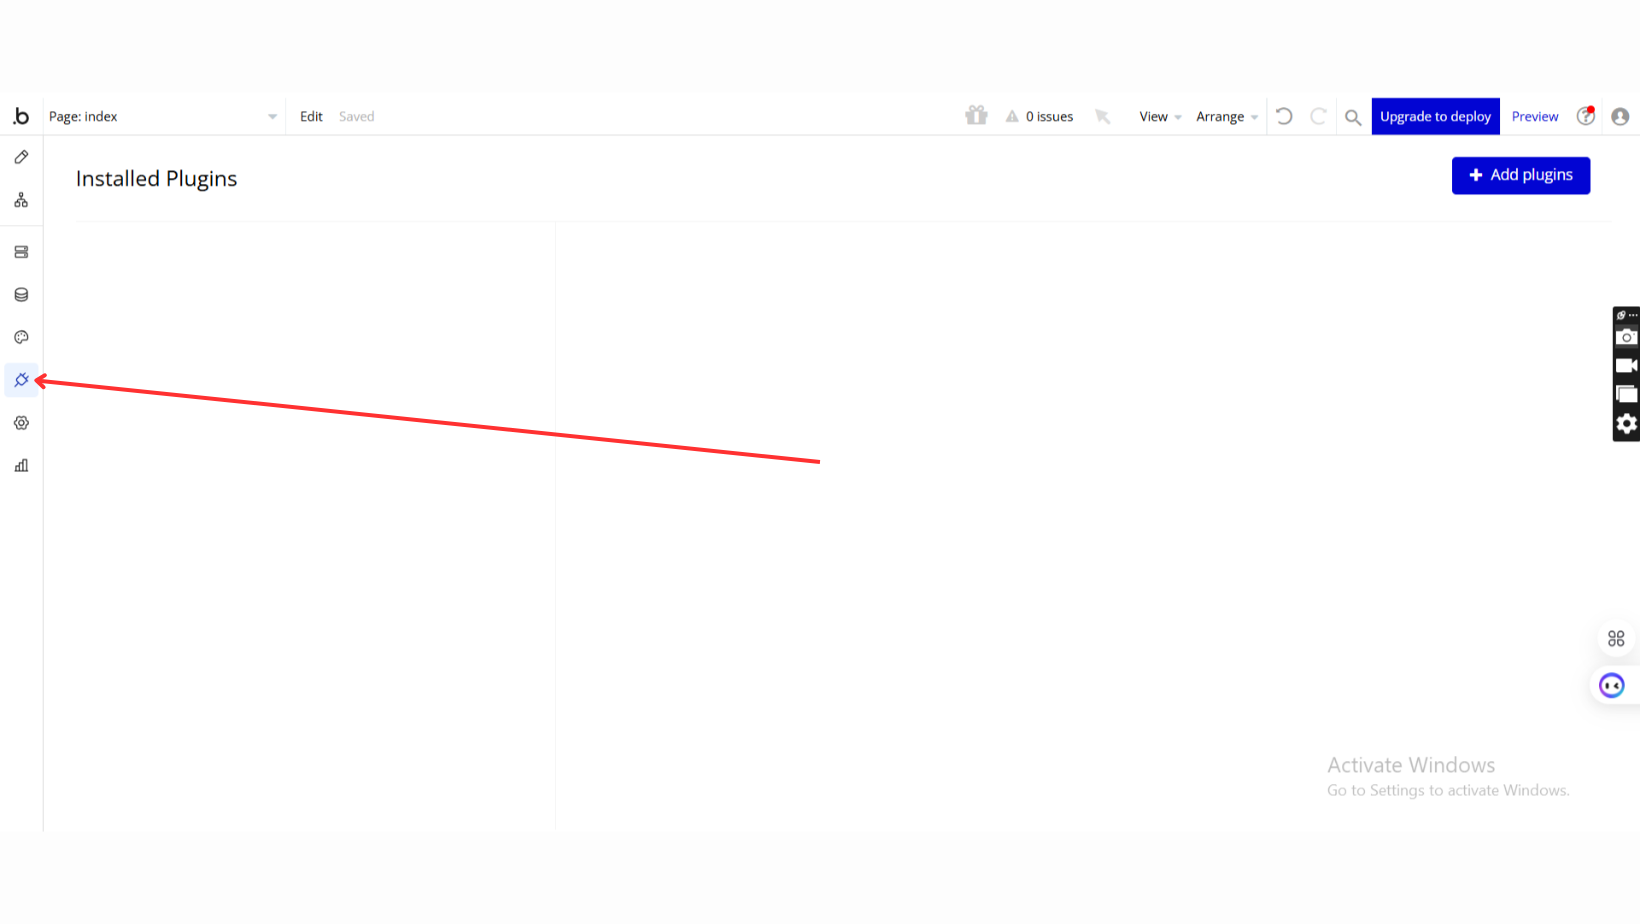
- Go to the Plugin Tab
- Open your Bubble Editor.
- Navigate to the Plugins tab on the left panel.
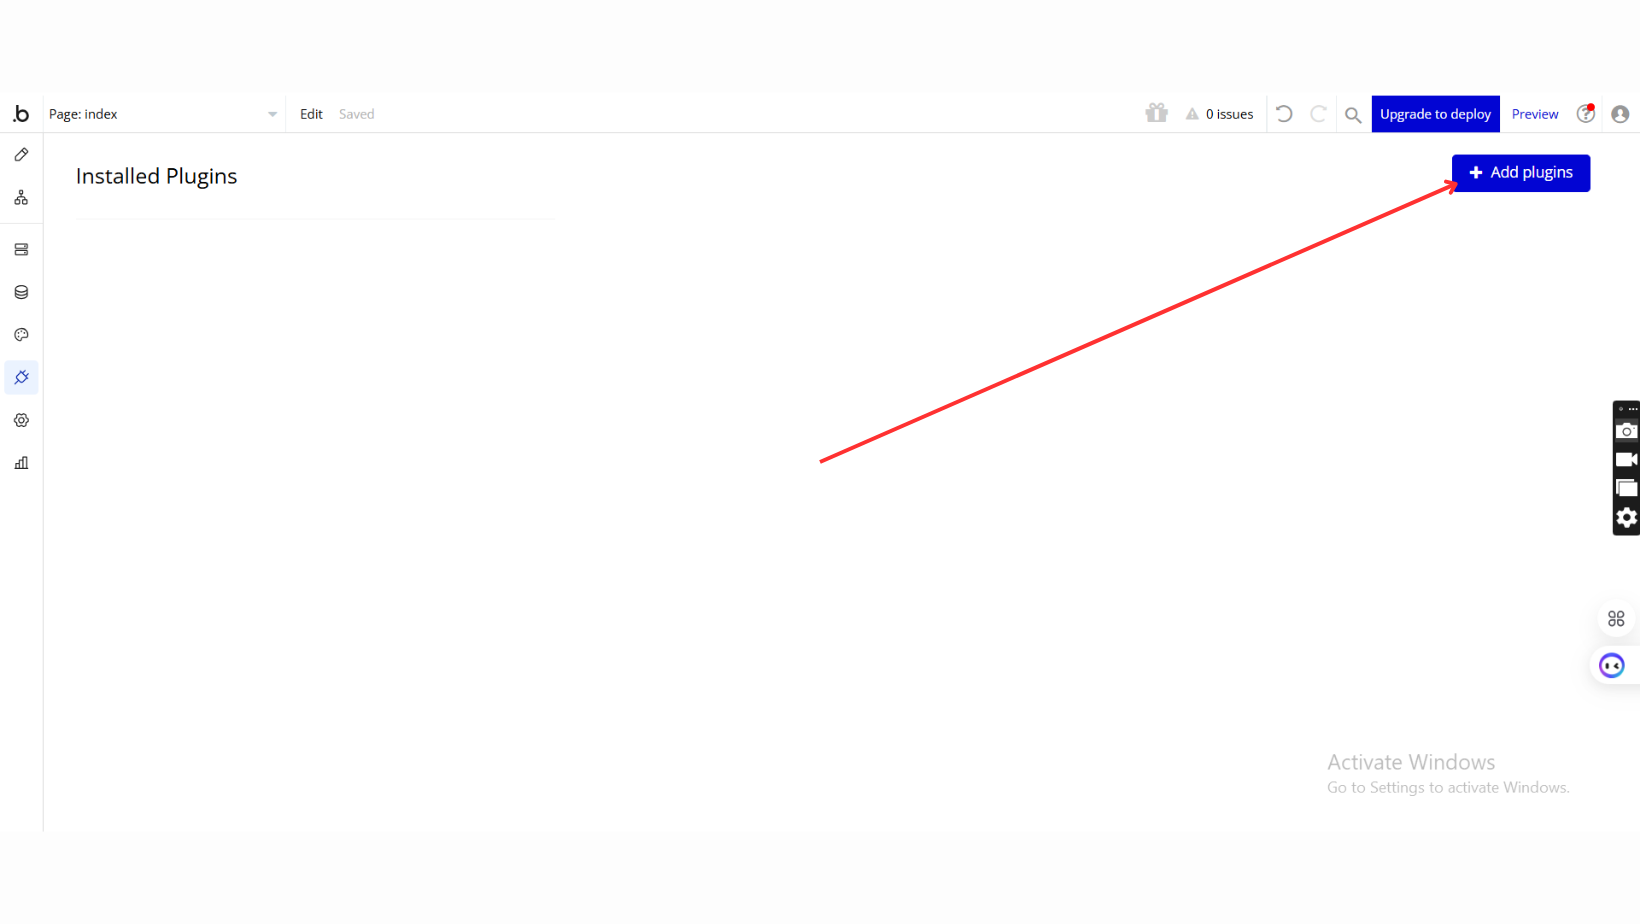
- Add Plugins
- Once in the Plugins tab, click the Add Plugins button.
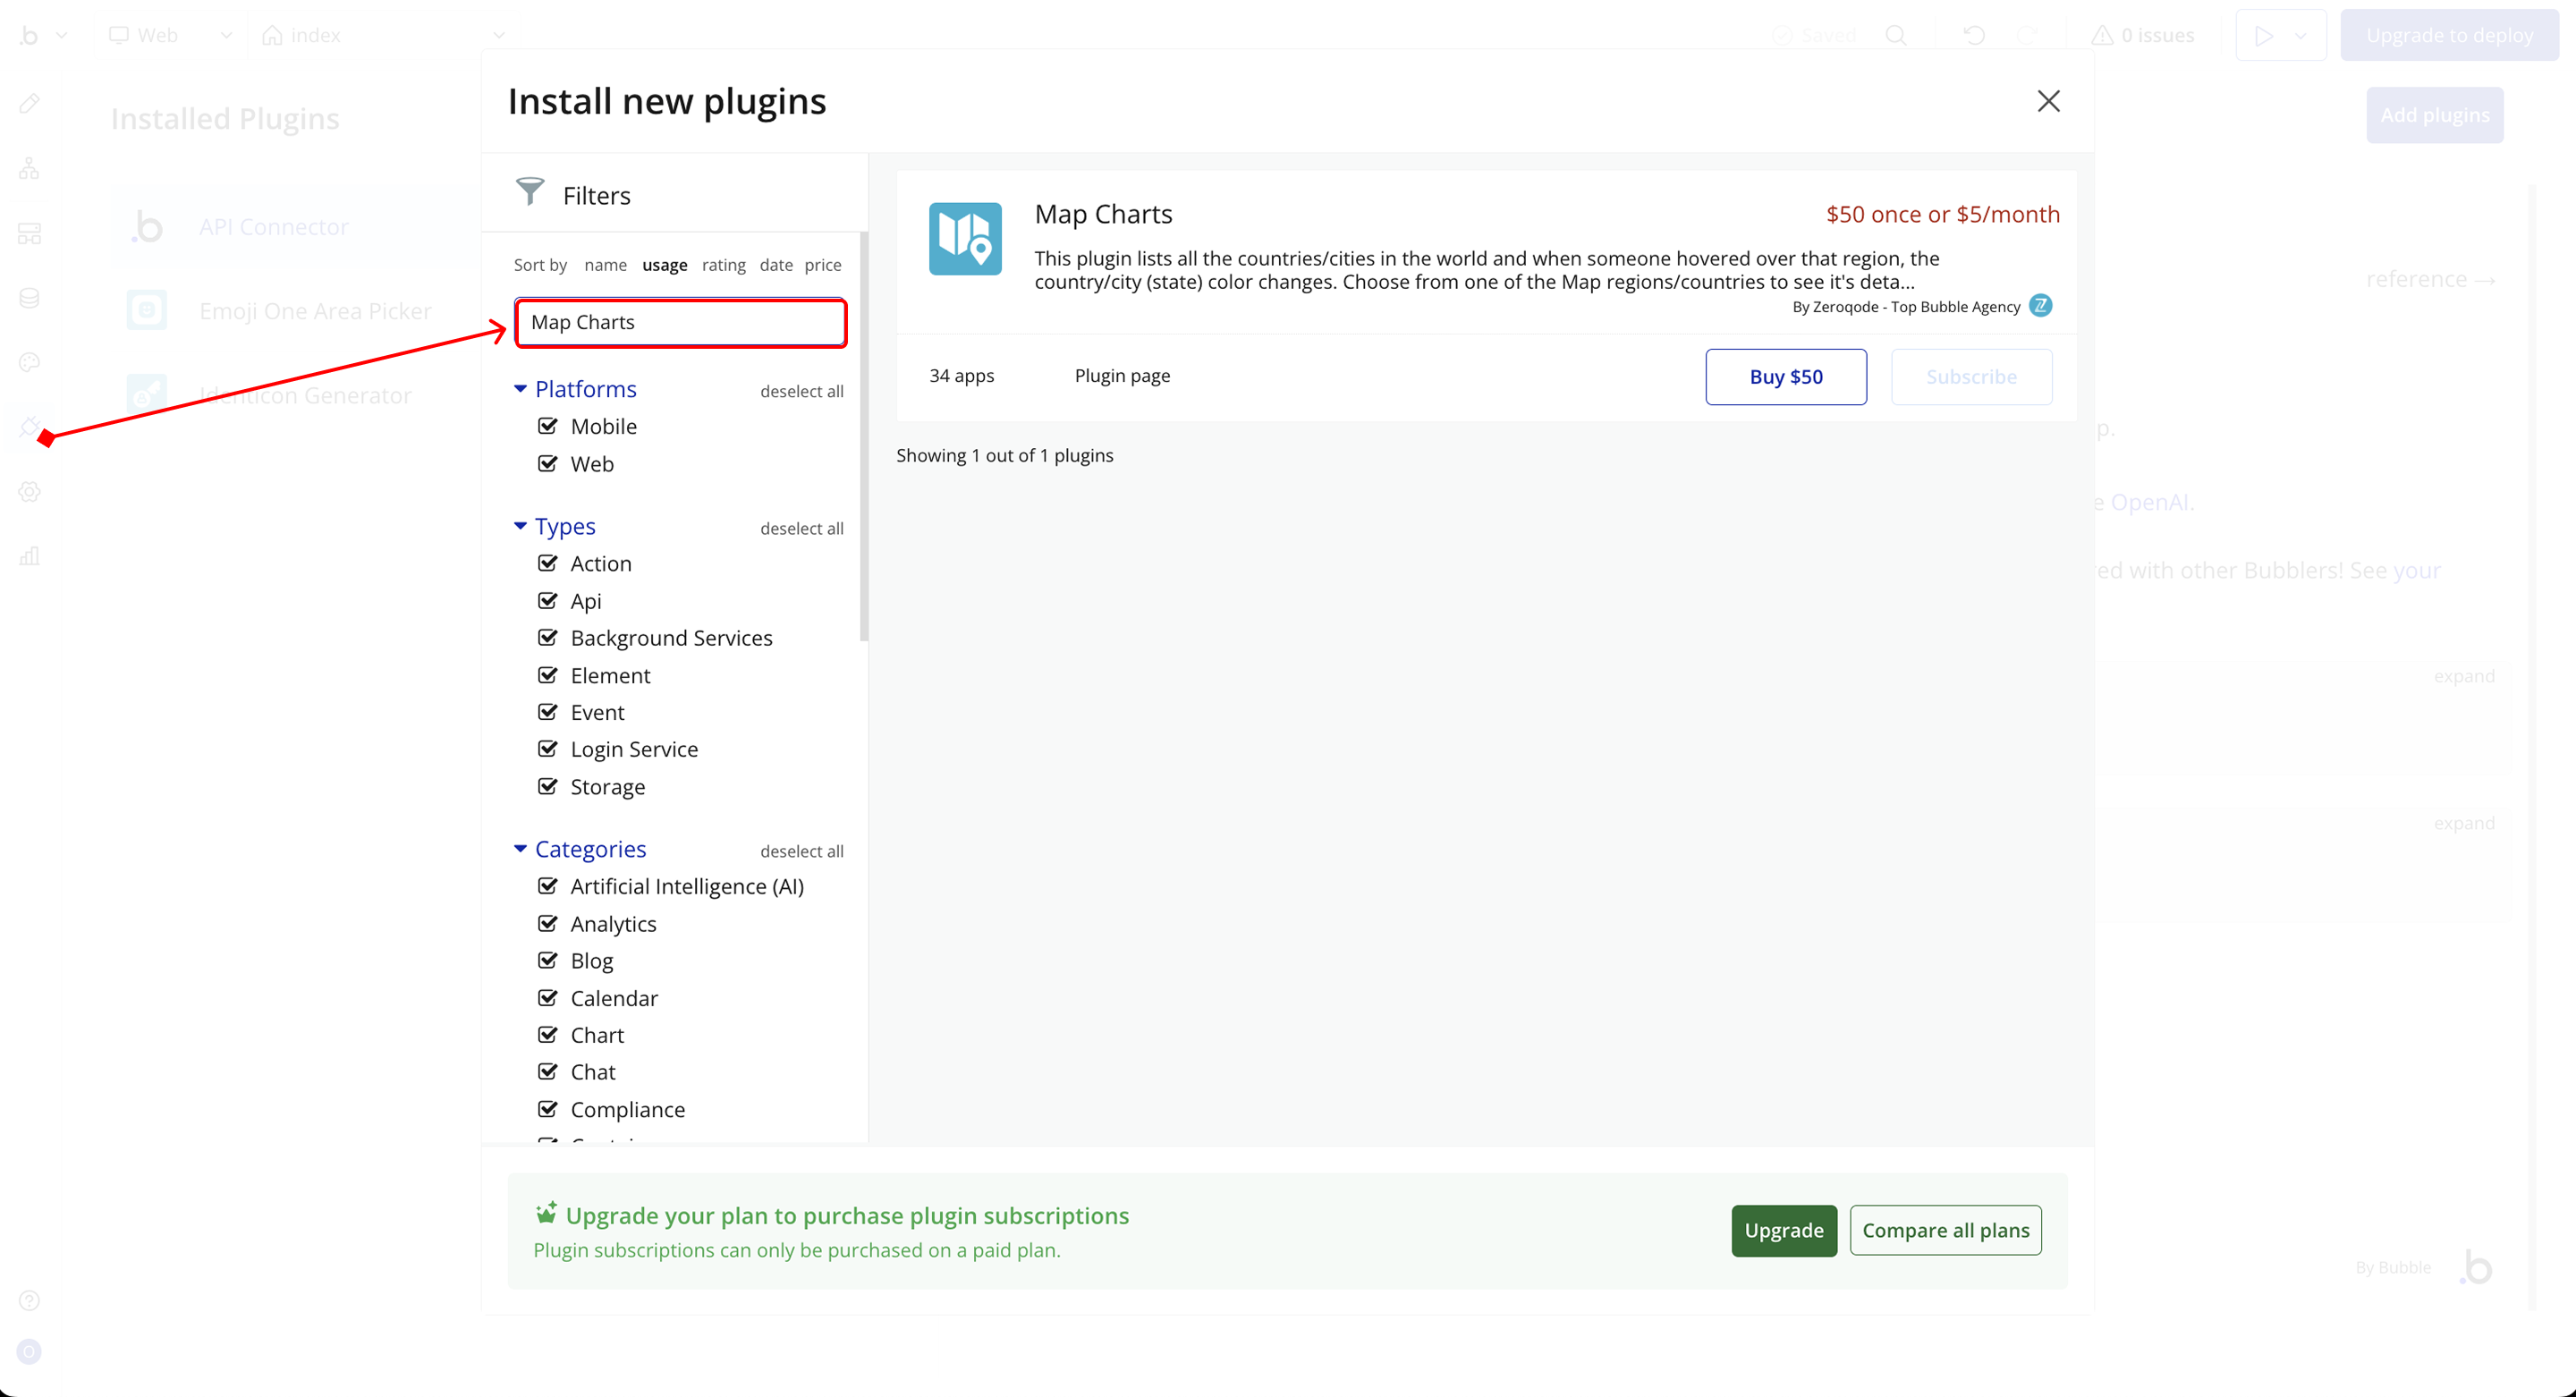
- Search for the Plugin
- Use the search bar to type Map Charts.
- Locate the plugin in the search results.
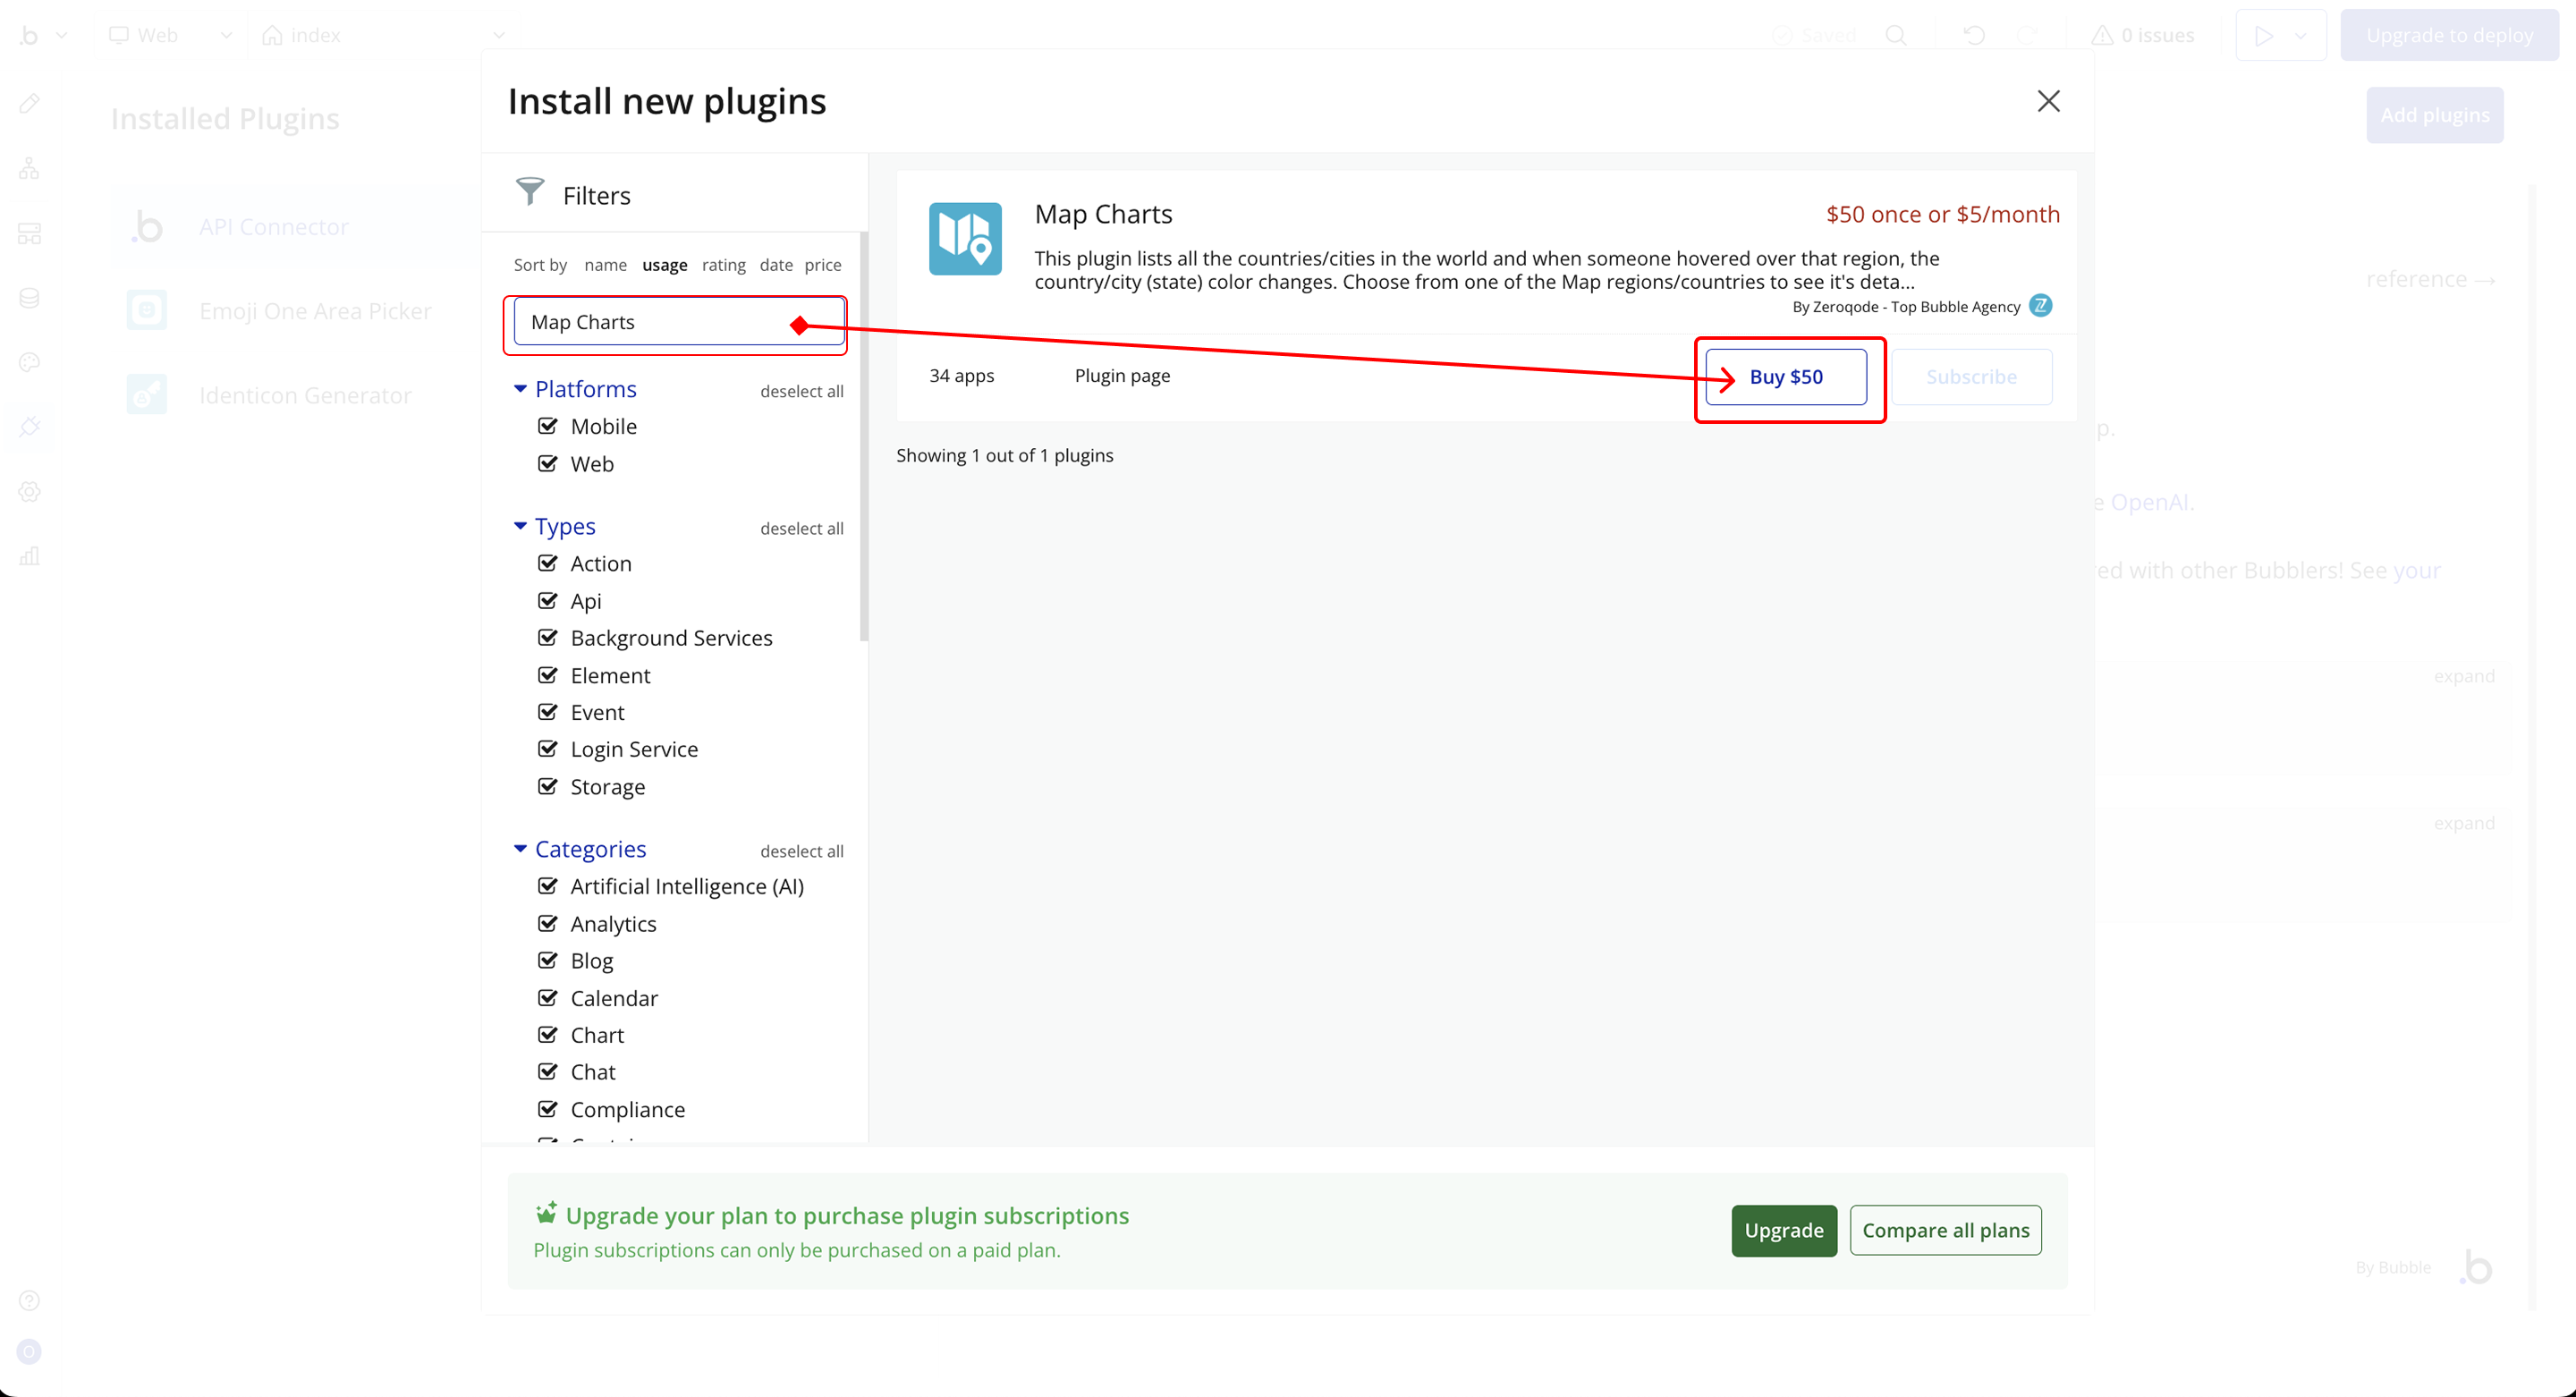
- Install/Buy
- If the plugin is free, click Install to add it to your application.
- For a paid plugin, click Buy and follow the purchase instructions.
- Payment Information (For Paid Plugins)
- If the plugin is a paid one, fill in your payment details and make payment.
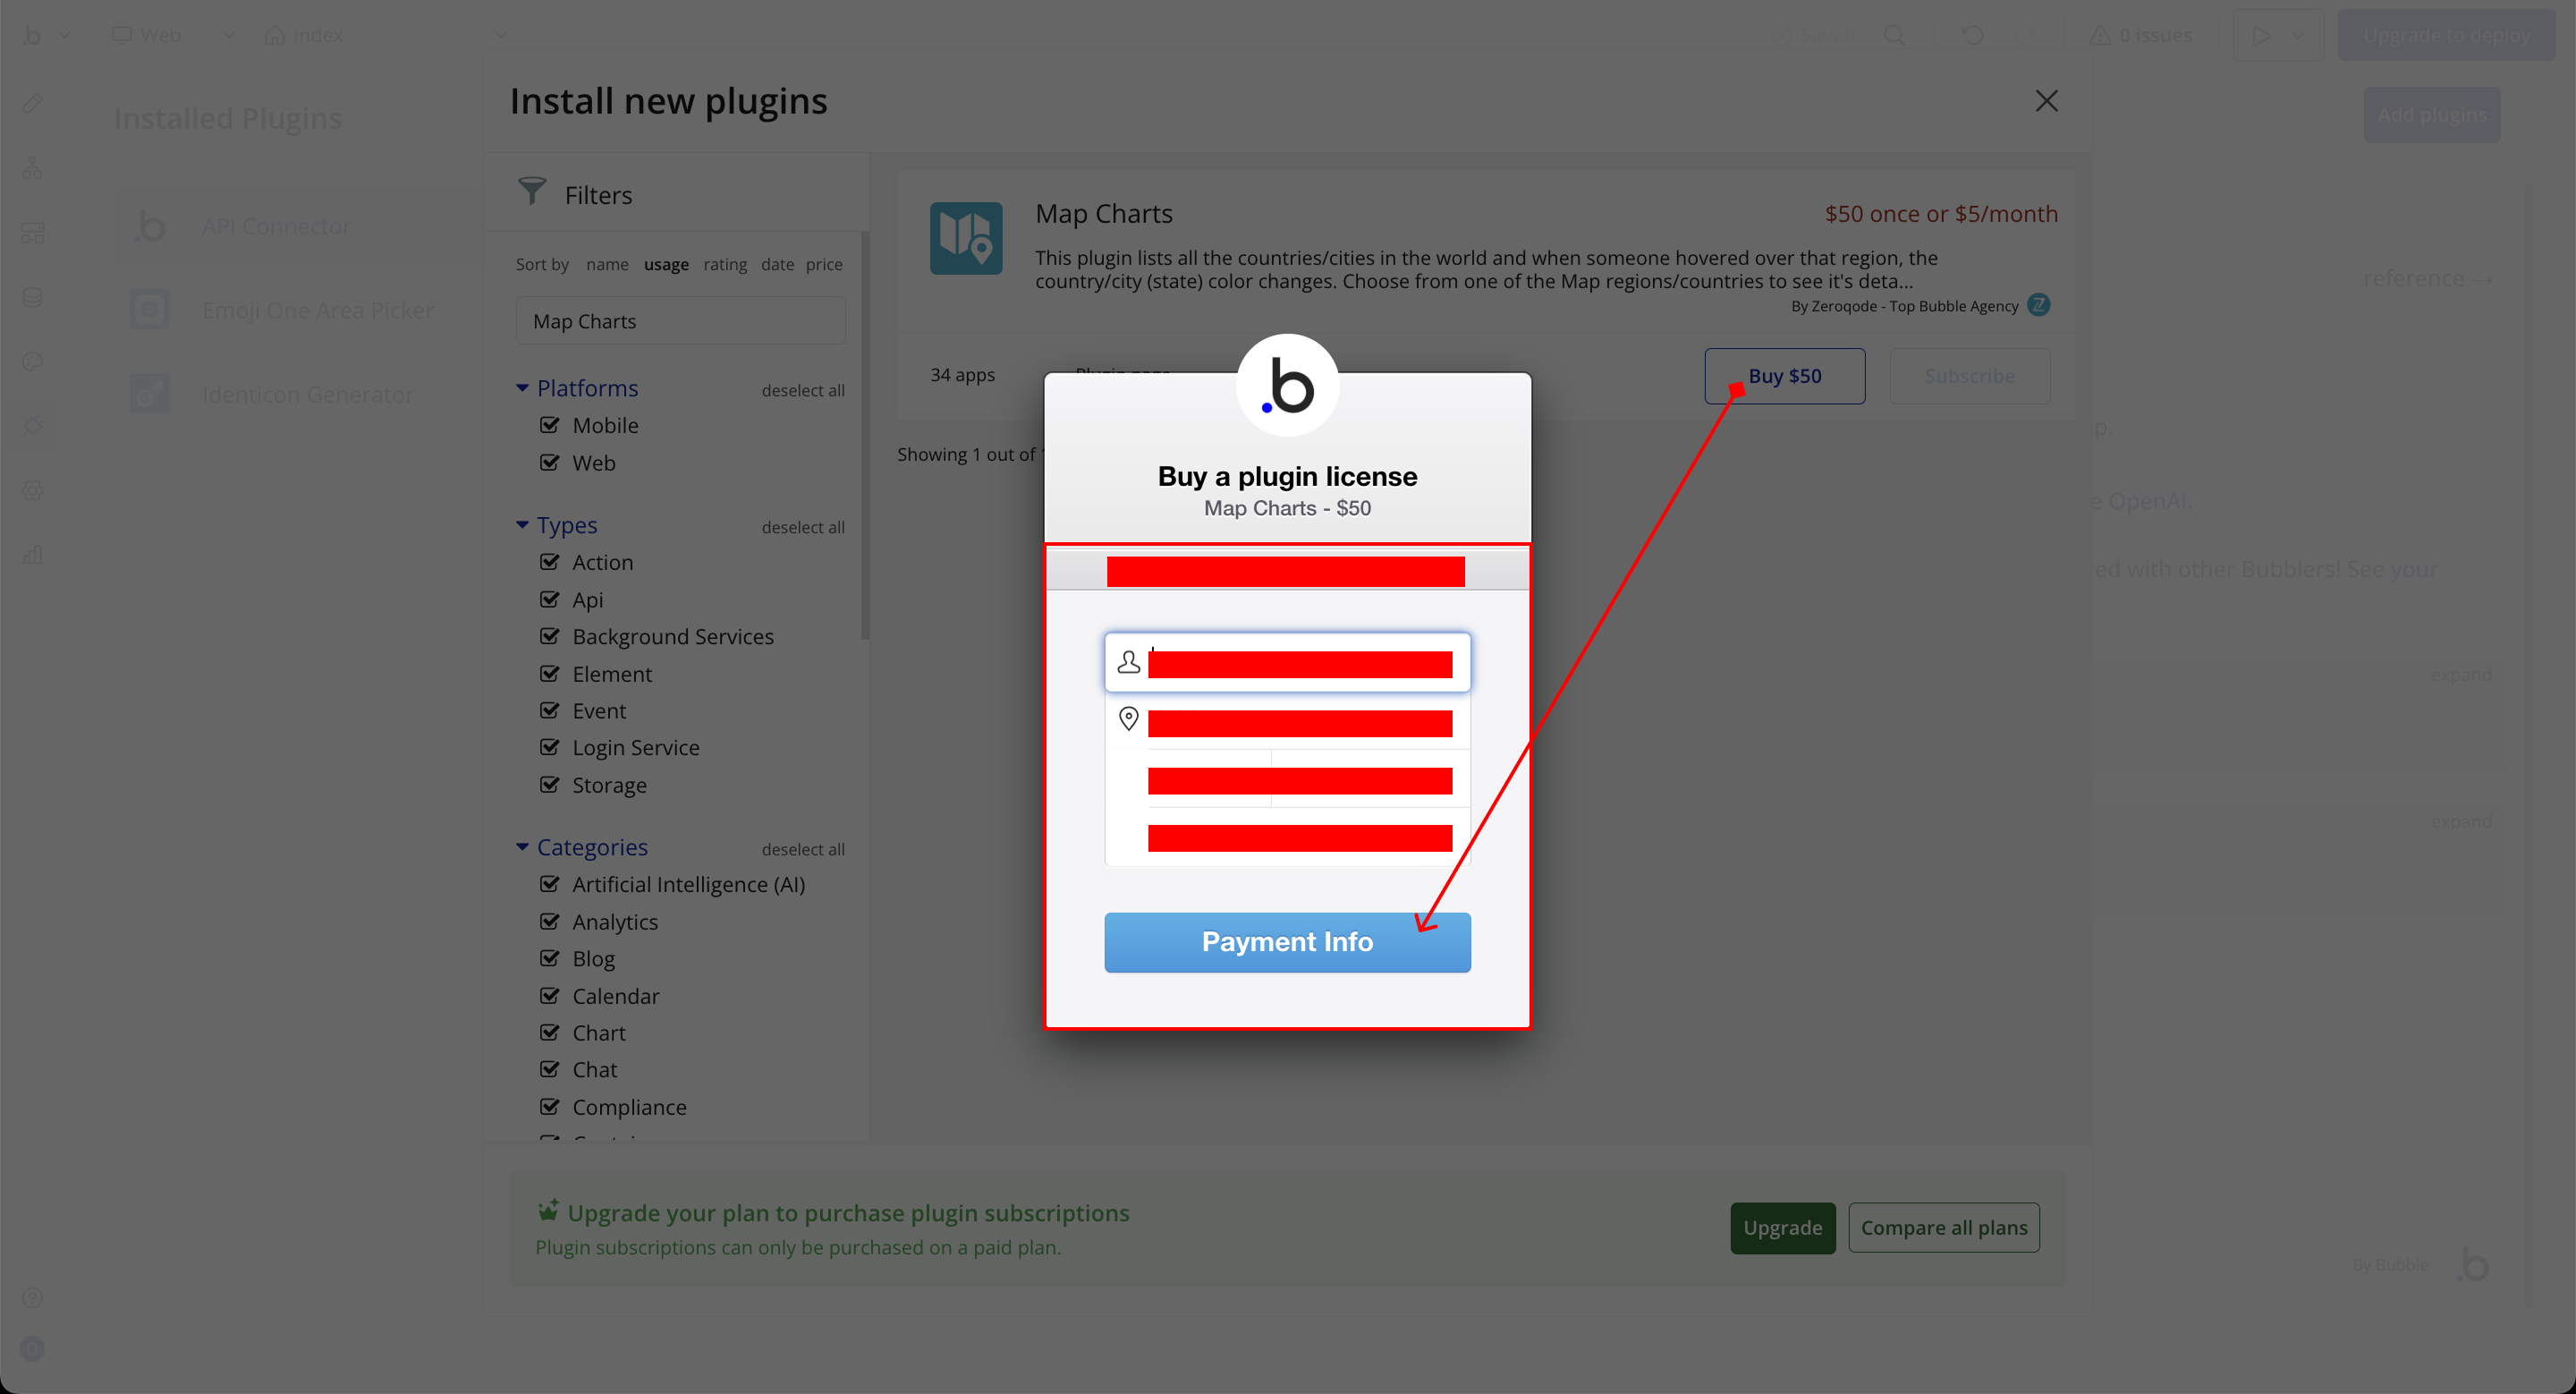
- Charges will be added to your Bubble billing account.
- Remember, if you unsubscribe from the plugin shortly after installation, charges will be prorated based on the days used.
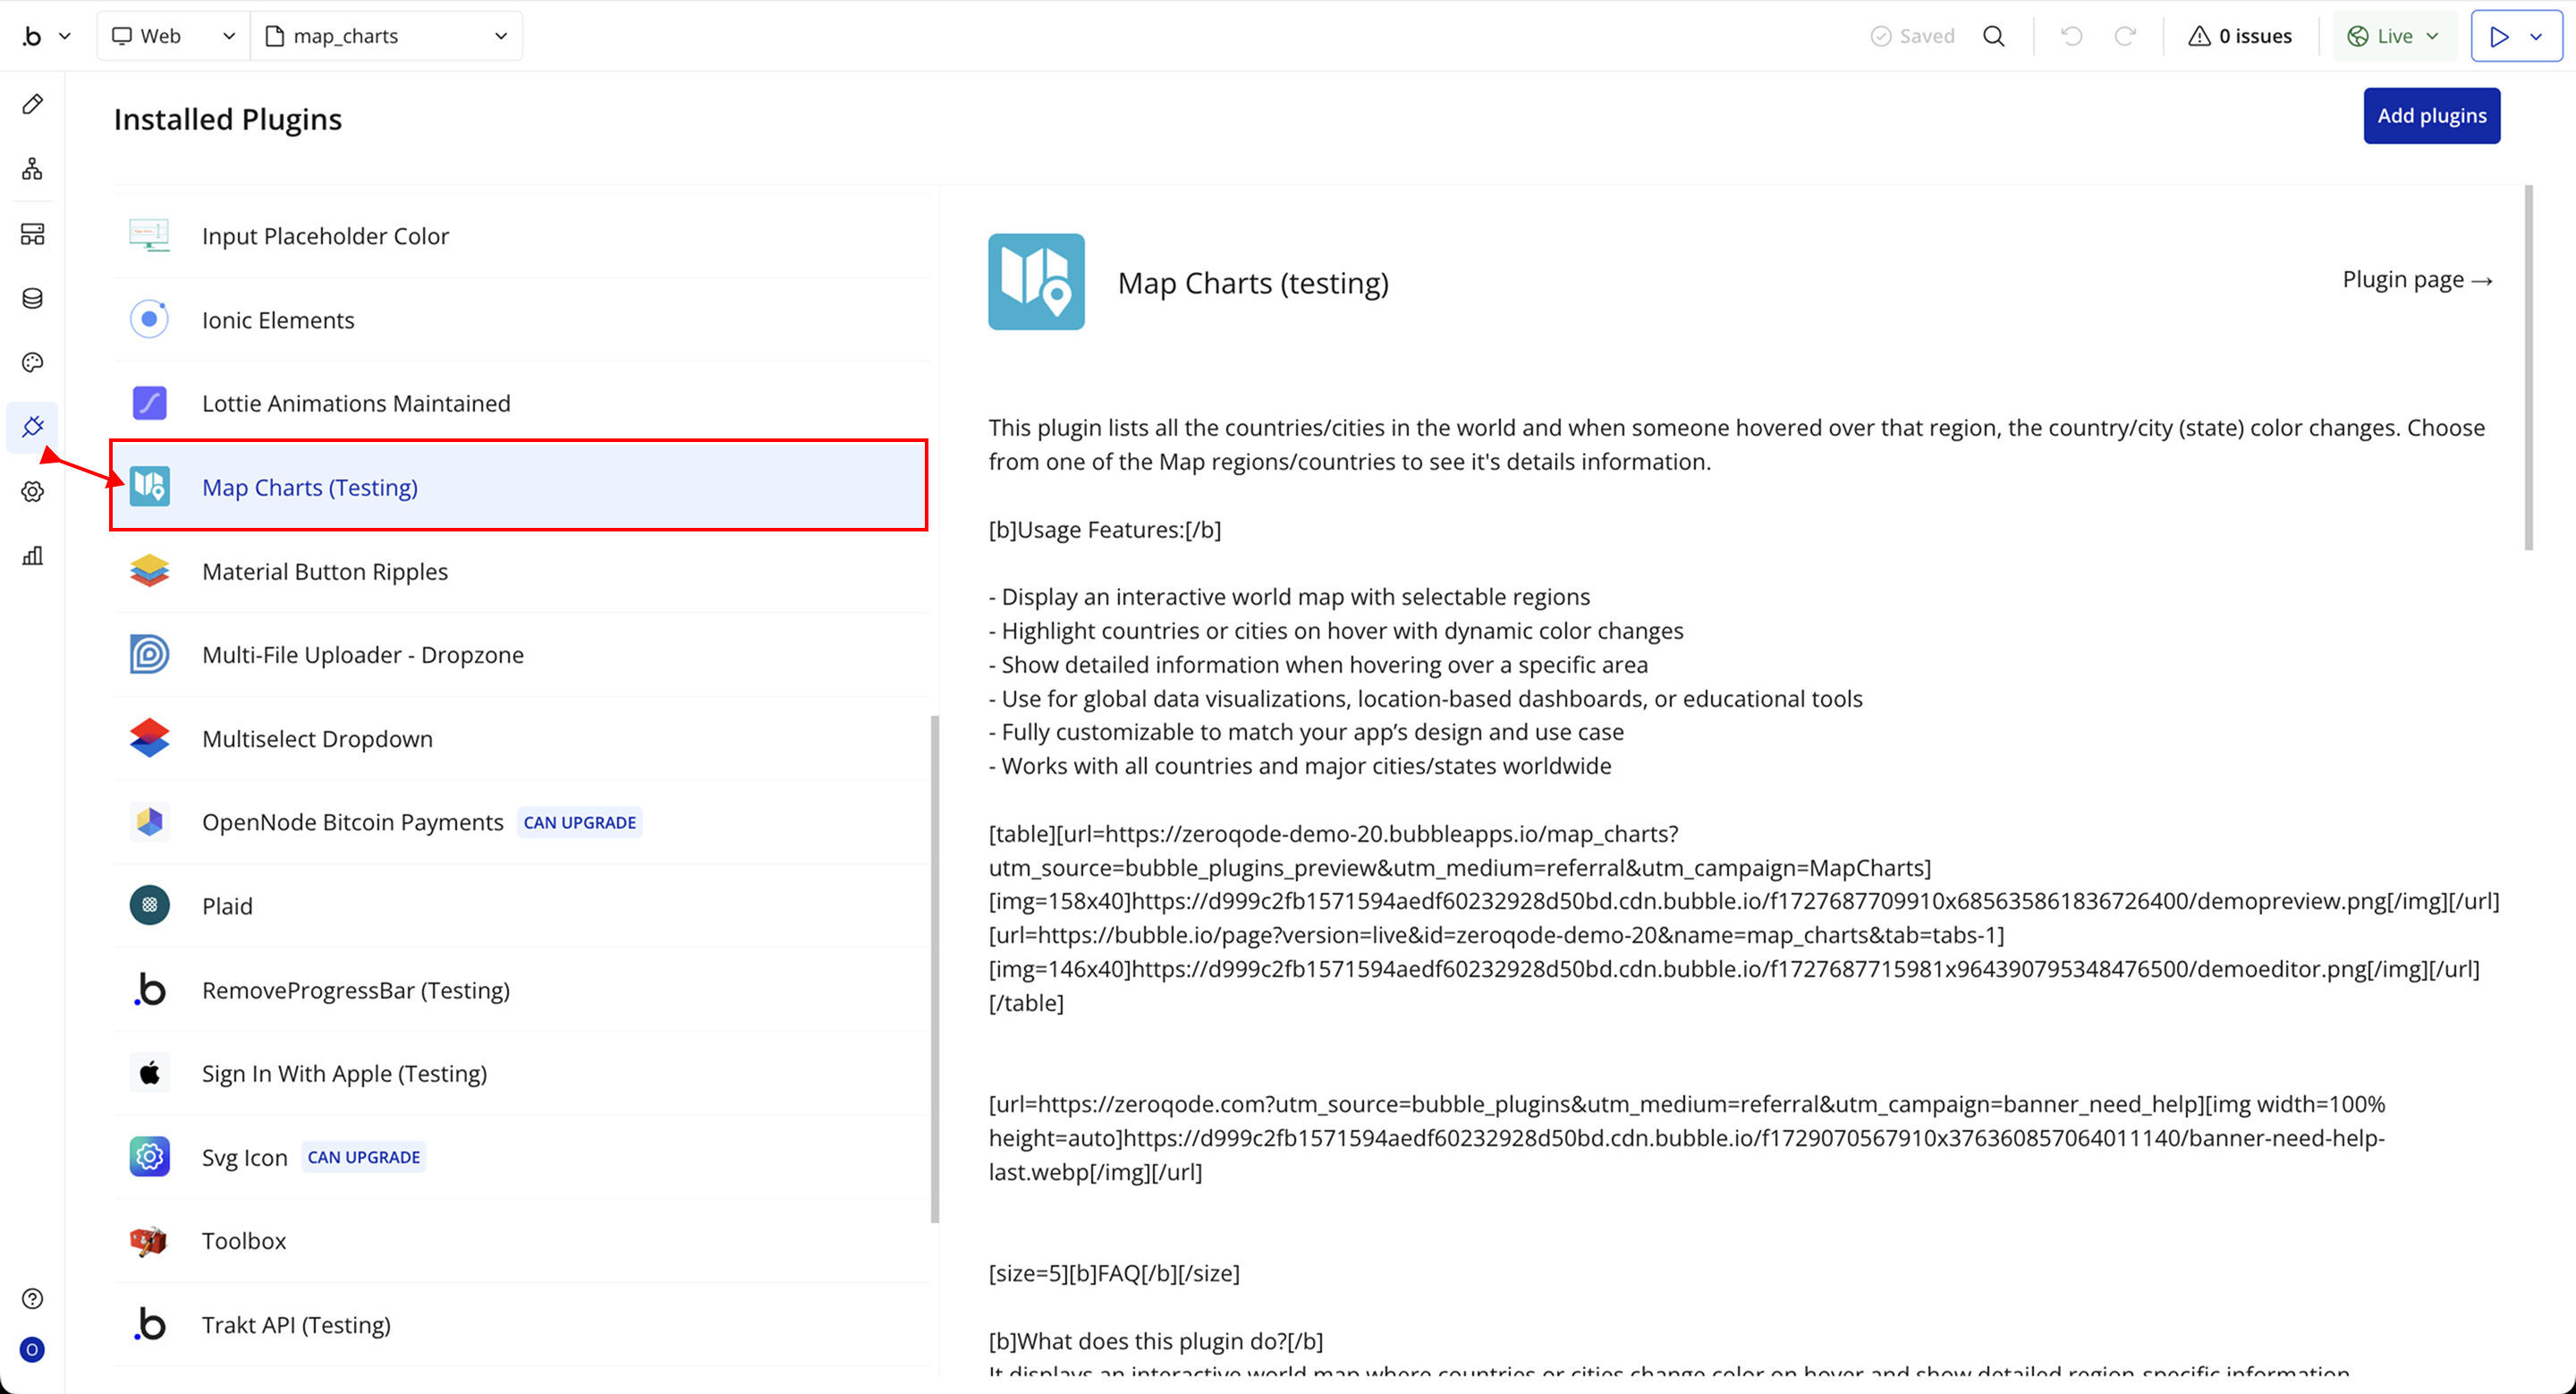
- Plugin Installed
- Once installed, the plugin will appear under the Installed Plugins list in your Bubble Editor.
Step 2 – Add the Plugin Element to Your Page
- Open the Design tab in your Bubble editor.
- Search for the Map Charts. element in the Elements panel.
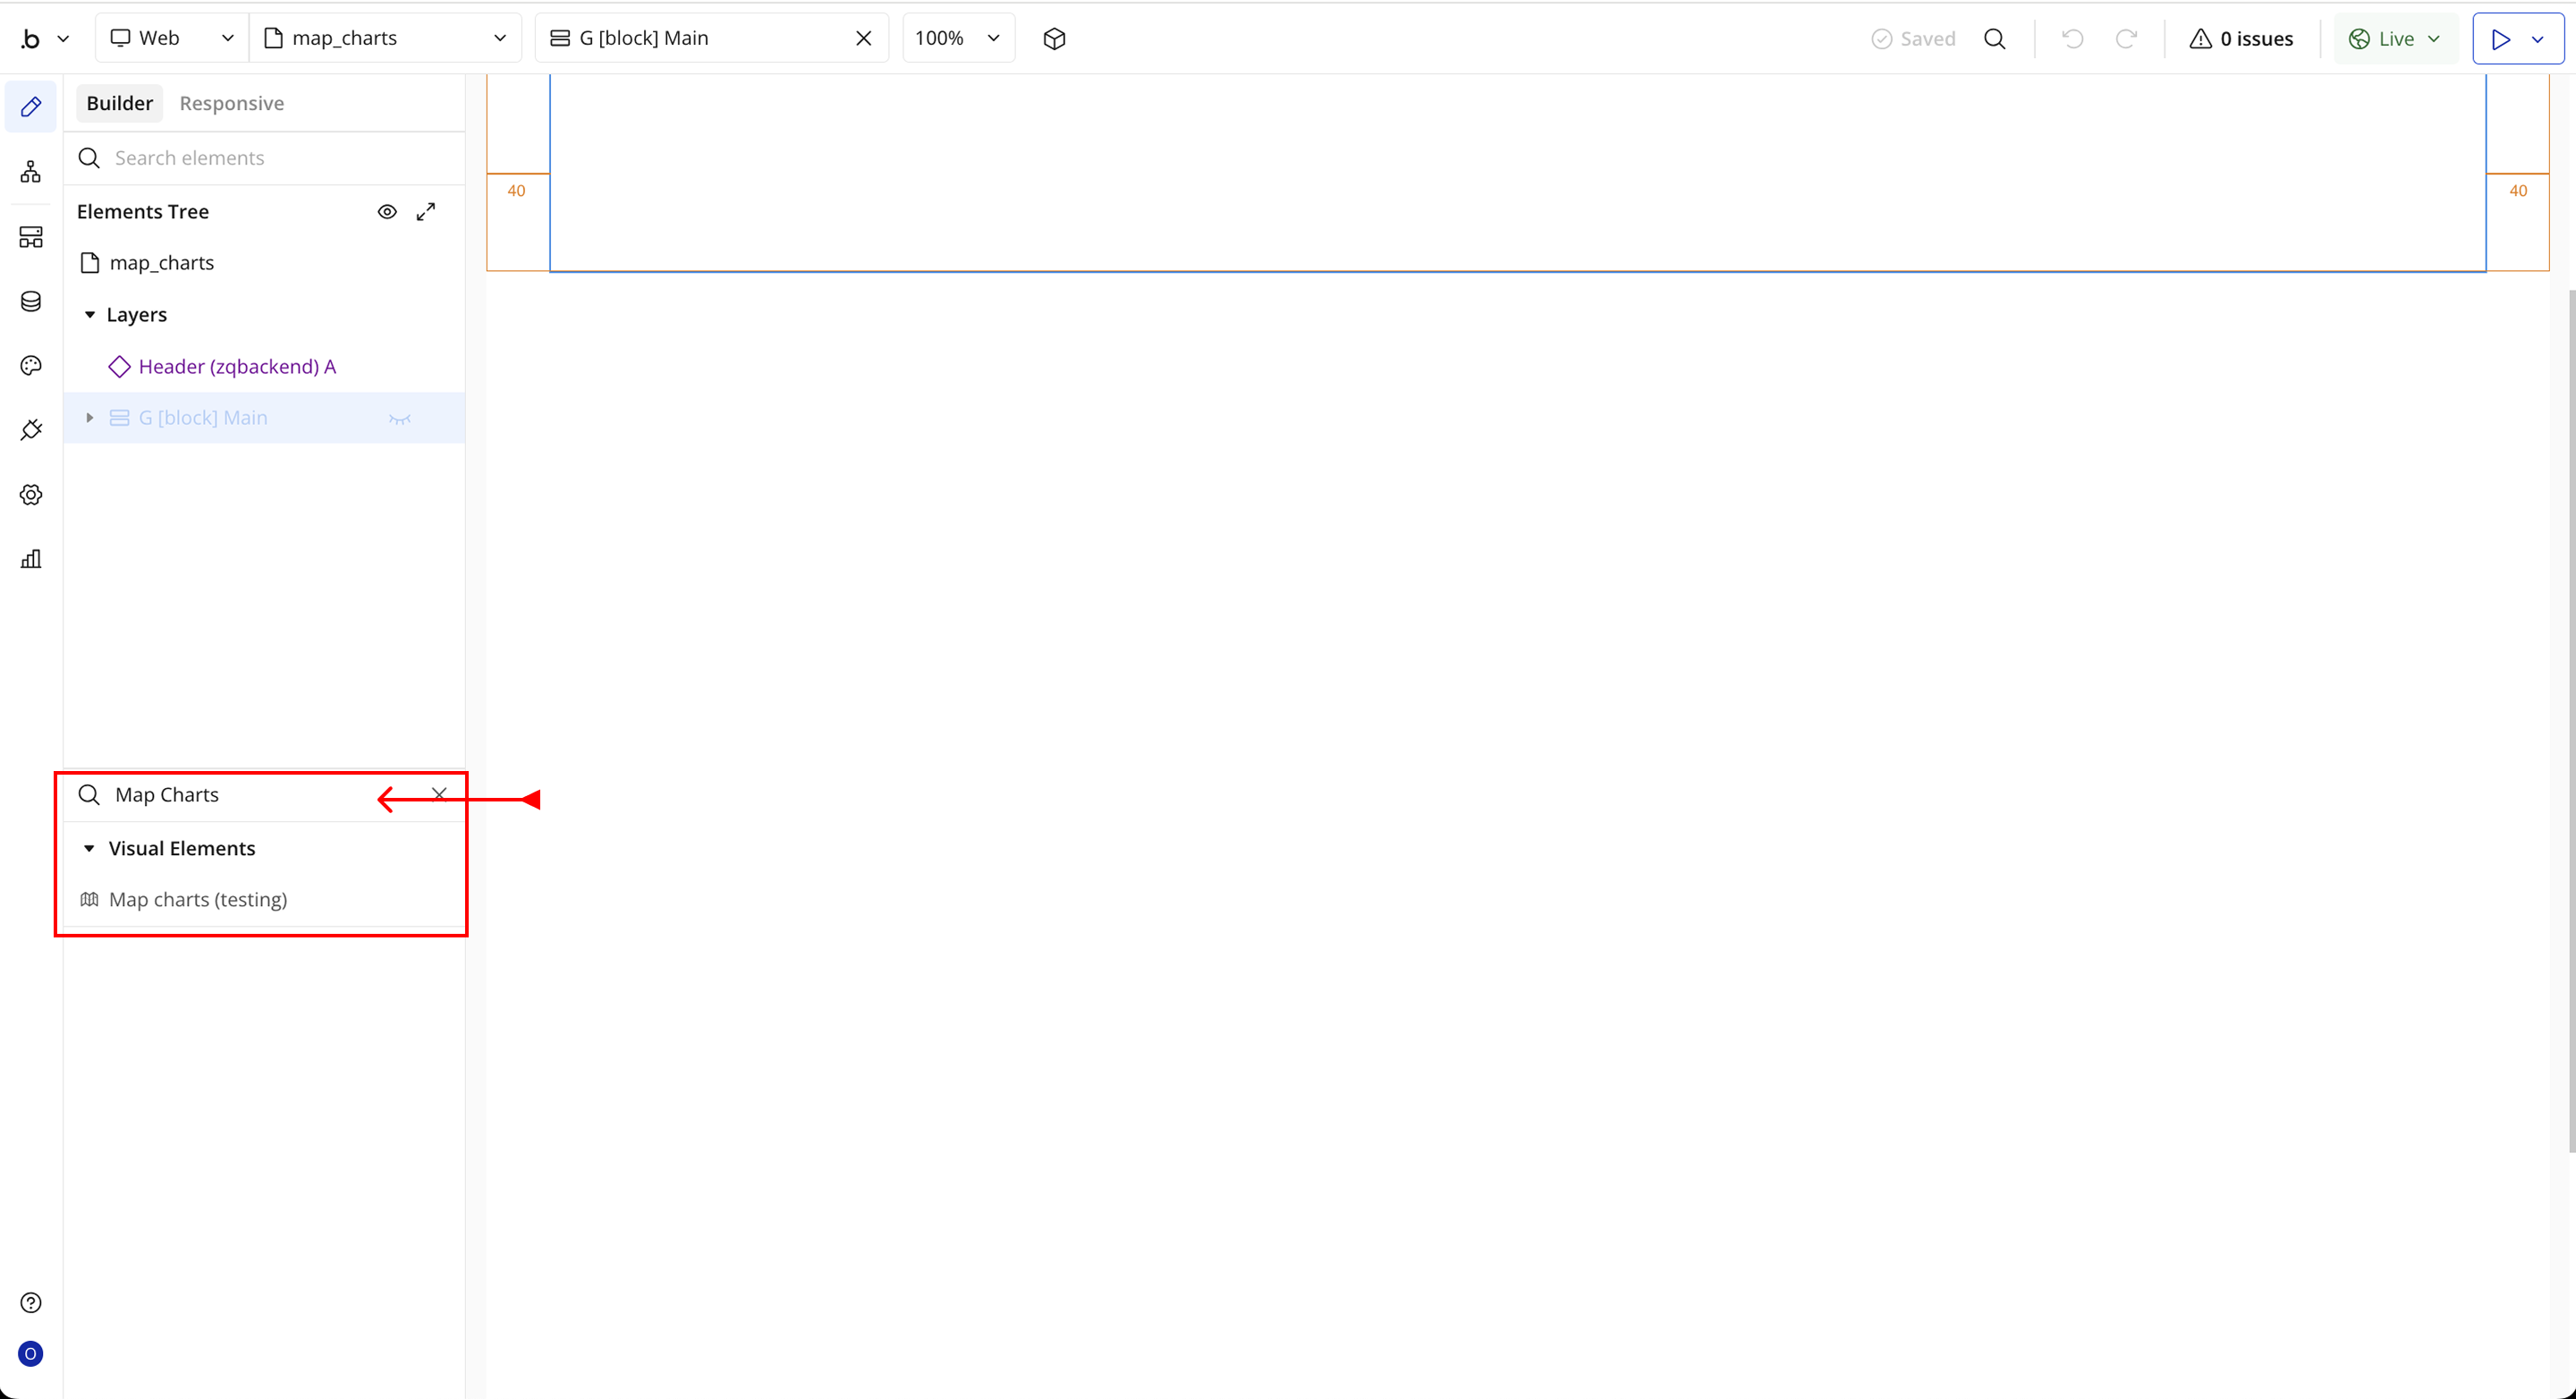
- You’ll see one option:
- Map Charts
- Drag and drop the element onto your page.
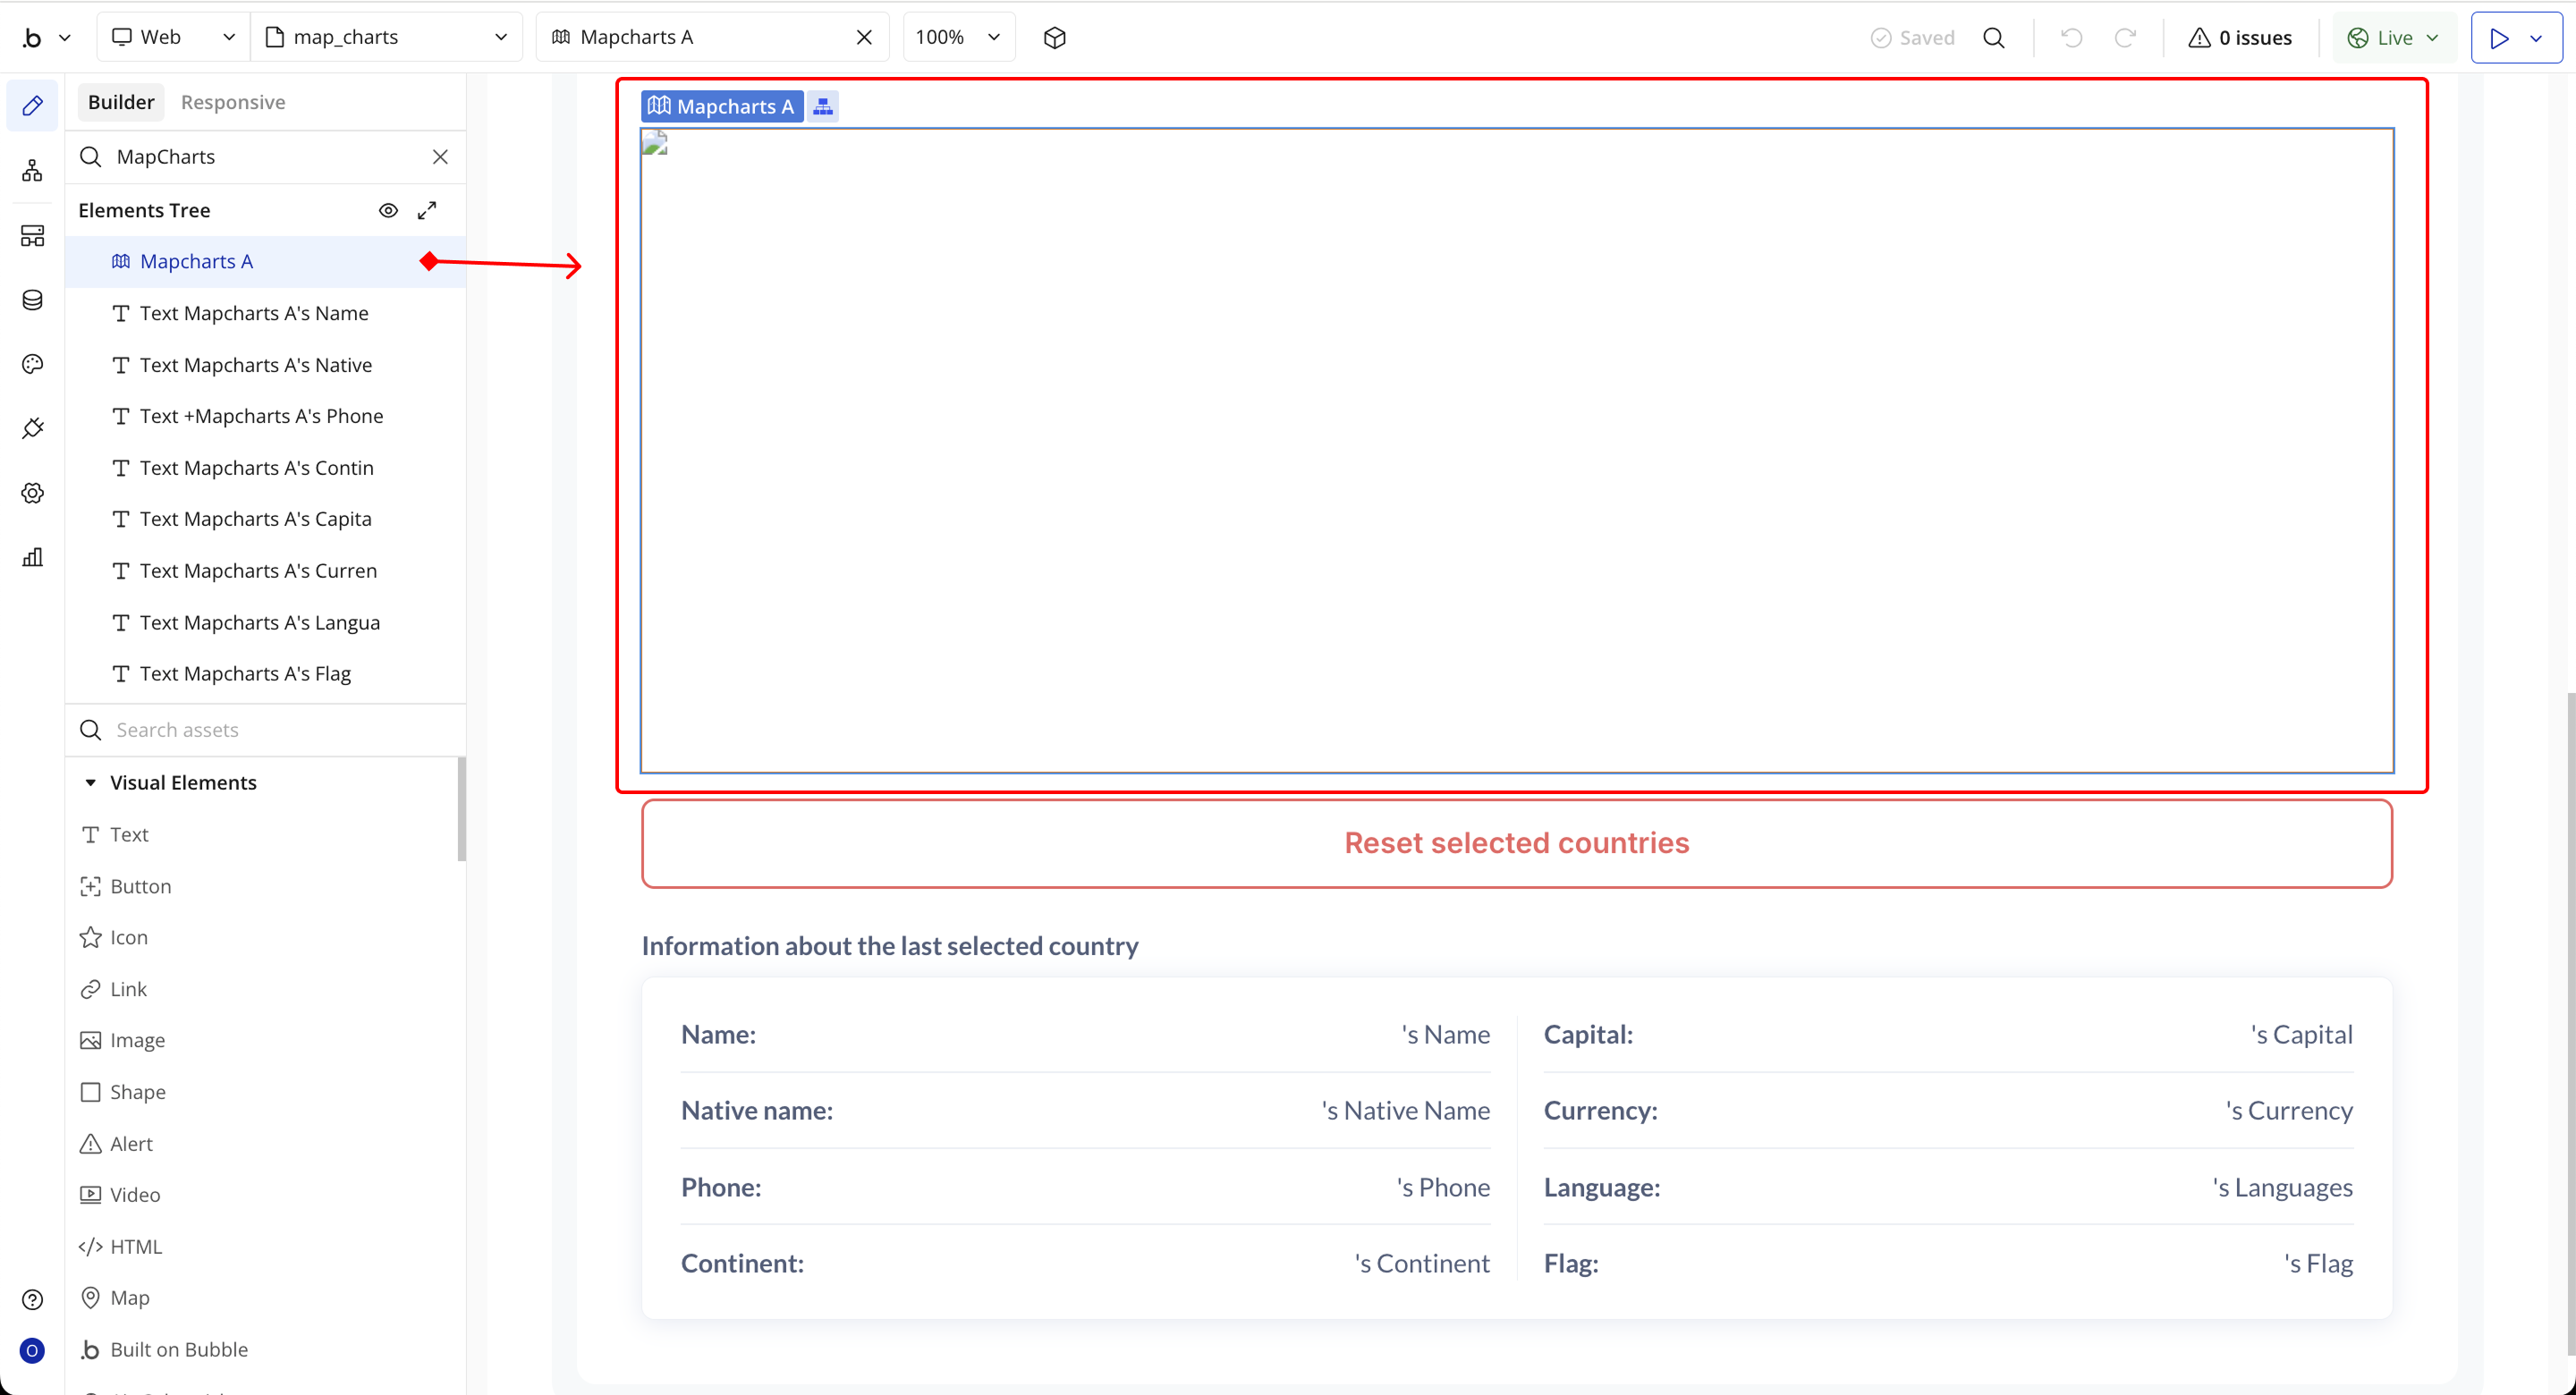
Step 3 – Configure Properties
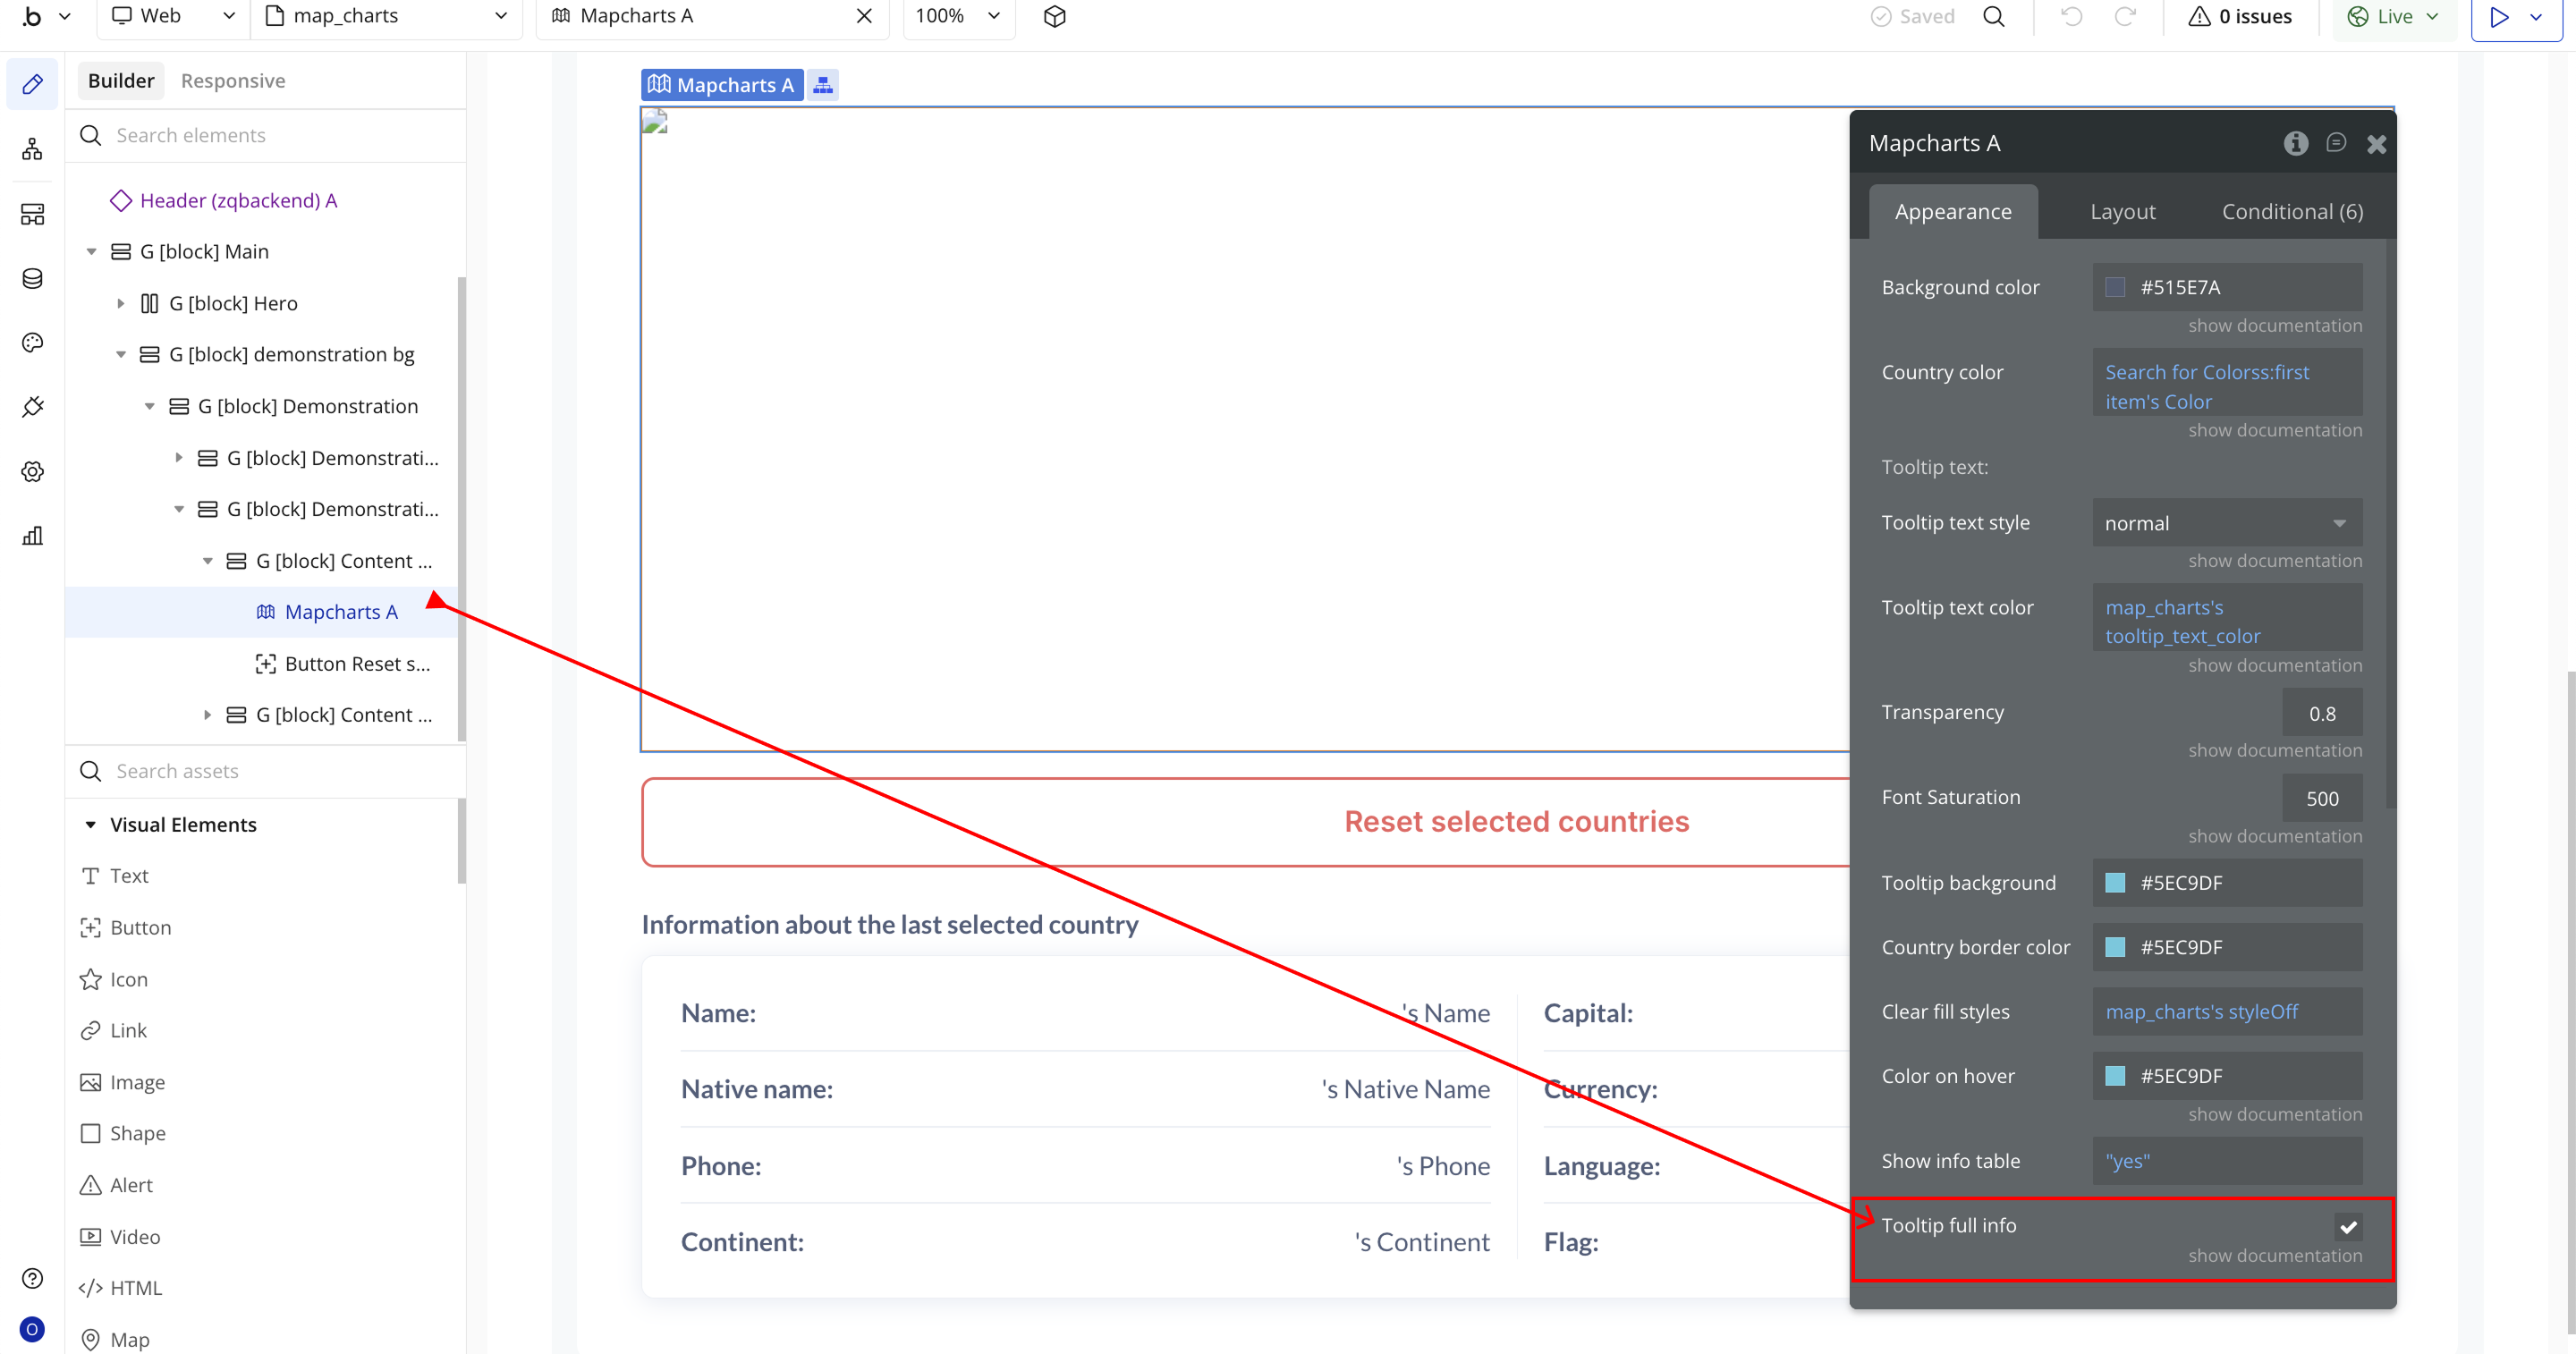
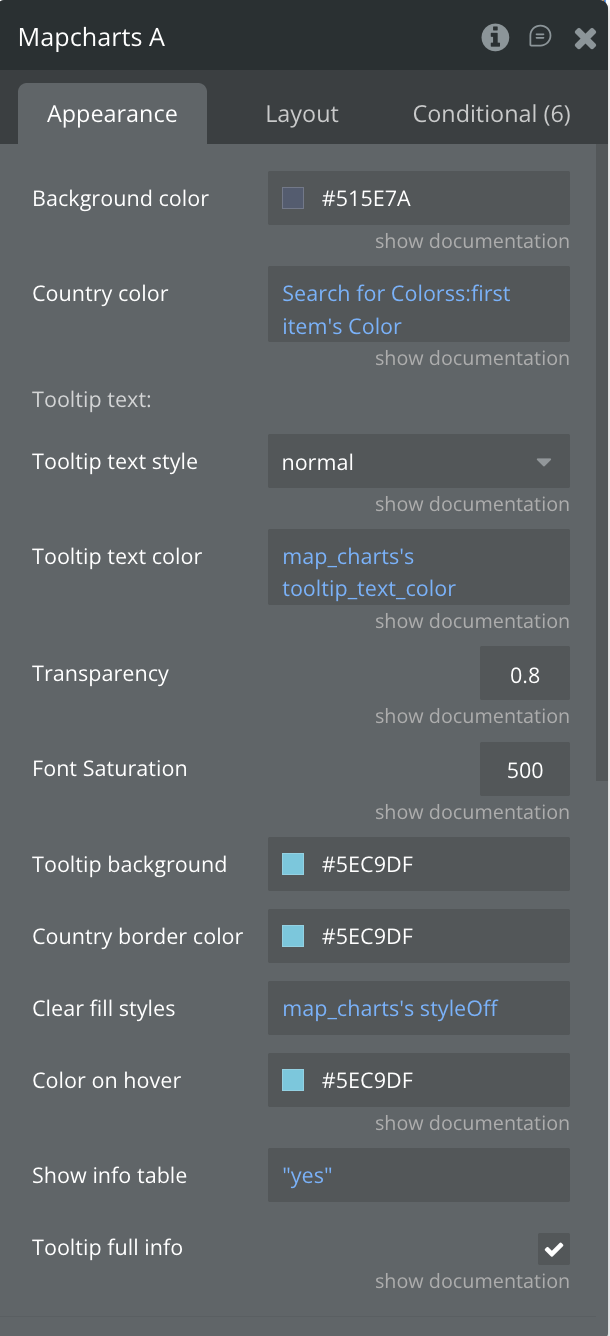
Select the element and configure its properties in the Property Editor.
- Background color → Sets the background color of the entire map.
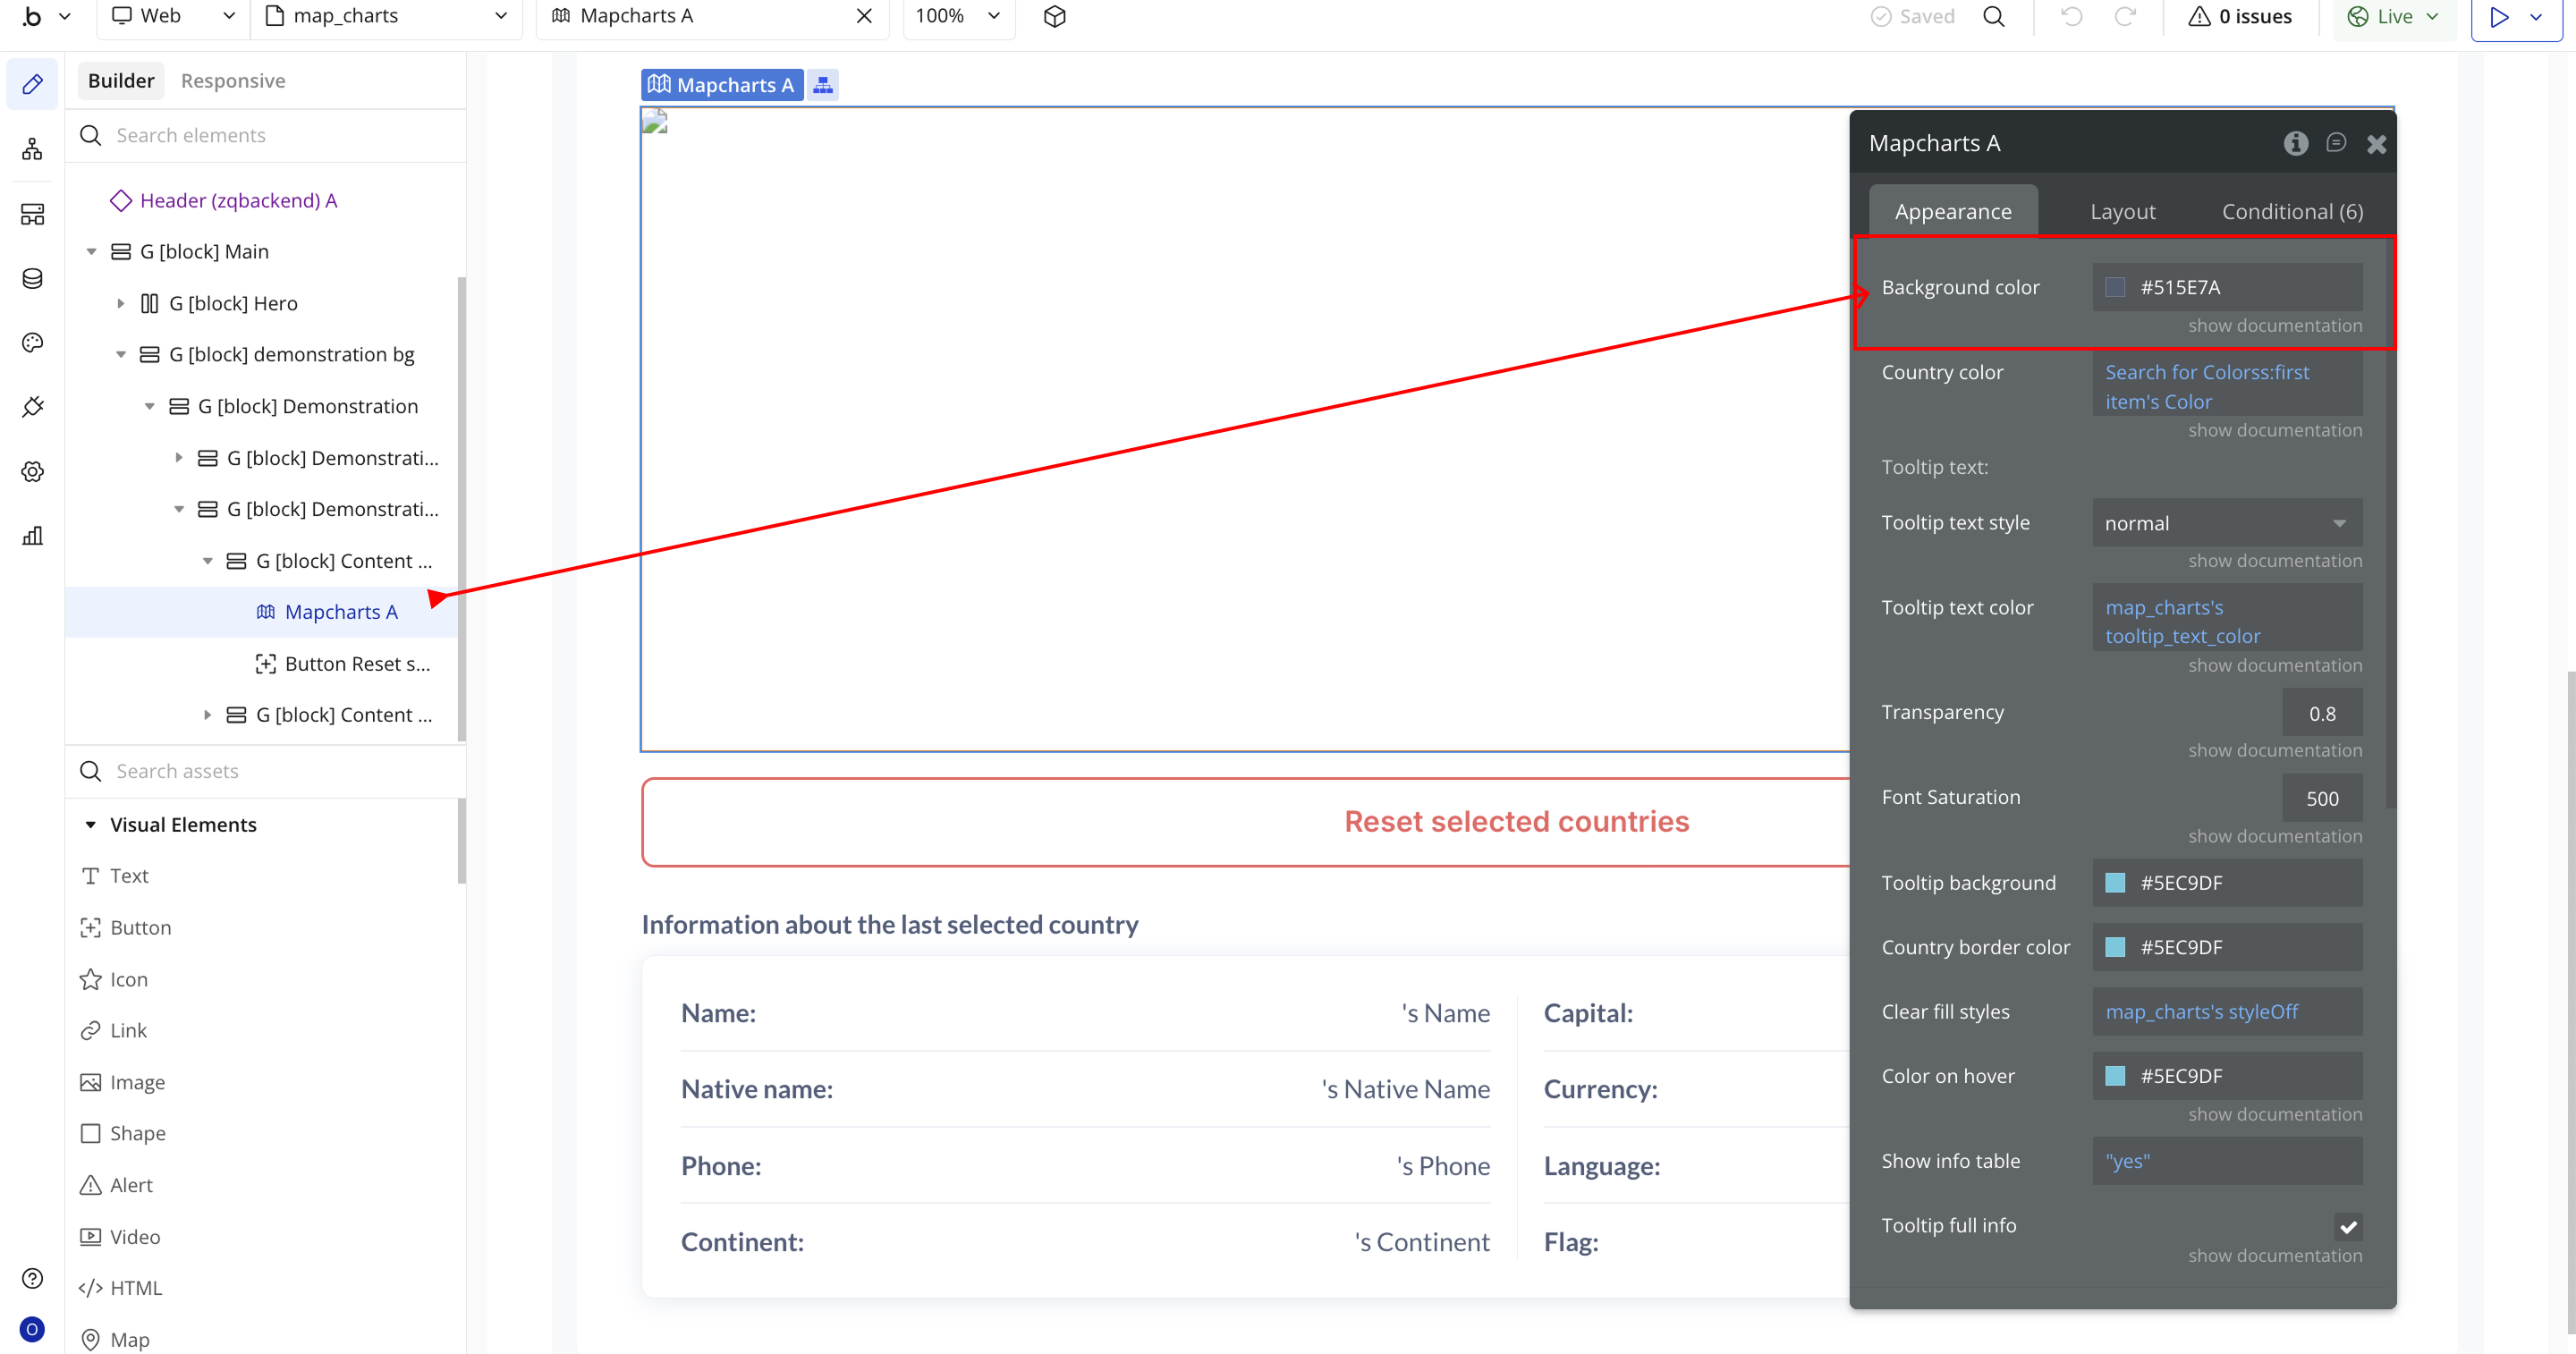
- Country color → Sets the default country fill color. Can be dynamic (e.g., from a plugin or database).

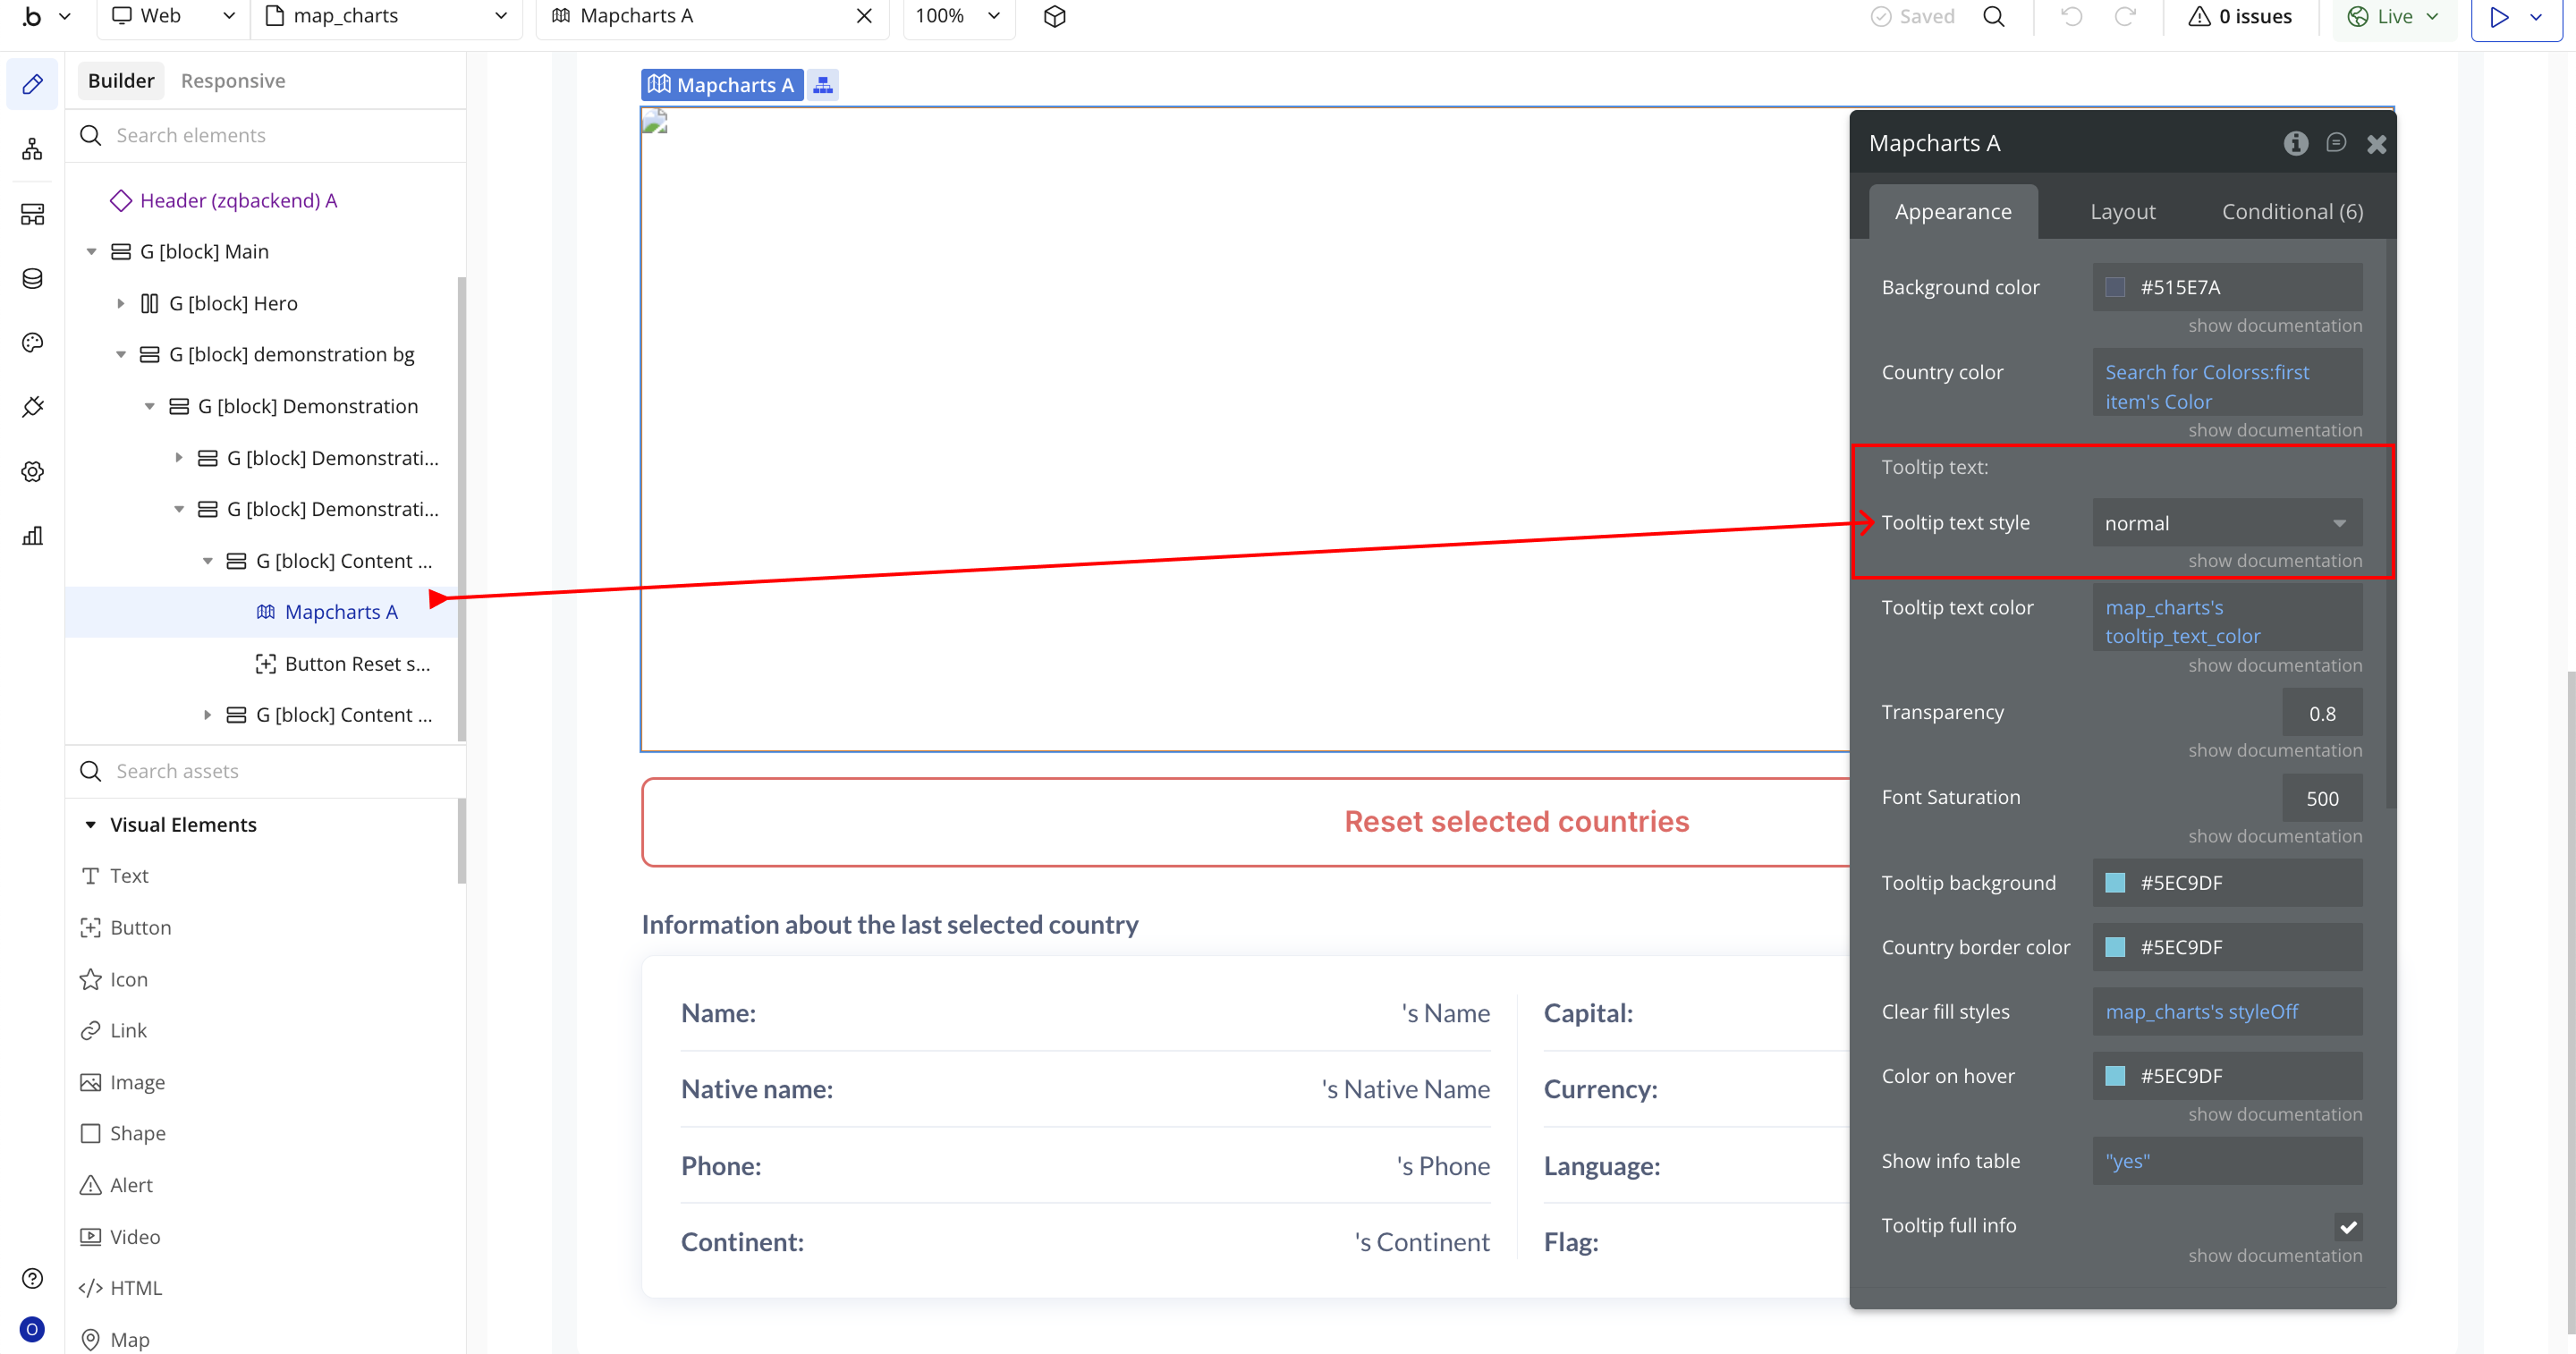
- Tooltip text style → Select the font style used in tooltip text (normal, italic, oblique).
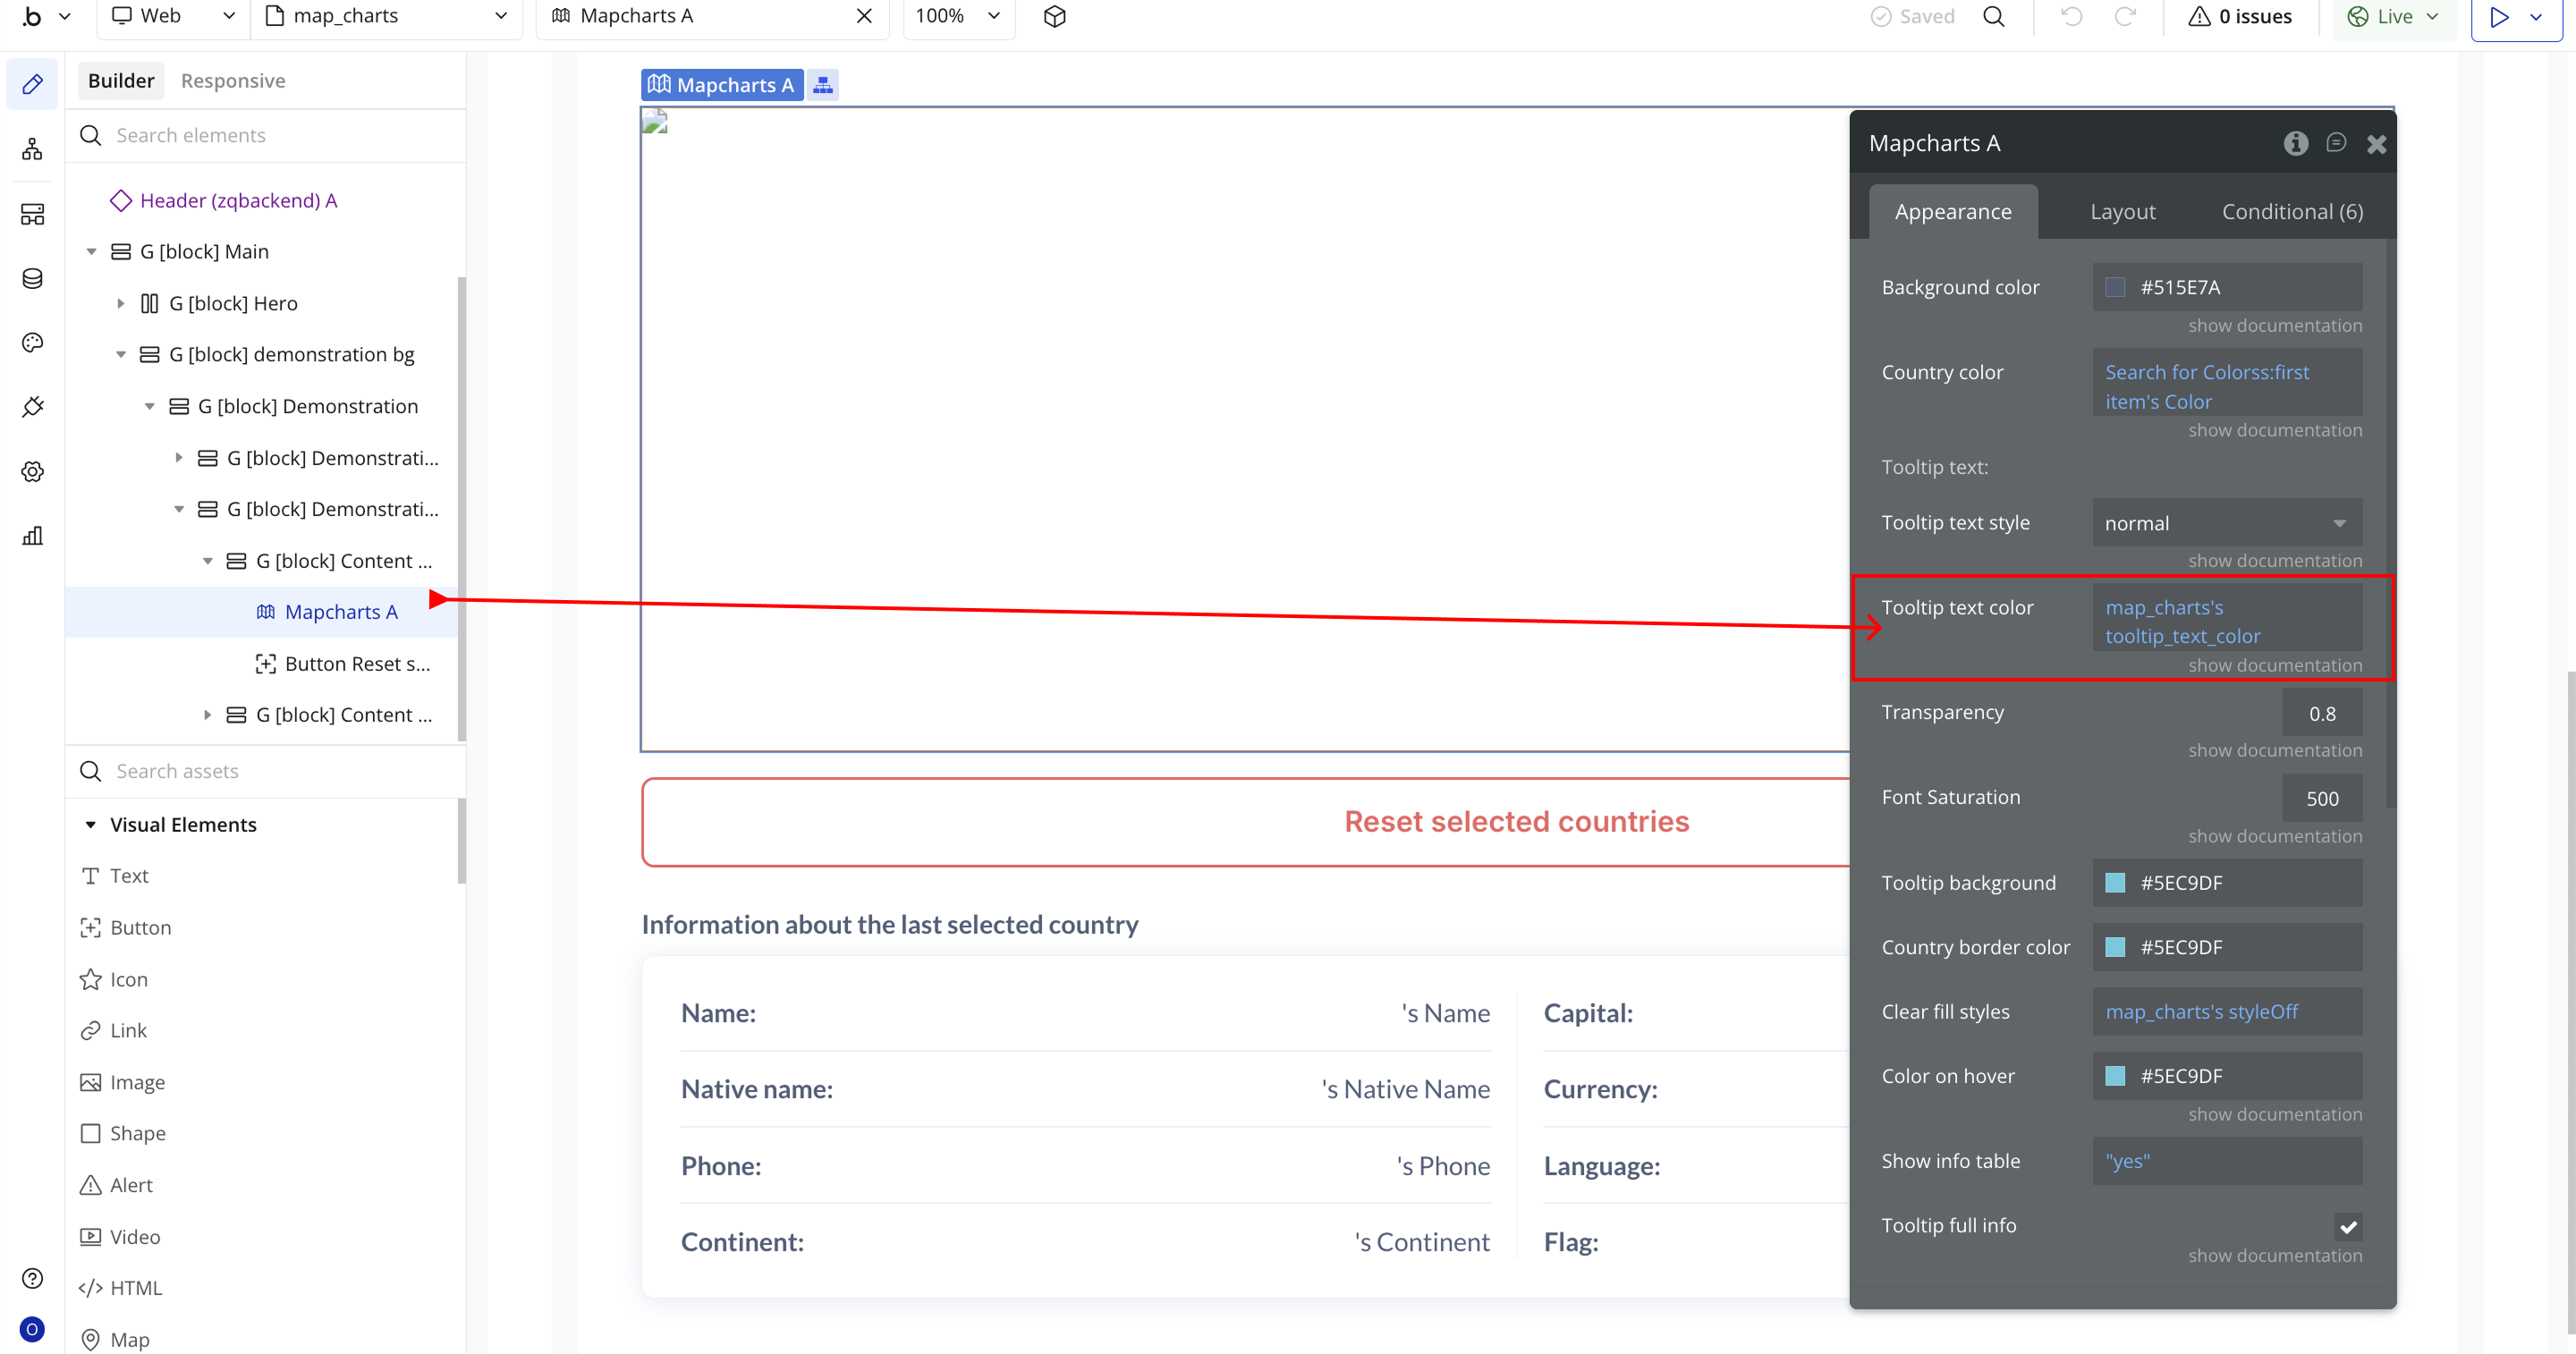
- Tooltip text color → Sets the color of the text displayed inside the tooltip.
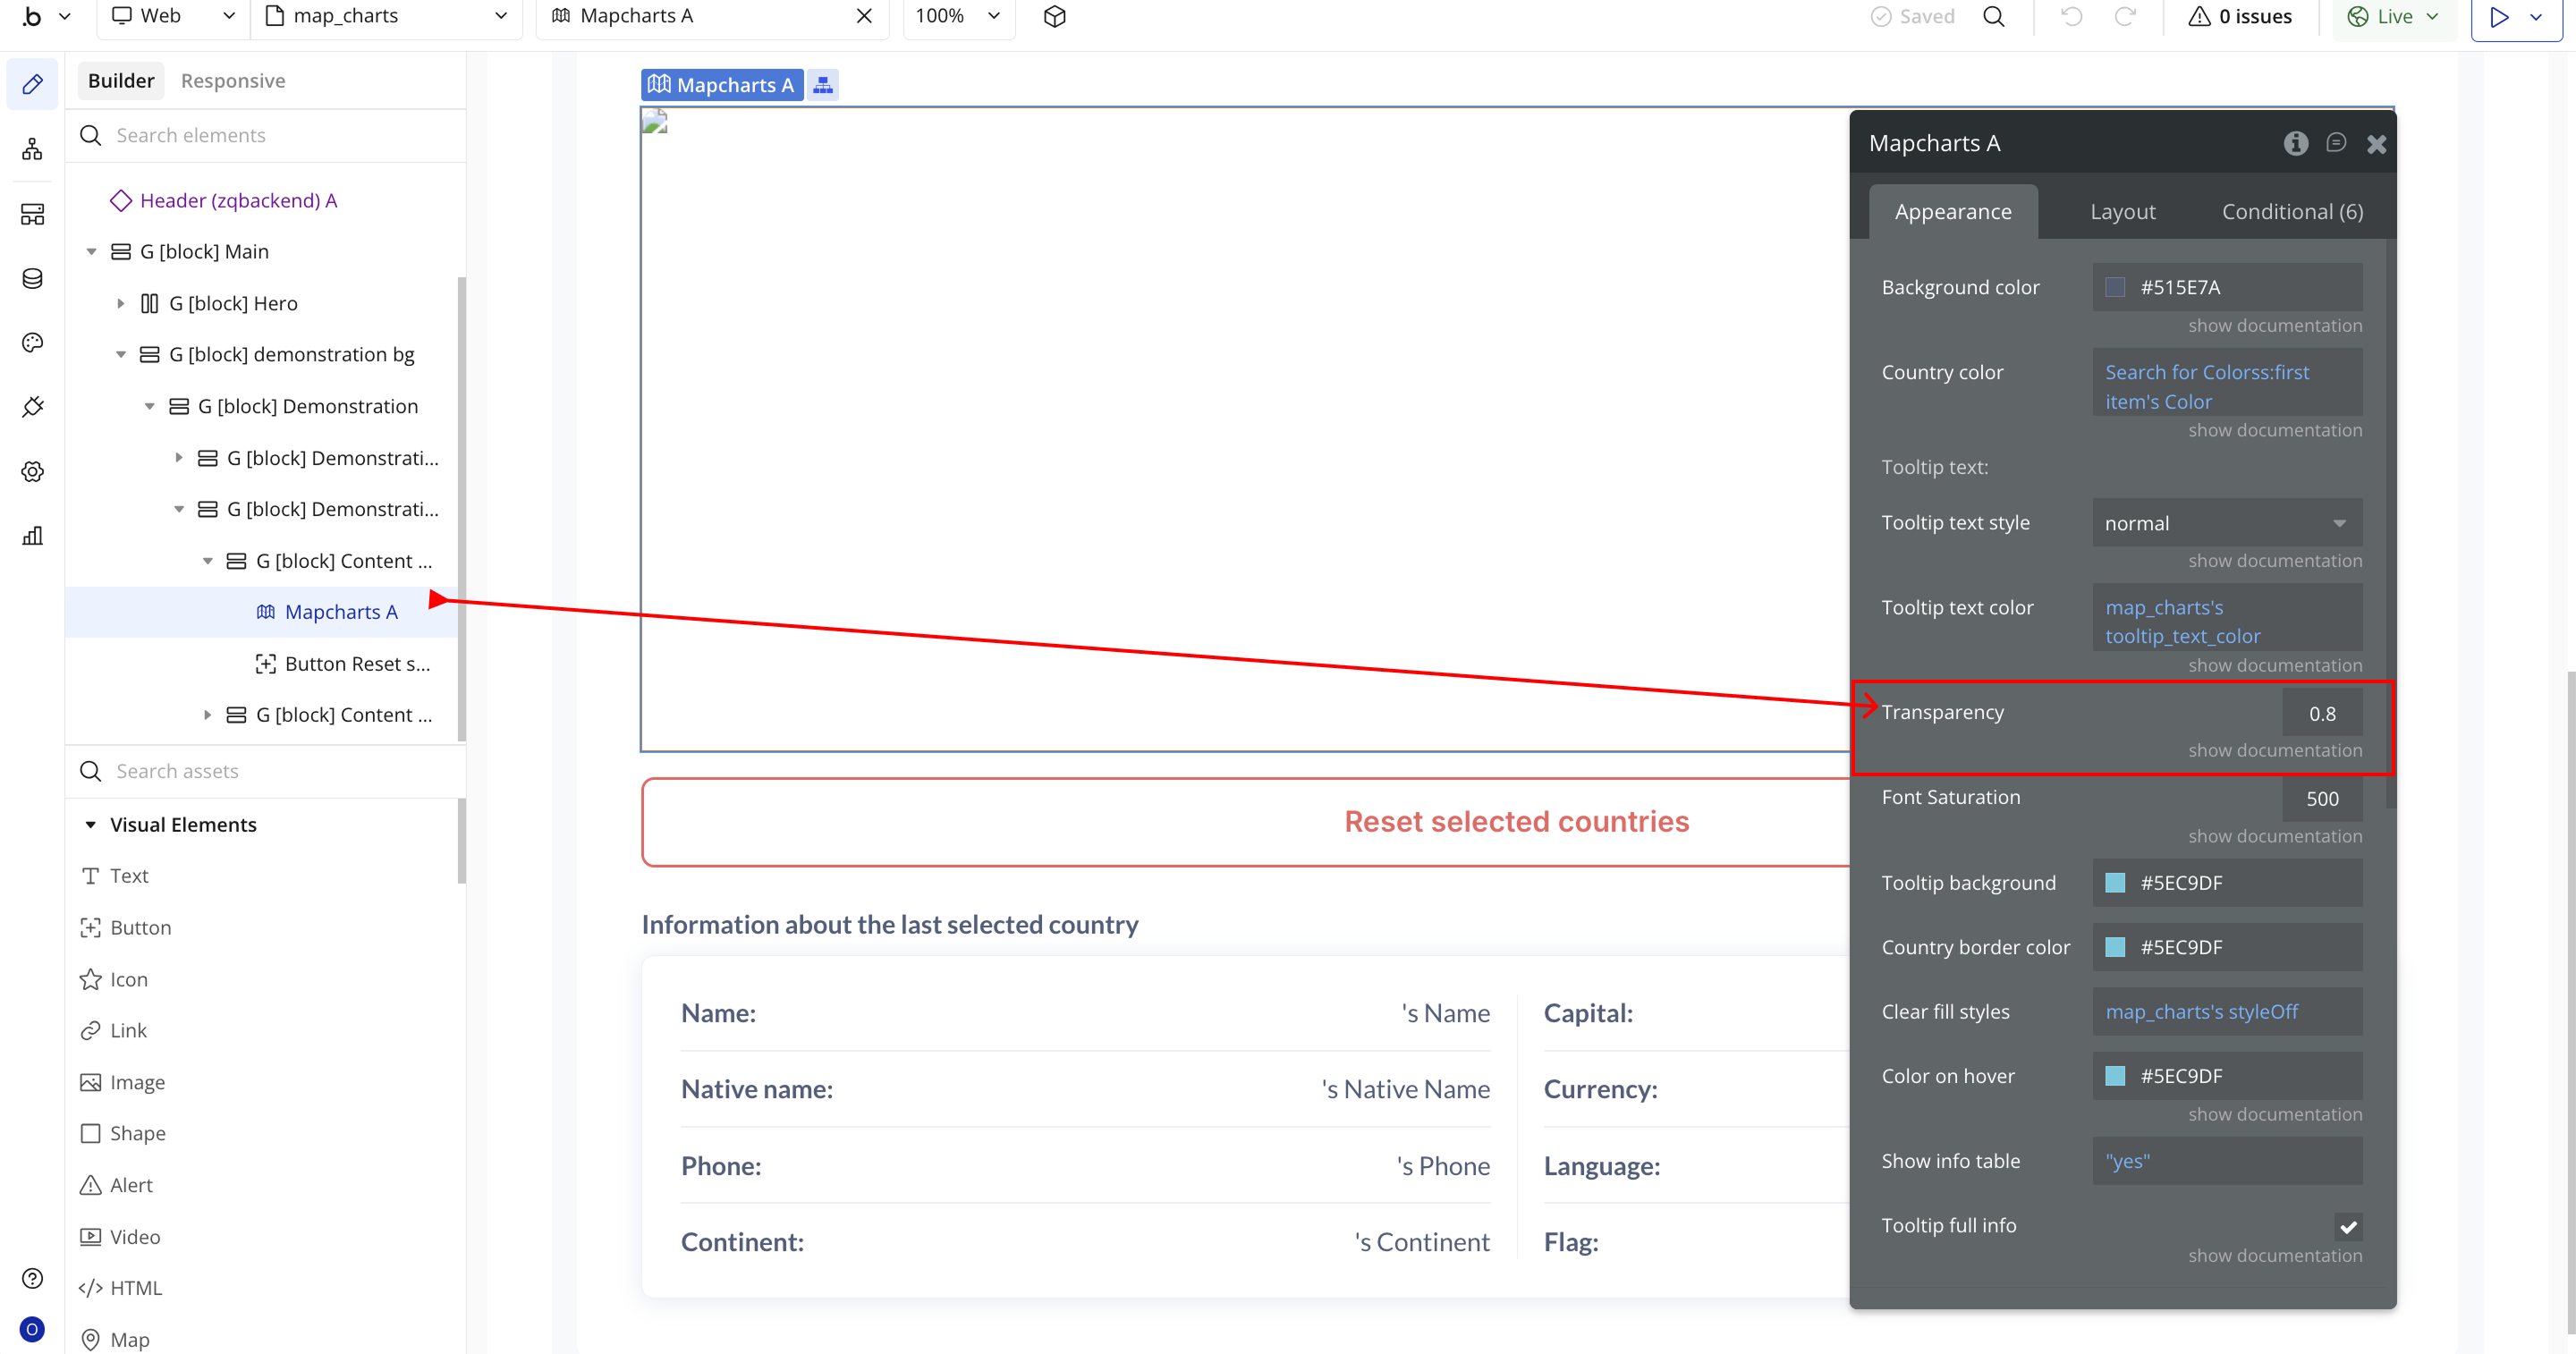
- Transparency → Controls map opacity from
0.0(transparent) to1.0(fully opaque).
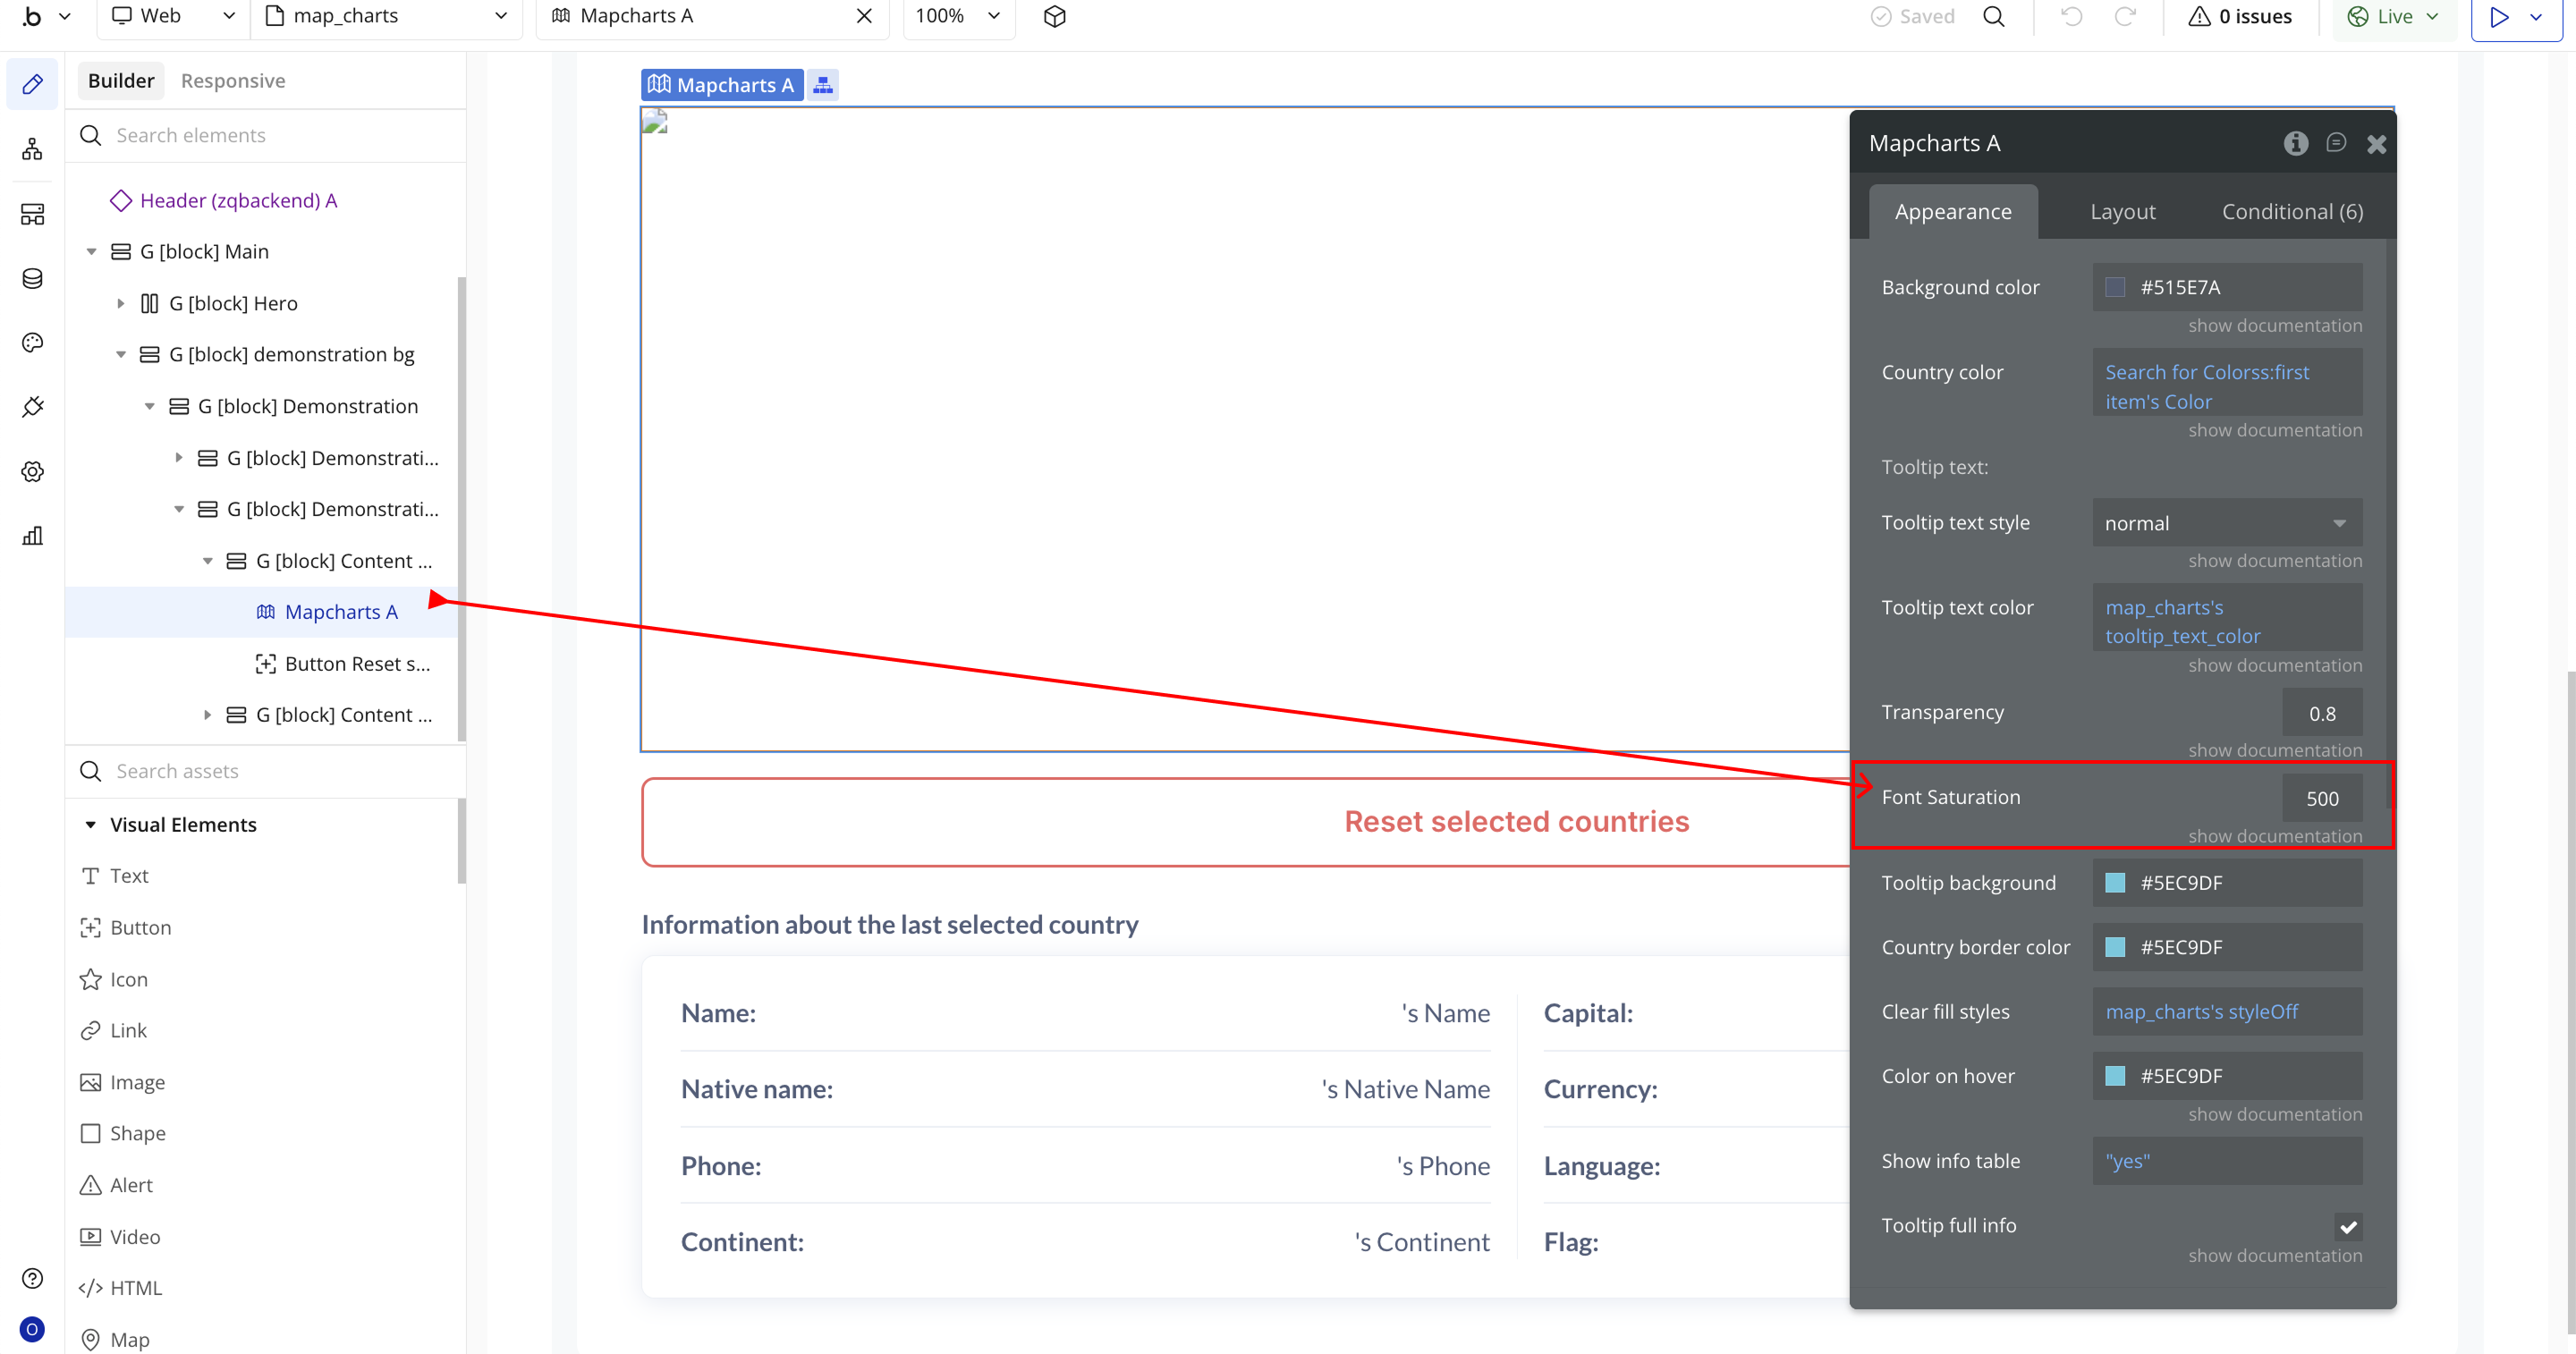
- Font Saturation → Adjusts the saturation intensity for map text and labels.
- Tooltip background → Defines the background color of the tooltip box.

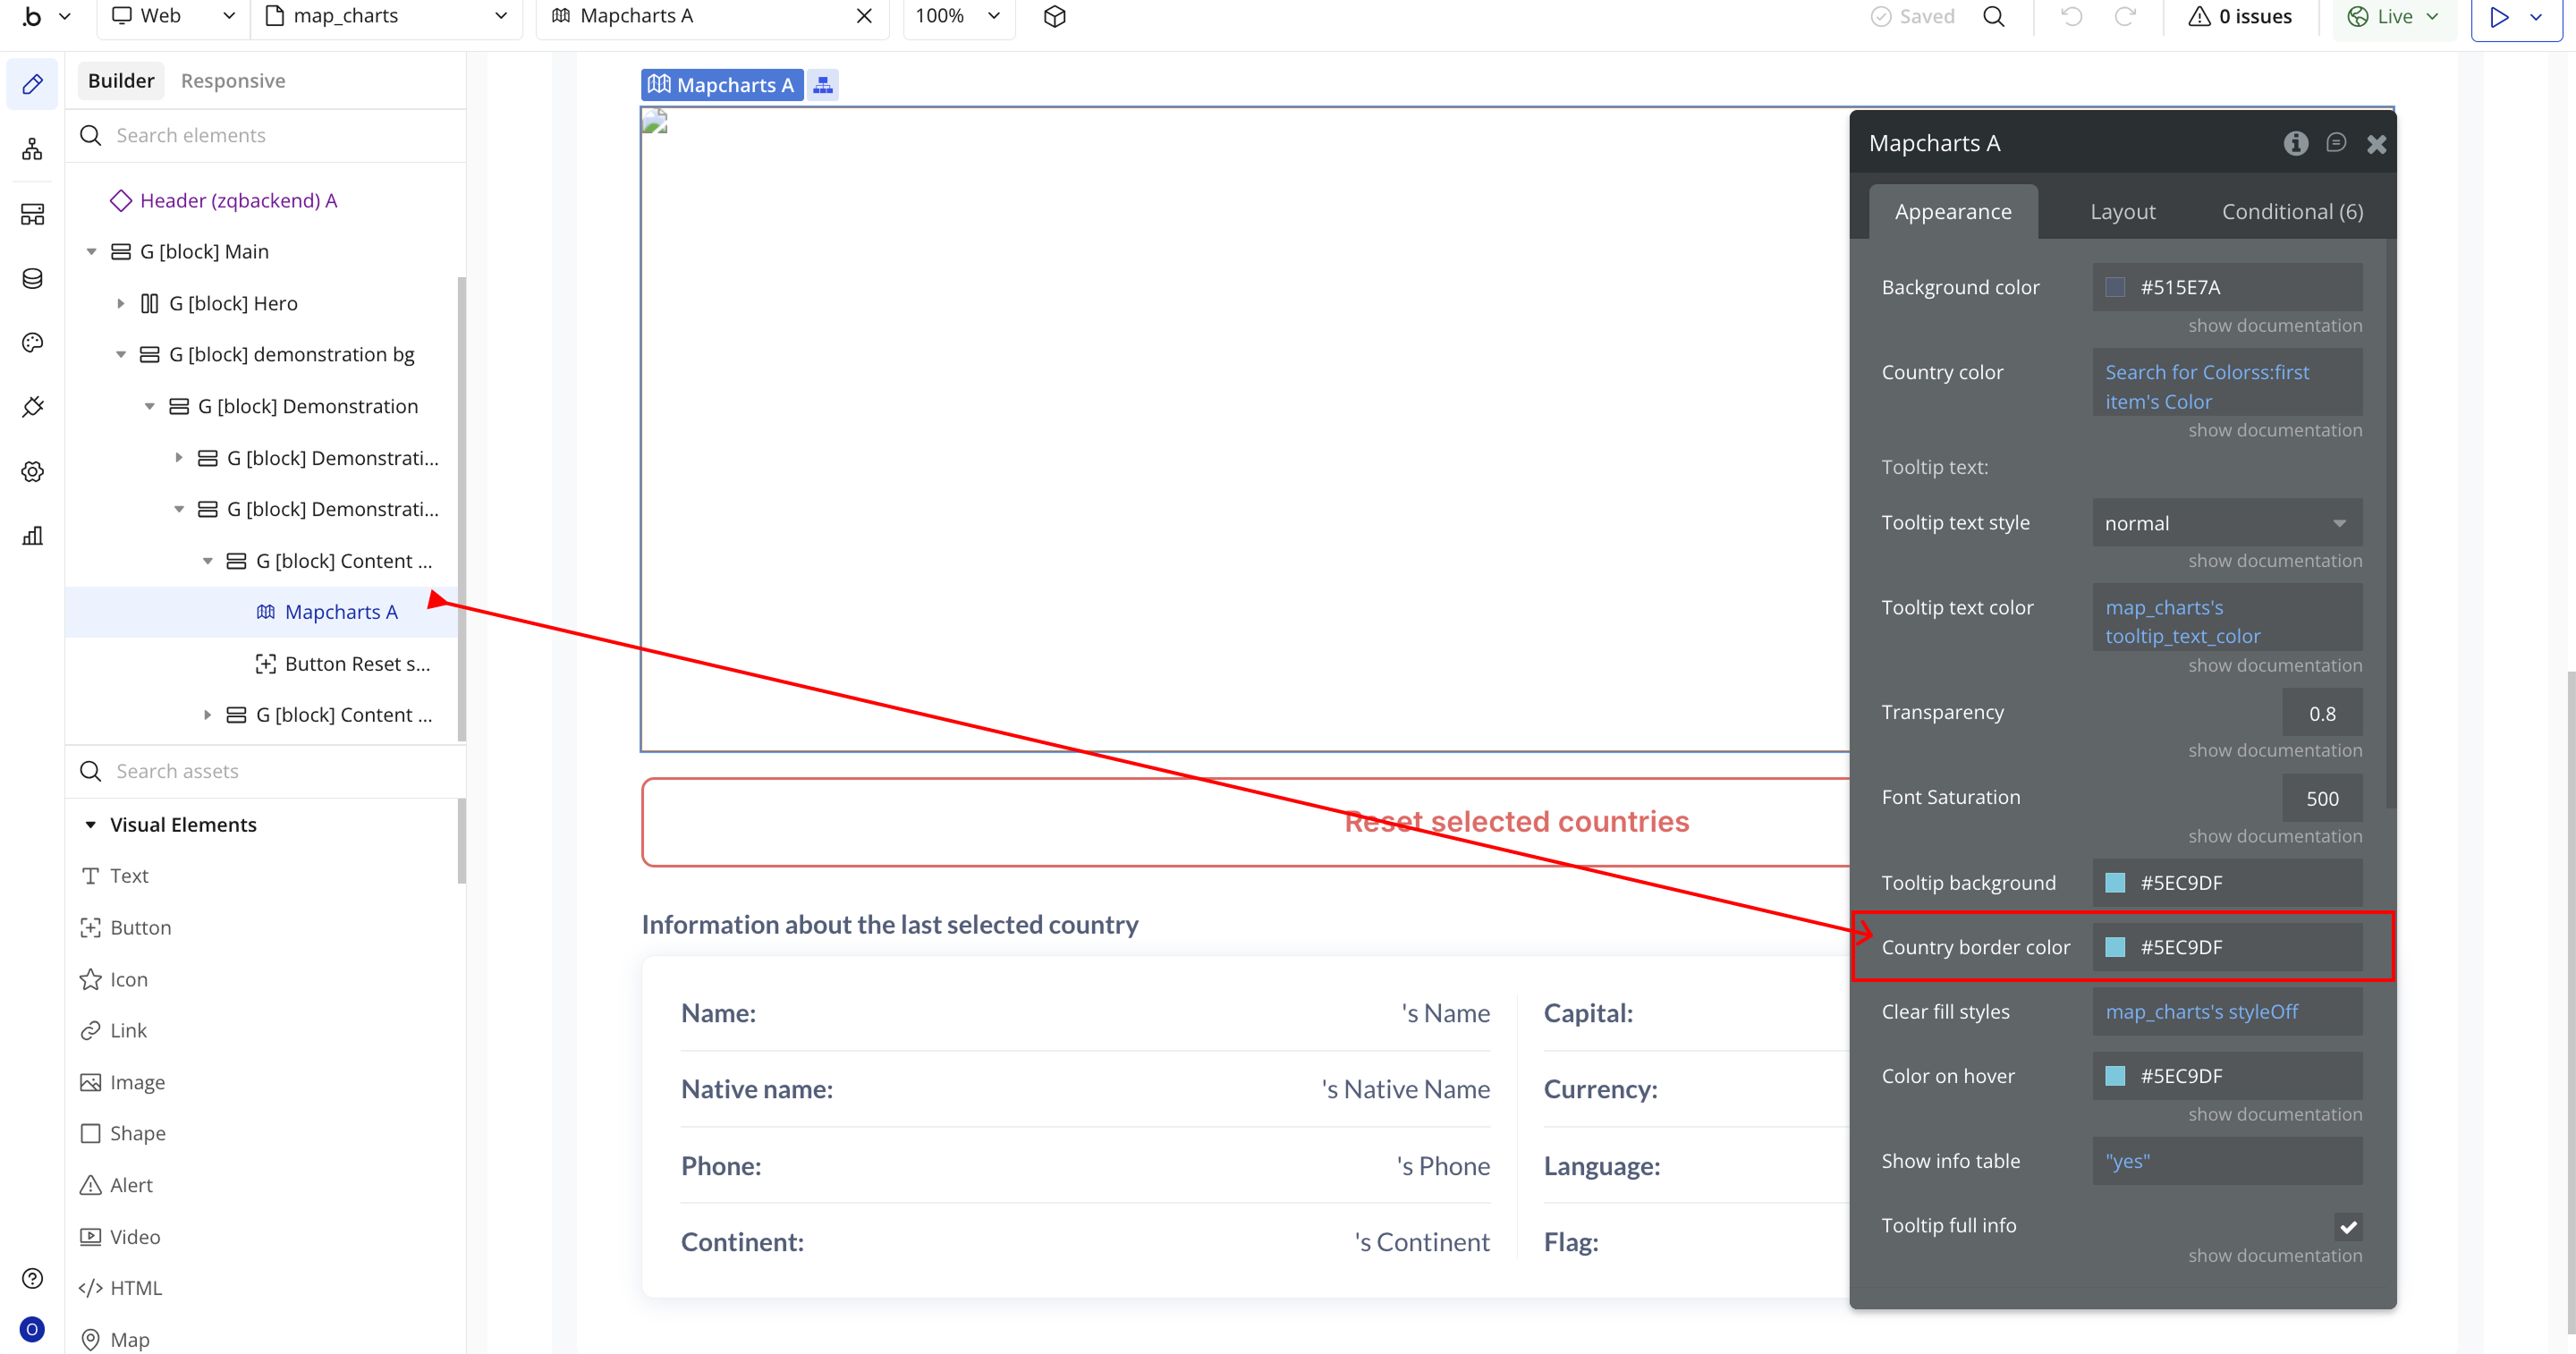
- Country border color → Sets the outline color around each country.
- Clear fill styles → Resets or removes previously applied fill colors and styles.

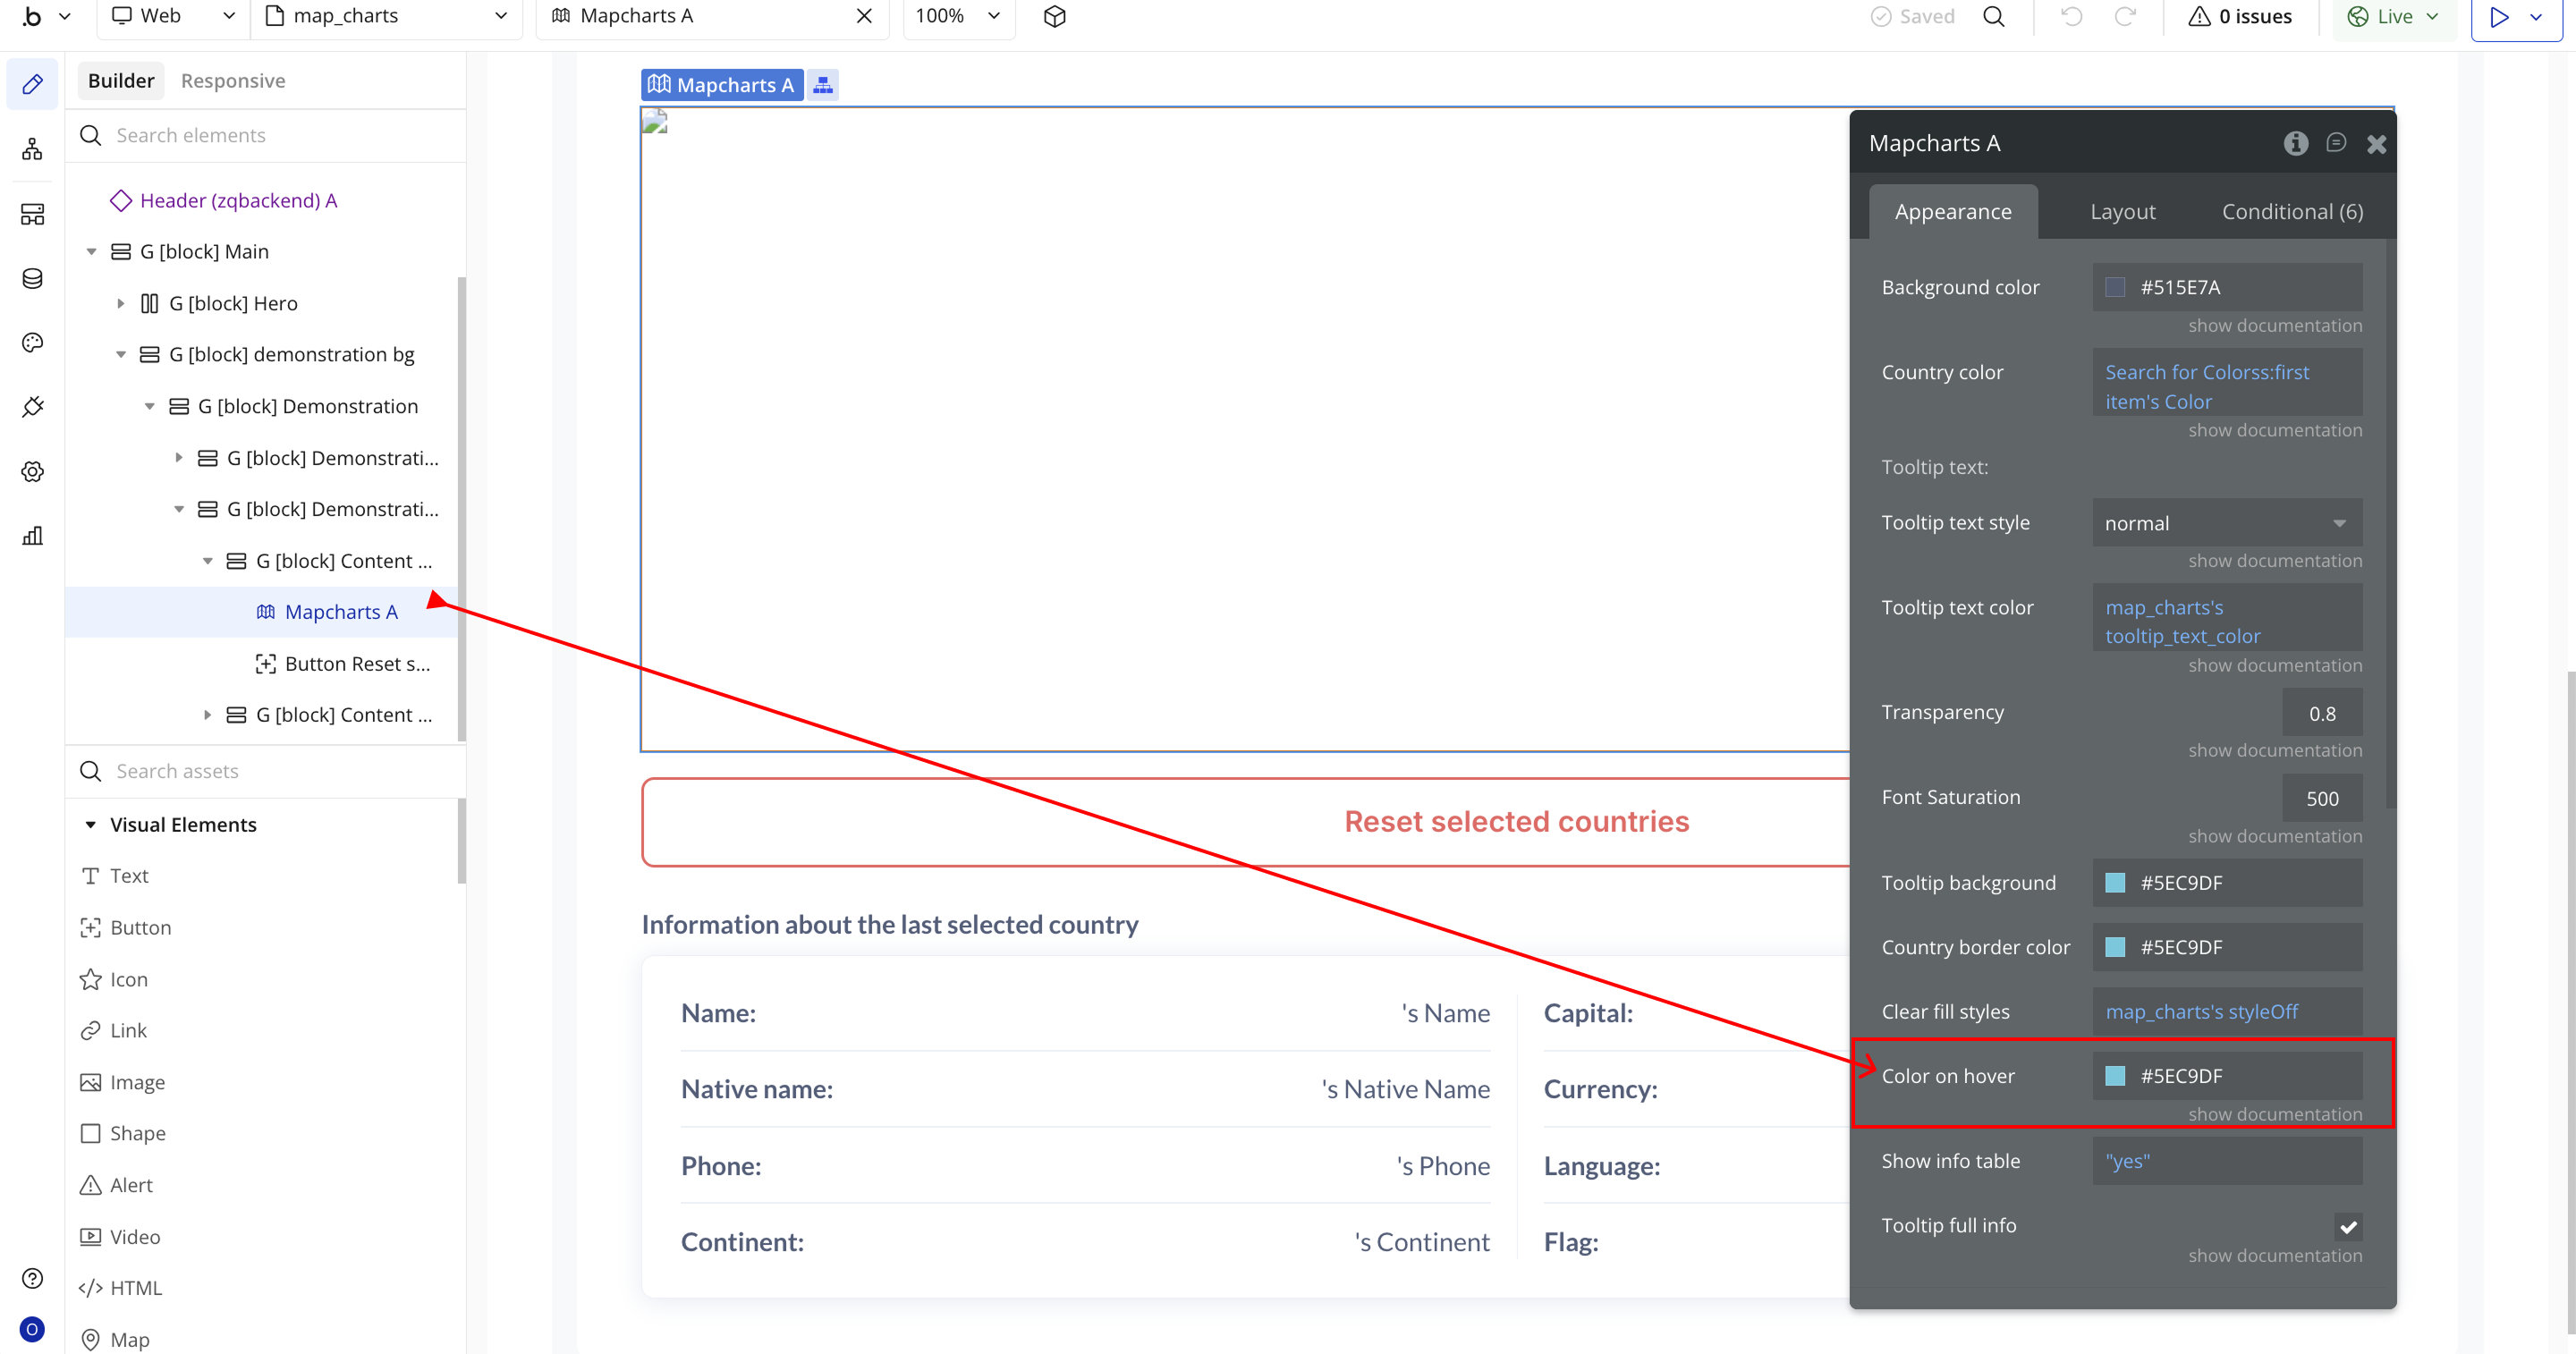
- Color on hover → Sets the highlight color shown when hovering over a country.
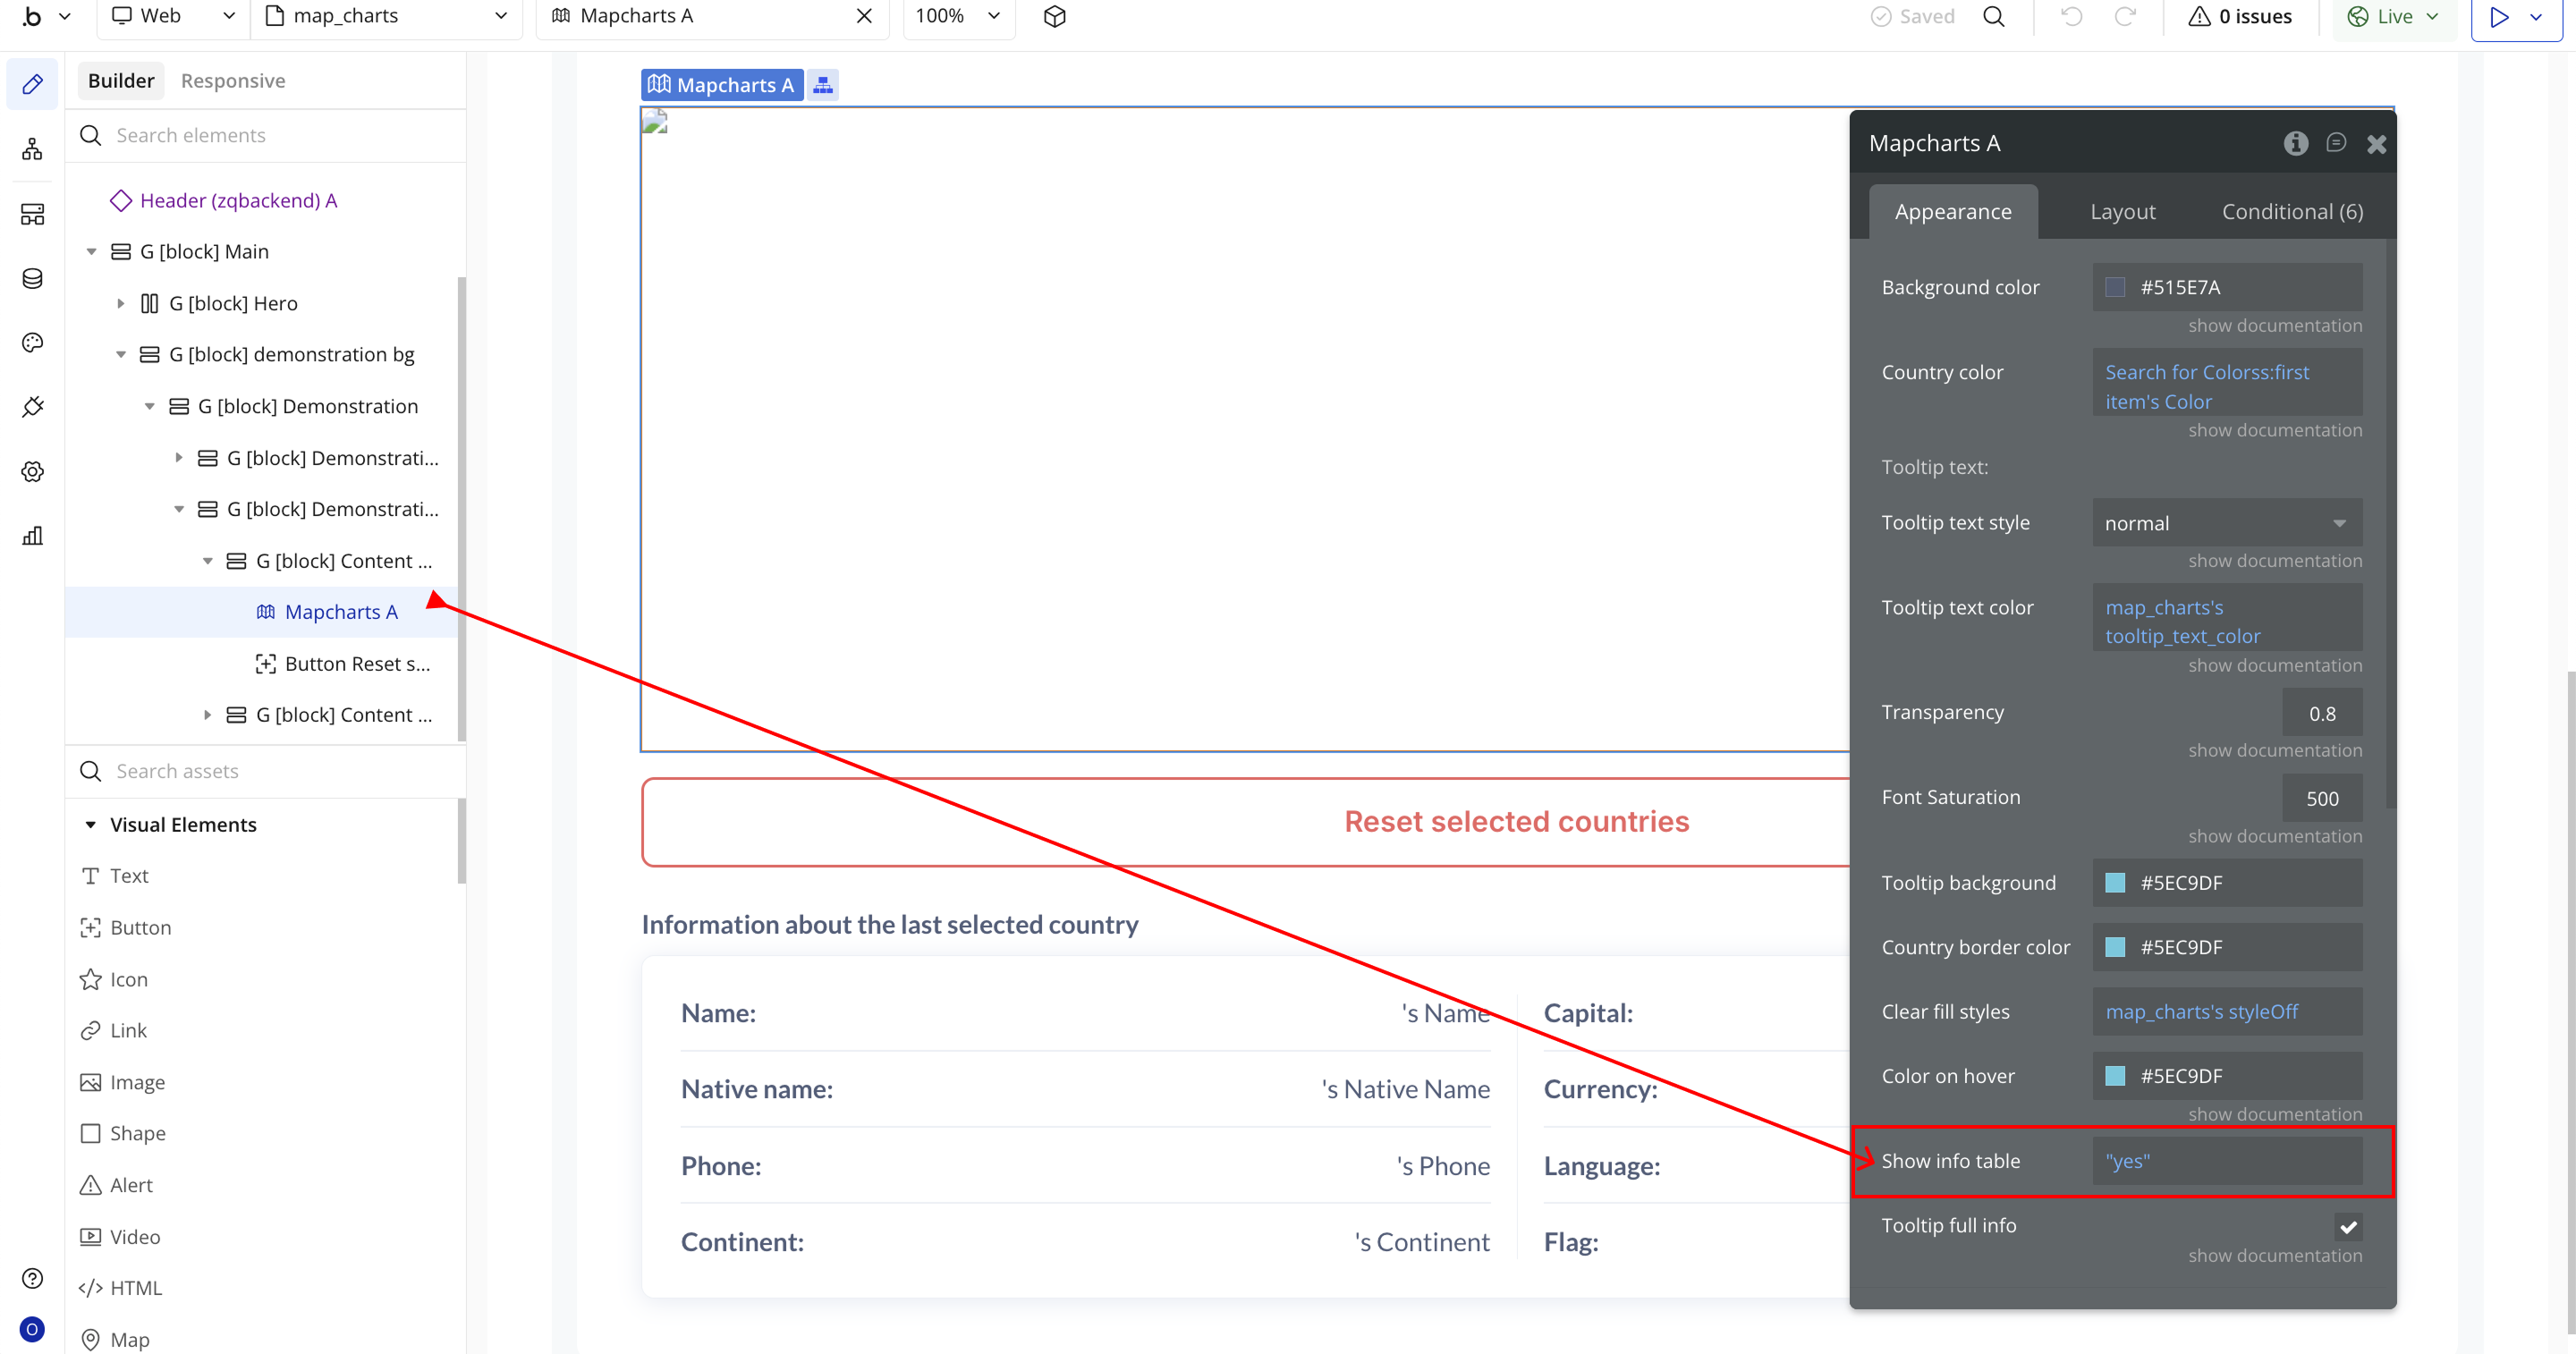
- Show info table → Toggles the display of a detailed information table for the selected region.
- Tooltip full info → Enables display of full country information inside the tooltip while hovering.
Plugin Element Properties - Map charts
Fields
Title | Description | Type |
Background color | Sets the background color of the entire map. | Color |
Country color | Sets the default color for each country. Can be set dynamically (e.g., using another plugin or database value). | Сolor (optional) |
Tooltip text style | Selects the font style for the tooltip text. Available options: normal, italic, oblique. | Dropdown |
Tooltip text color | Sets the text color displayed in the tooltip. | Color |
Transparency | Controls map opacity - from 0.0 (fully transparent) to 1.0 (fully opaque). | Number |
Font Saturation | Adjusts the saturation intensity of map text and labels. | Number |
Tooltip background | Sets the background color of the tooltip container. | Color |
Country border color | Sets the border color outline for each country. | Color |
Clear fill styles | Removes any previously applied fill styles and resets color behavior. | Checkbox (yes/no) |
Color on hover | Sets the highlight color that appears when a user hovers over a country. | Color |
Show info table | Enables or disables the information table display when hovering over a region. | Checkbox (yes/no) |
Tooltip full info | Toggles whether full country information is displayed inside the tooltip when hovering. | Checkbox (yes/no) |
Exposed states
Title | Description | Type |
Name | Returns the official name of the selected country or region. | Text |
Native Name | Returns the country’s name in its native/local language. | Text |
Phone | Returns the international dialing code for the selected country. | Number |
Continent | Shows the continent where the selected country is located (e.g., Africa, Europe). | Text |
Capital | Returns the name of the capital city. | Text |
Currency | Displays the currency used in the selected country (e.g., USD, NGN, EUR). | Text |
Languages | Returns a list of languages officially spoken in the country. | Text |
Flag | Returns a URL link or identifier for the country’s official flag. | Text |
Element Events
Title | Description |
Map is clicked | Triggered when a user clicks on any country, city, or region on the map. You can use this event in workflows to display detailed information, update elements, or run other actions based on the selected region. |

Changelogs
Update 22.12.25 - Version 1.25.0
- Bubble Plugin Page Update (Docs).
Update 18.07.25 - Version 1.24.0
- Bubble Plugin Page Update (Logo).
Update 17.06.25 - Version 1.23.0
- Marketing update (minor change).
Update 14.05.25 - Version 1.22.0
- Minor update (Marketing update).
Update 14.05.25 - Version 1.21.0
- Minor update (Marketing update).
Update 28.01.25 - Version 1.20.0
- Fixed double clicking for country selection.
Update 16.01.25 - Version 1.19.0
- Fixed scrollbar styles, element responsiveness and added element border functionality.
Update 23.07.24 - Version 1.18.0
- Minor update.
Update 13.06.24 - Version 1.17.0
- Updated demo/service links.
Update 09.04.24 - Version 1.16.0
- minor update.
Update 19.10.23 - Version 1.15.0
- updated description.
Update 15.09.23 - Version 1.14.0
- updated description.
Update 12.09.23 - Version 1.13.0
- minor updates.
Update 06.09.23 - Version 1.12.0
- Obfuscation.
Update 11.07.23 - Version 1.11.0
- updated description.
Update 19.06.23 - Version 1.10.0
- Updated the description .
Update 23.02.23 - Version 1.9.0
- deleted the icons.
Update 22.02.23 - Version 1.8.0
- updated the description.
Update 16.07.21 - Version 1.7.0
- Element 'Info table' is deprecated and updated icon.
Update 12.07.21 - Version 1.6.0
- Added dynamic value for fields for color and fixed multiple displaying.
Update 18.02.21 - Version 1.5.0
- Updated icon.
Update 08.05.20 - Version 1.4.0
- Updated description.
Update 05.05.20 - Version 1.3.0
- Improvements and stability update.
Update 05.05.20 - Version 1.2.0
- Updated description.
Update 21.04.20 - Version 1.1.0
- Plugin improvements, added dynamic info table element.
Update 10.04.20 - Version 1.0.0
- Initial Release.