✅
Demo to preview the settings
✅
Introduction
Full statistics for emails you send from your app when connected to SendGrid. Get counts for delivered, bounced, clicked, and more. Plus date aggregation and filters all with our plugin.

Prerequisites
- You must create the SendGrid API key.
How to set up
Create your API Key
Follow the steps below to acquire the necessary API Key to use this plugin.
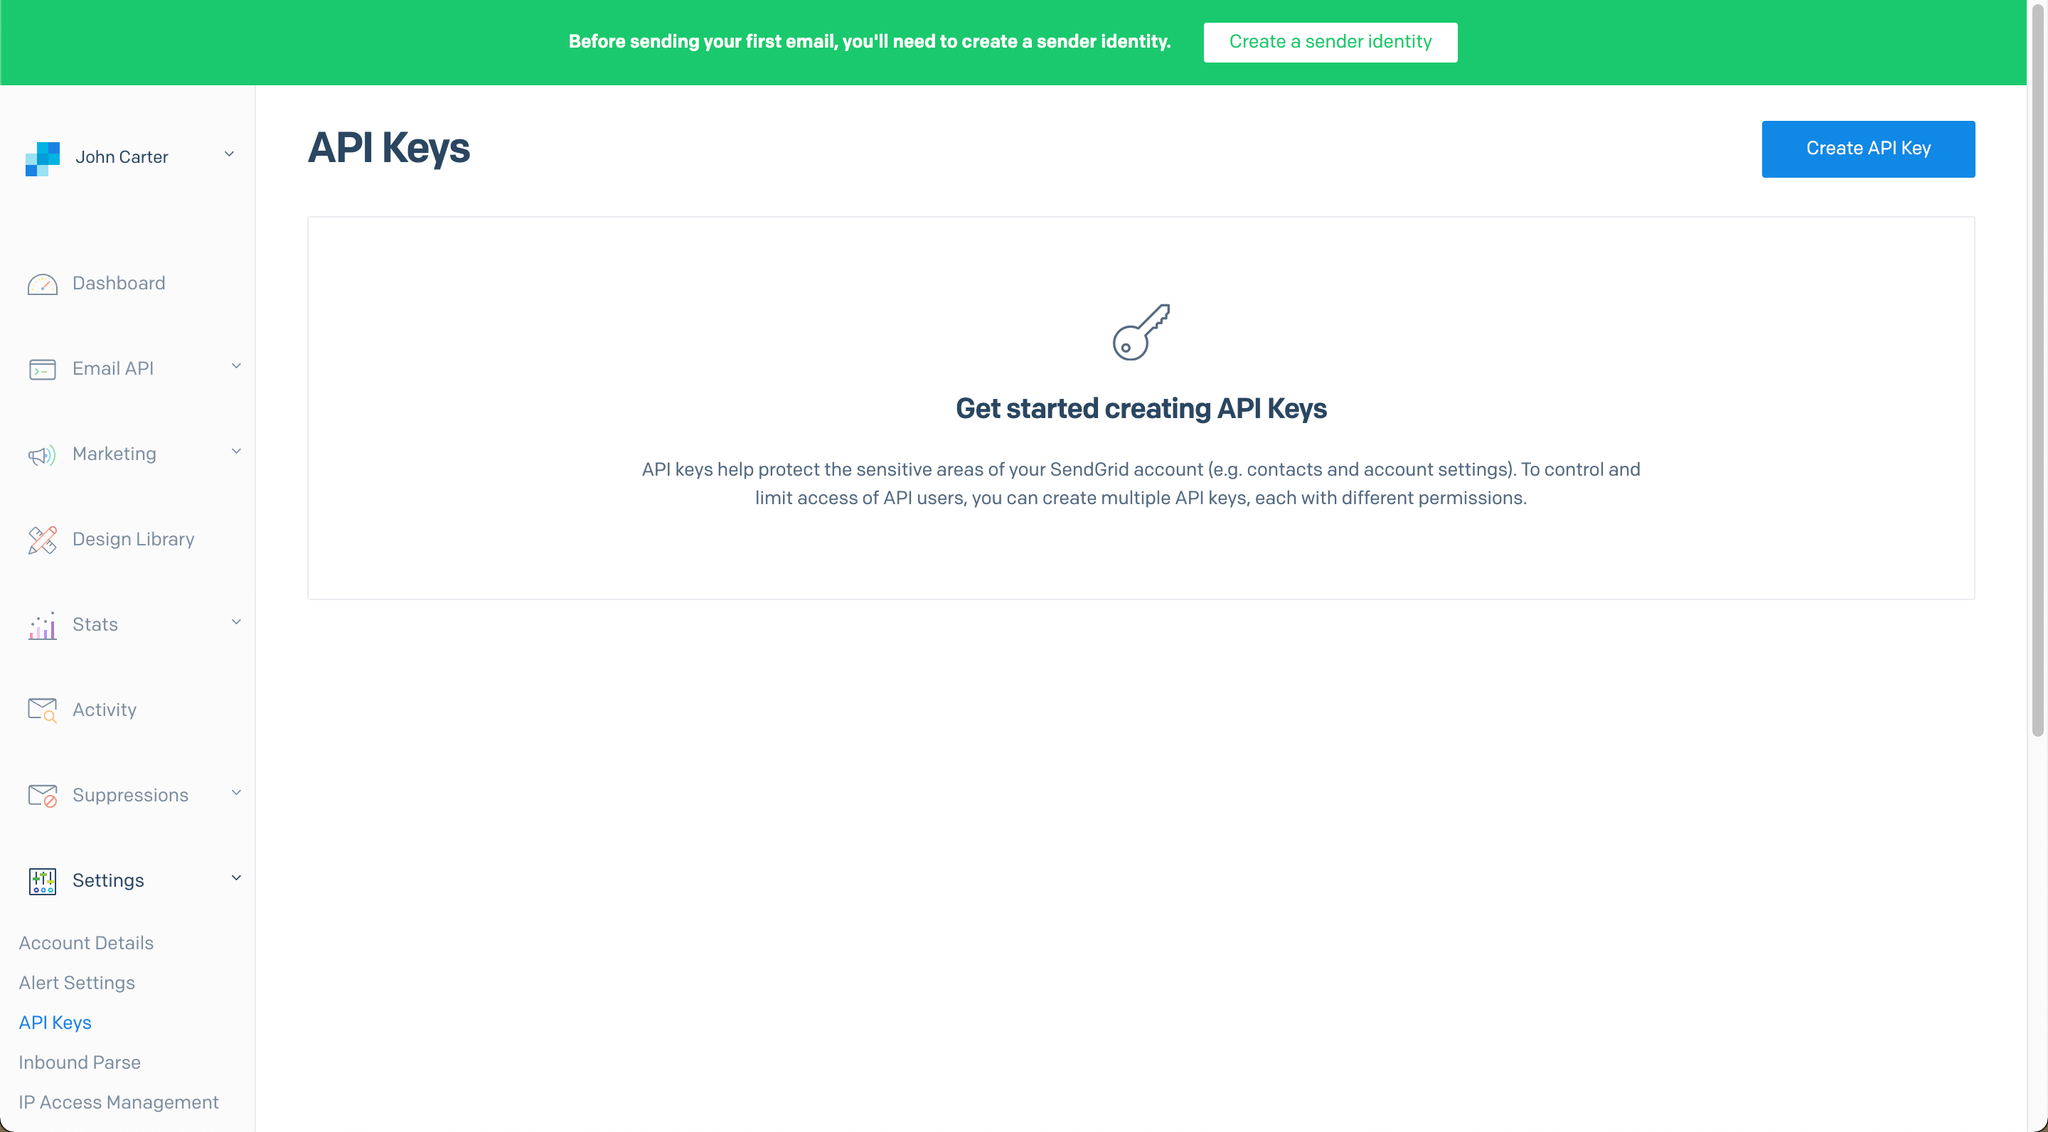
- Navigate first to https://app.sendgrid.com/settings/api_keys
- Select "Create API Key" in the top right-hand corner:
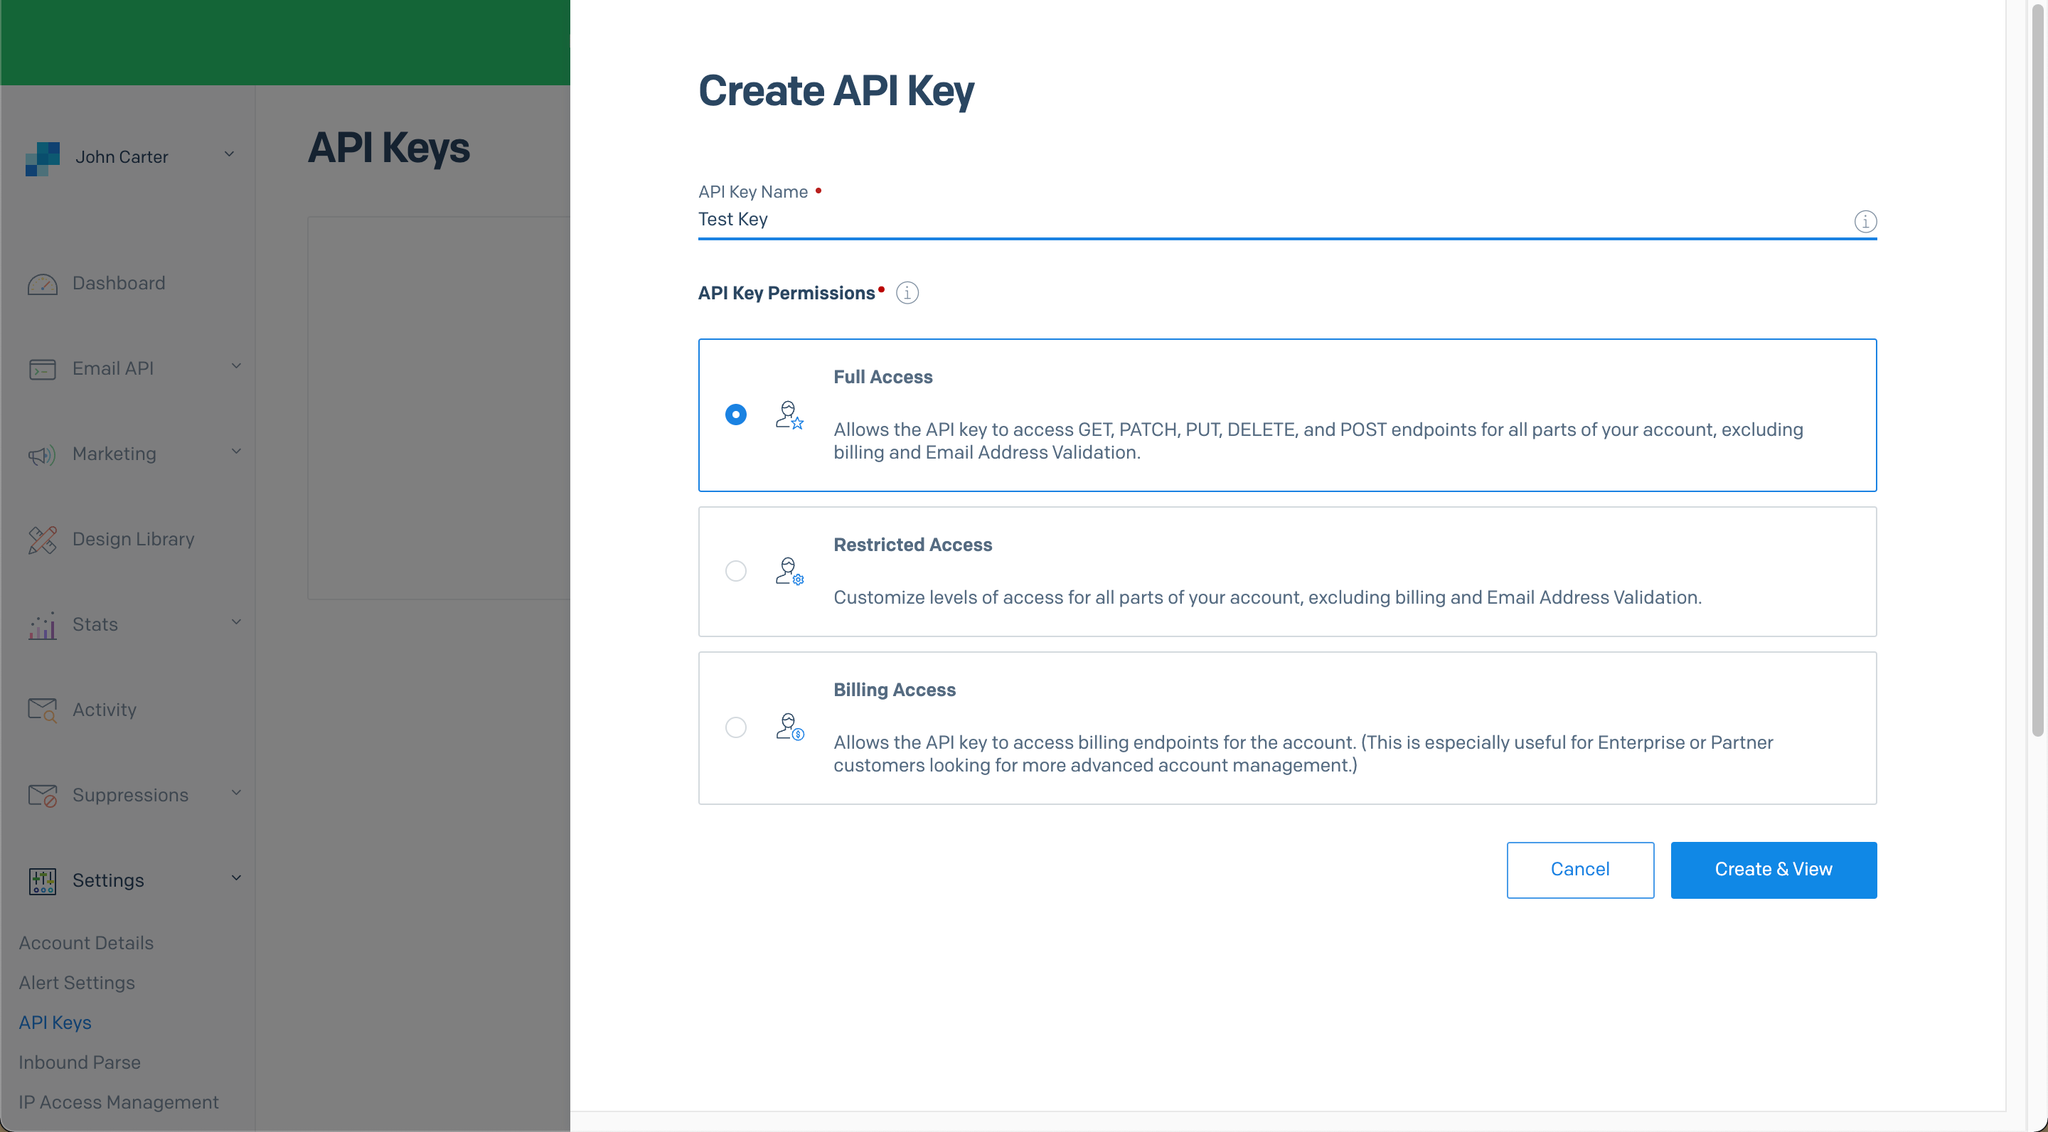
- Create your first API Key (Full Access):
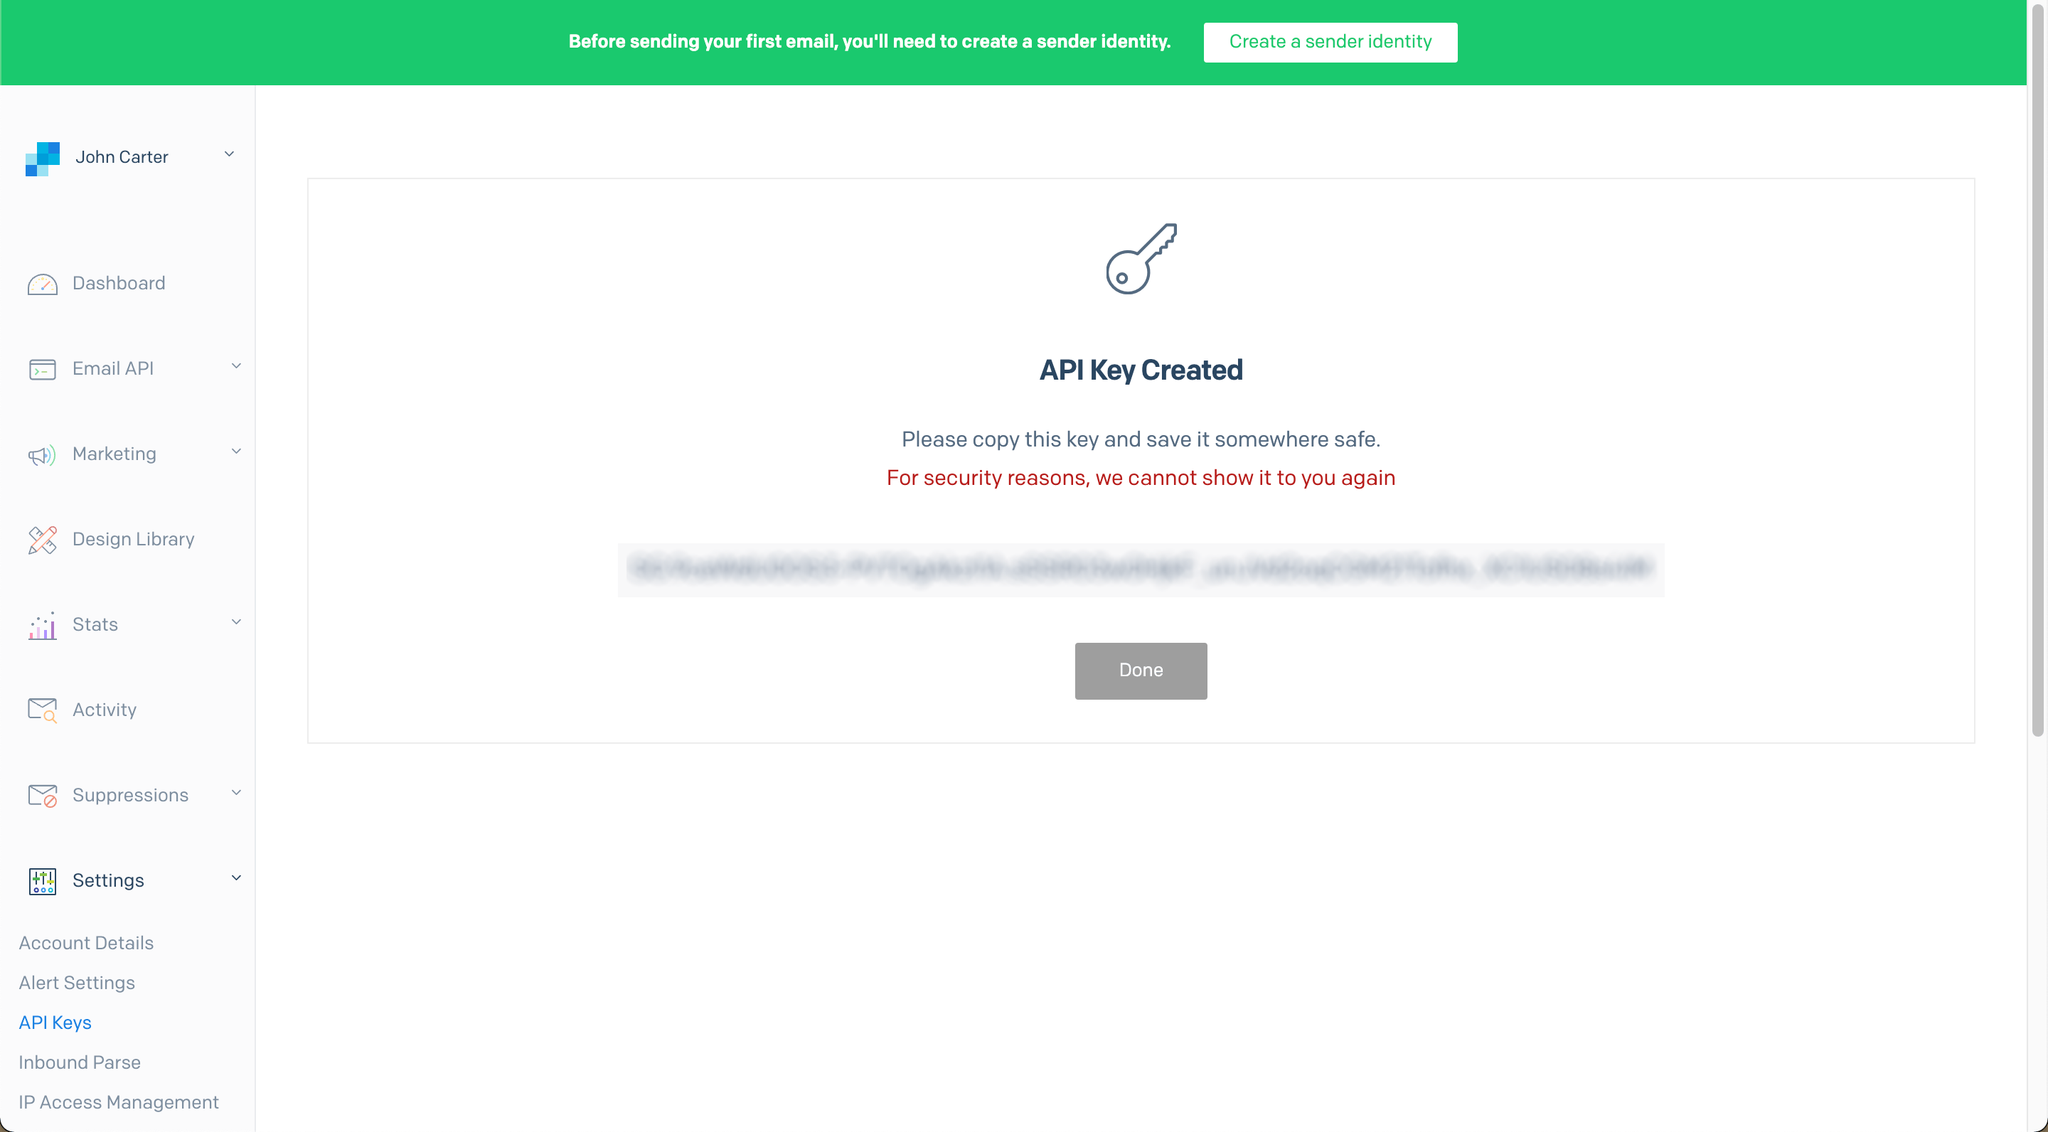
- Success! You know have your API key. SendGrid will not allow you to view the key again after this window is closed, so be sure to acquire a copy before closing.
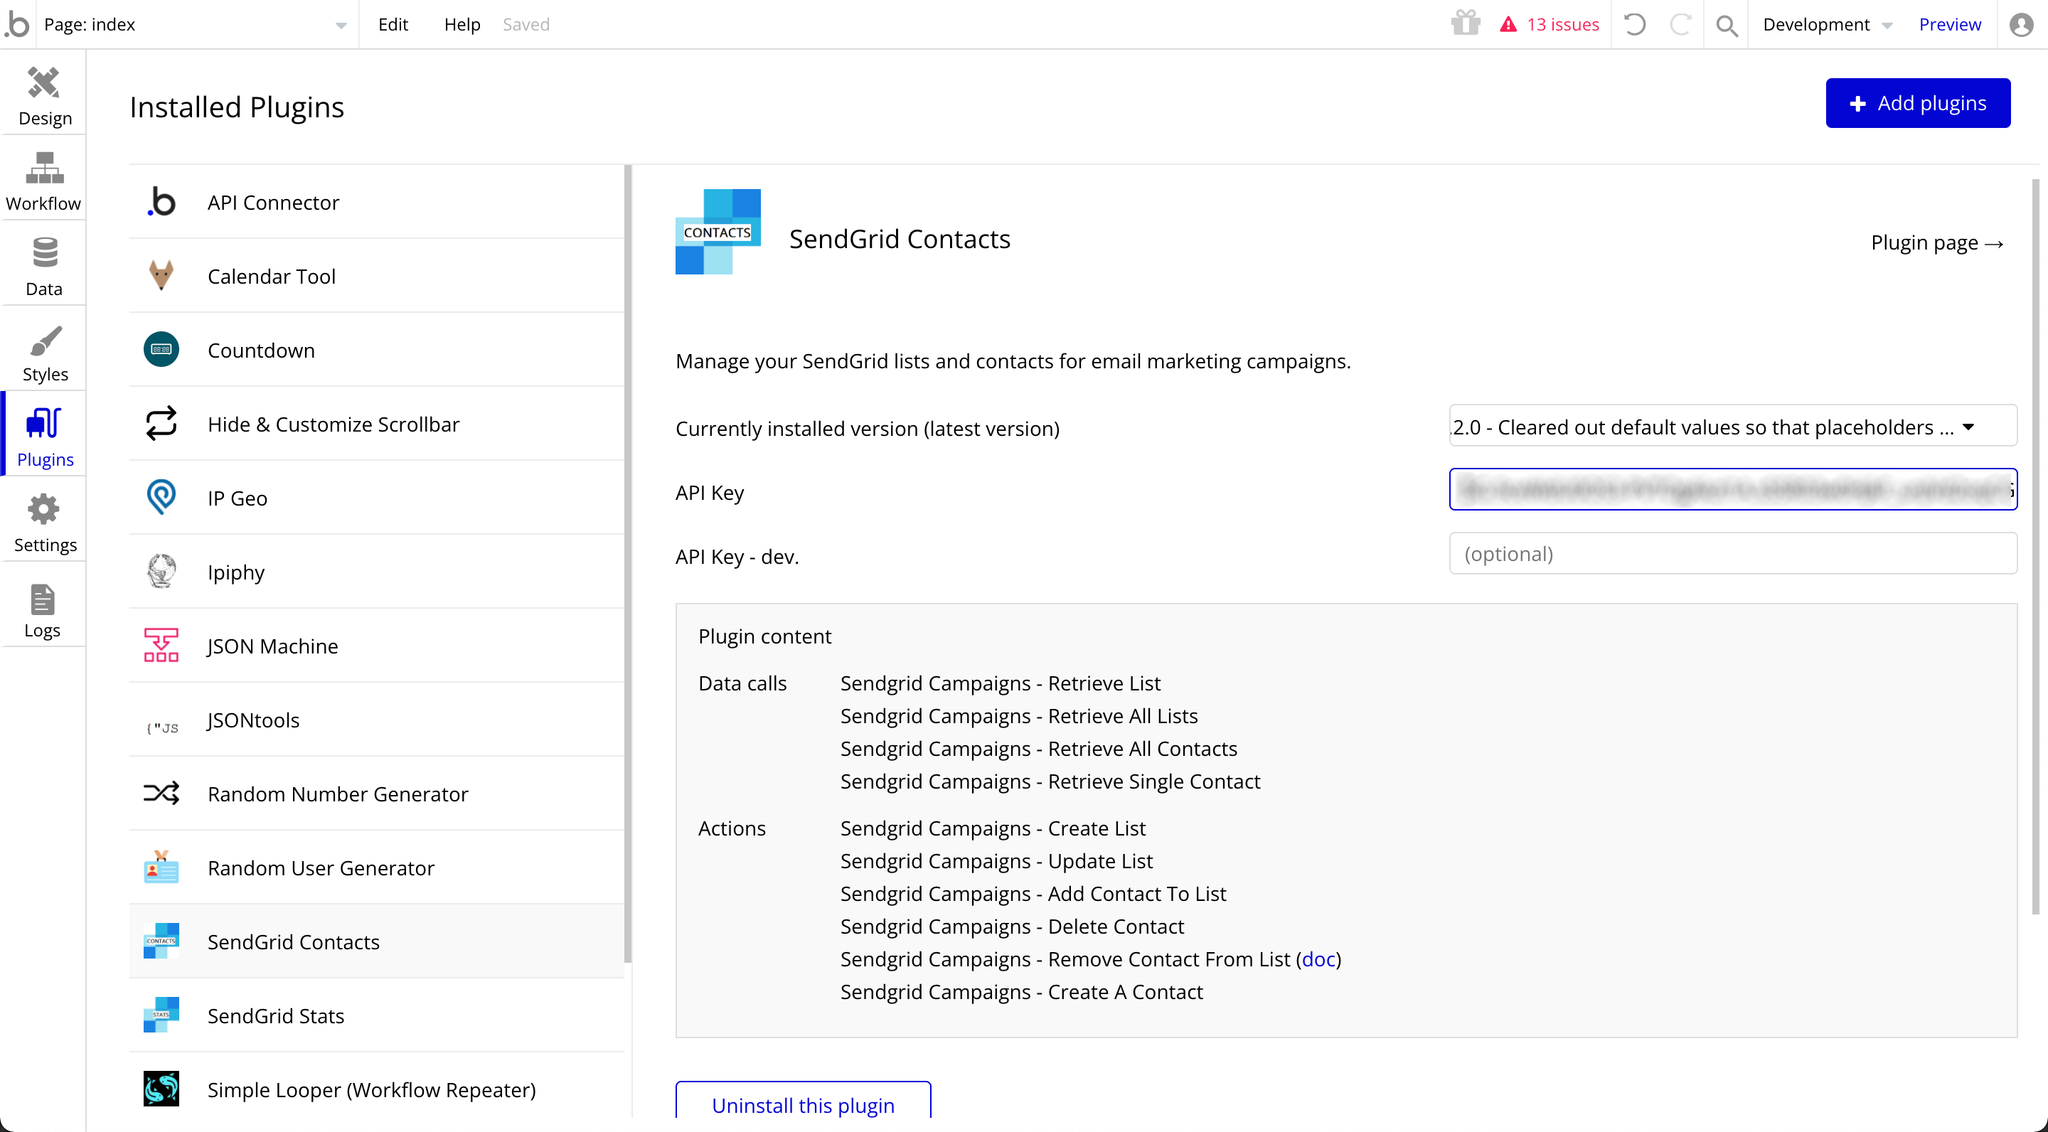
- Copy this new API Key and paste it into your Plugin Settings area (make sure you include "Bearer " with a space before the API key). It will look something like this: "Bearer YOUR-API-KEY”
(Note: This screenshot looks at the SendGrid Contacts plugin, however the inputs are identical for your API key)
That's it! Navigate to the next pages in this folder to view specific instructions for using each of the 7 calls available.
Video Overview
Retrieve Global Email Stats- Data Call
This endpoint allows you to retrieve all of your global email statistics between a given date range.
🔗
SendGrid documentation: https://docs.sendgrid.com/api-reference/stats/retrieve-global-email-statistics
Set up your data source
In this example, we'll use a repeating group to display our data:
- Type of content = Global (Sendgrid Stats)
- Data source = Get data from an external API > Sendgrid Stats - Global
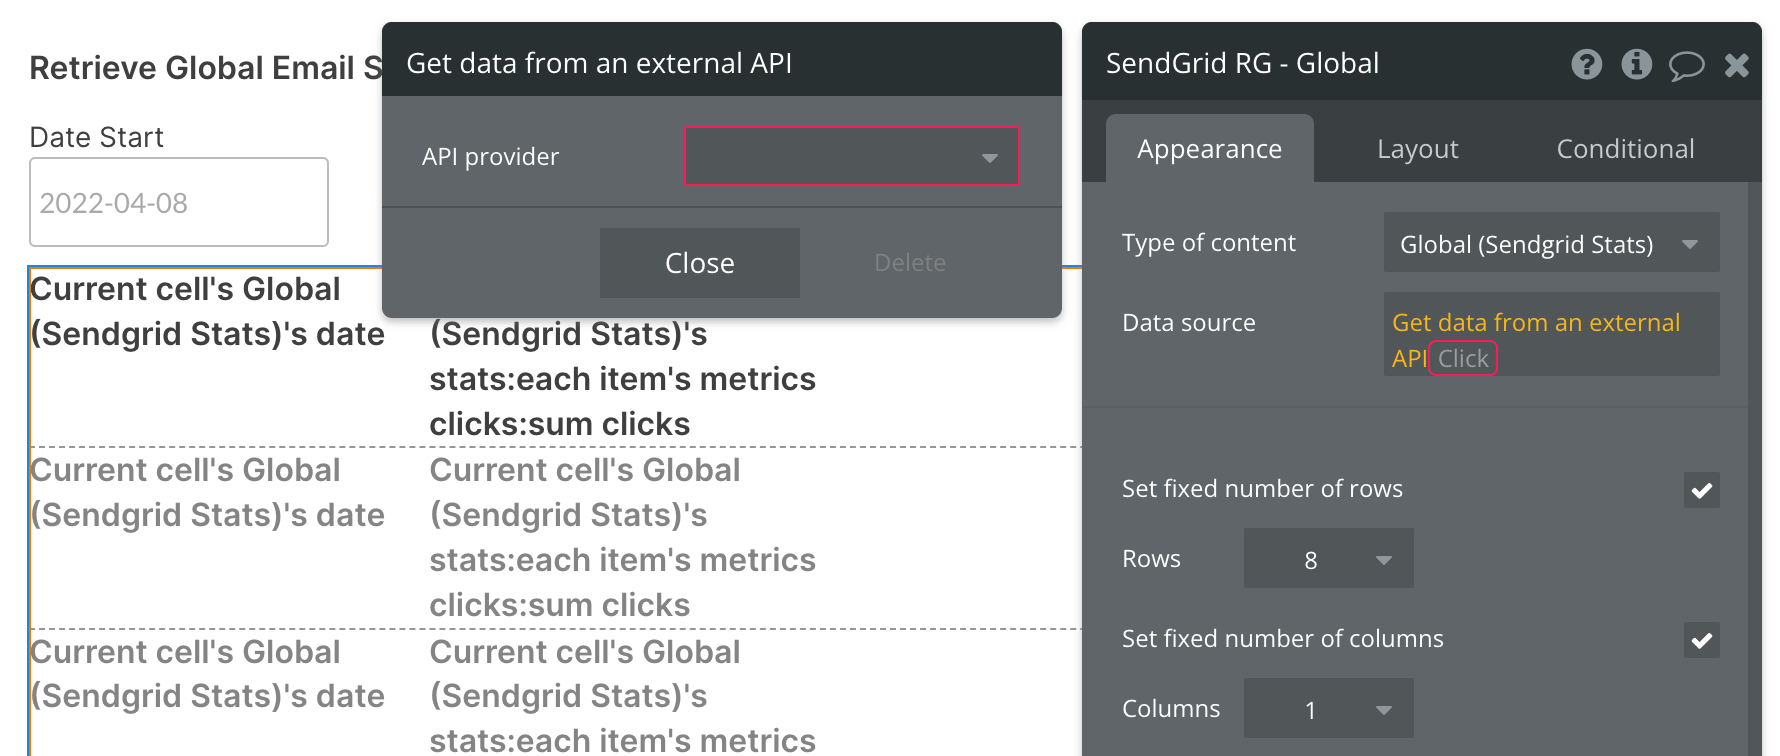
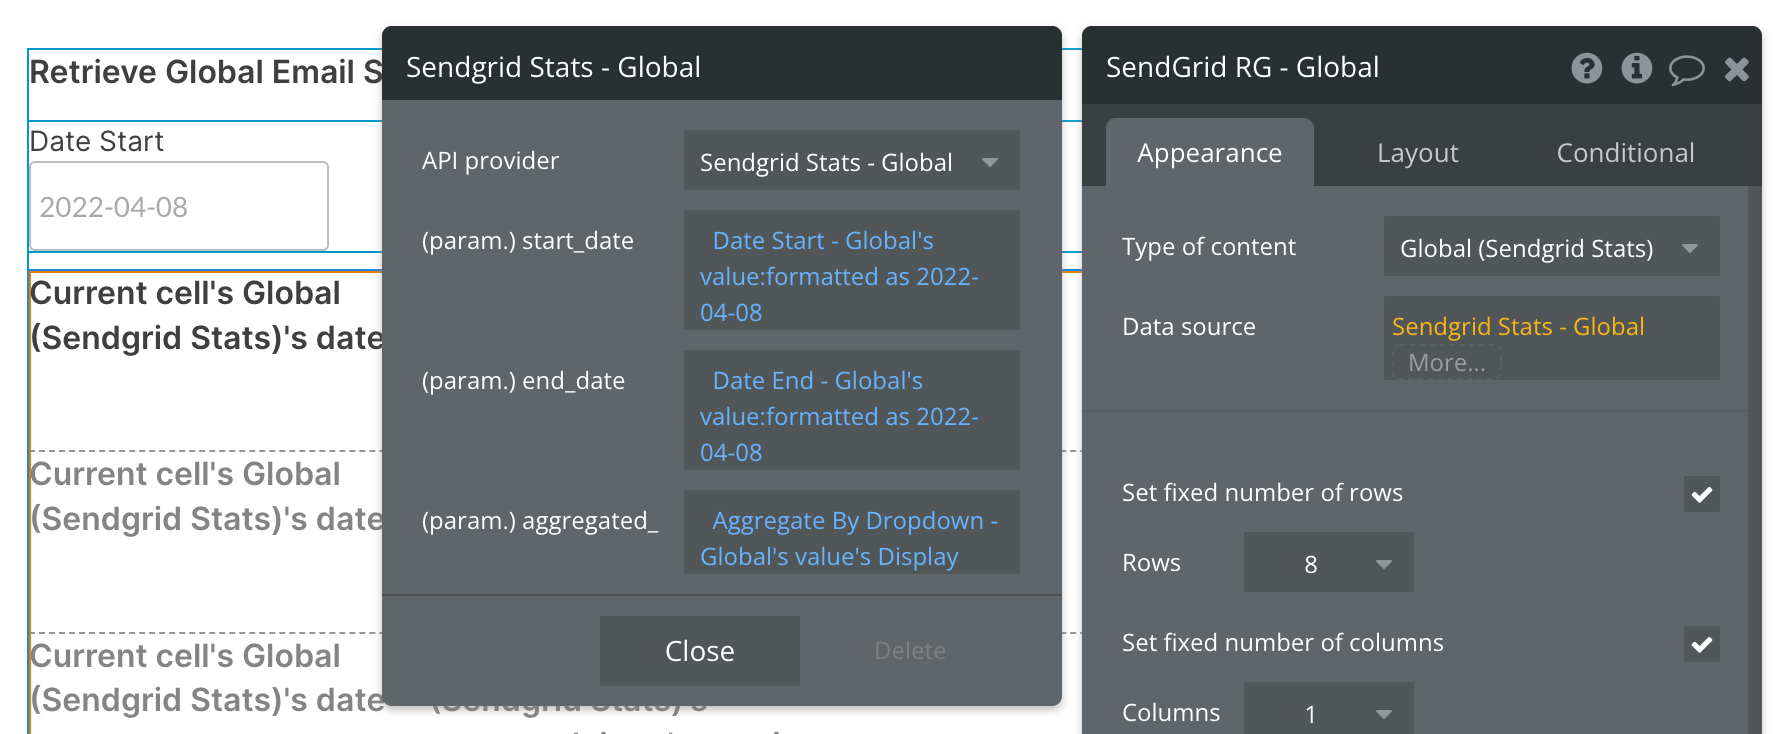
By default, you'll see a static start_date and aggregated values. You can continue using static values, or replace them with dynamic data sources, like in the above example.
Here we are using two date/time pickers to dynamically select our date range.
The Aggregate By Dropdown is pulling from an option set with three text values: day, week, month. You can use any method for selecting these options, provided they are type text and are lowercase.
Previewing your data
Before you configure the contents of the repeating group, it's important to understand the format of the response sent from SendGrid. Below is a screenshot taken from SendGrid documentation highlighting the structure of the data being returned.
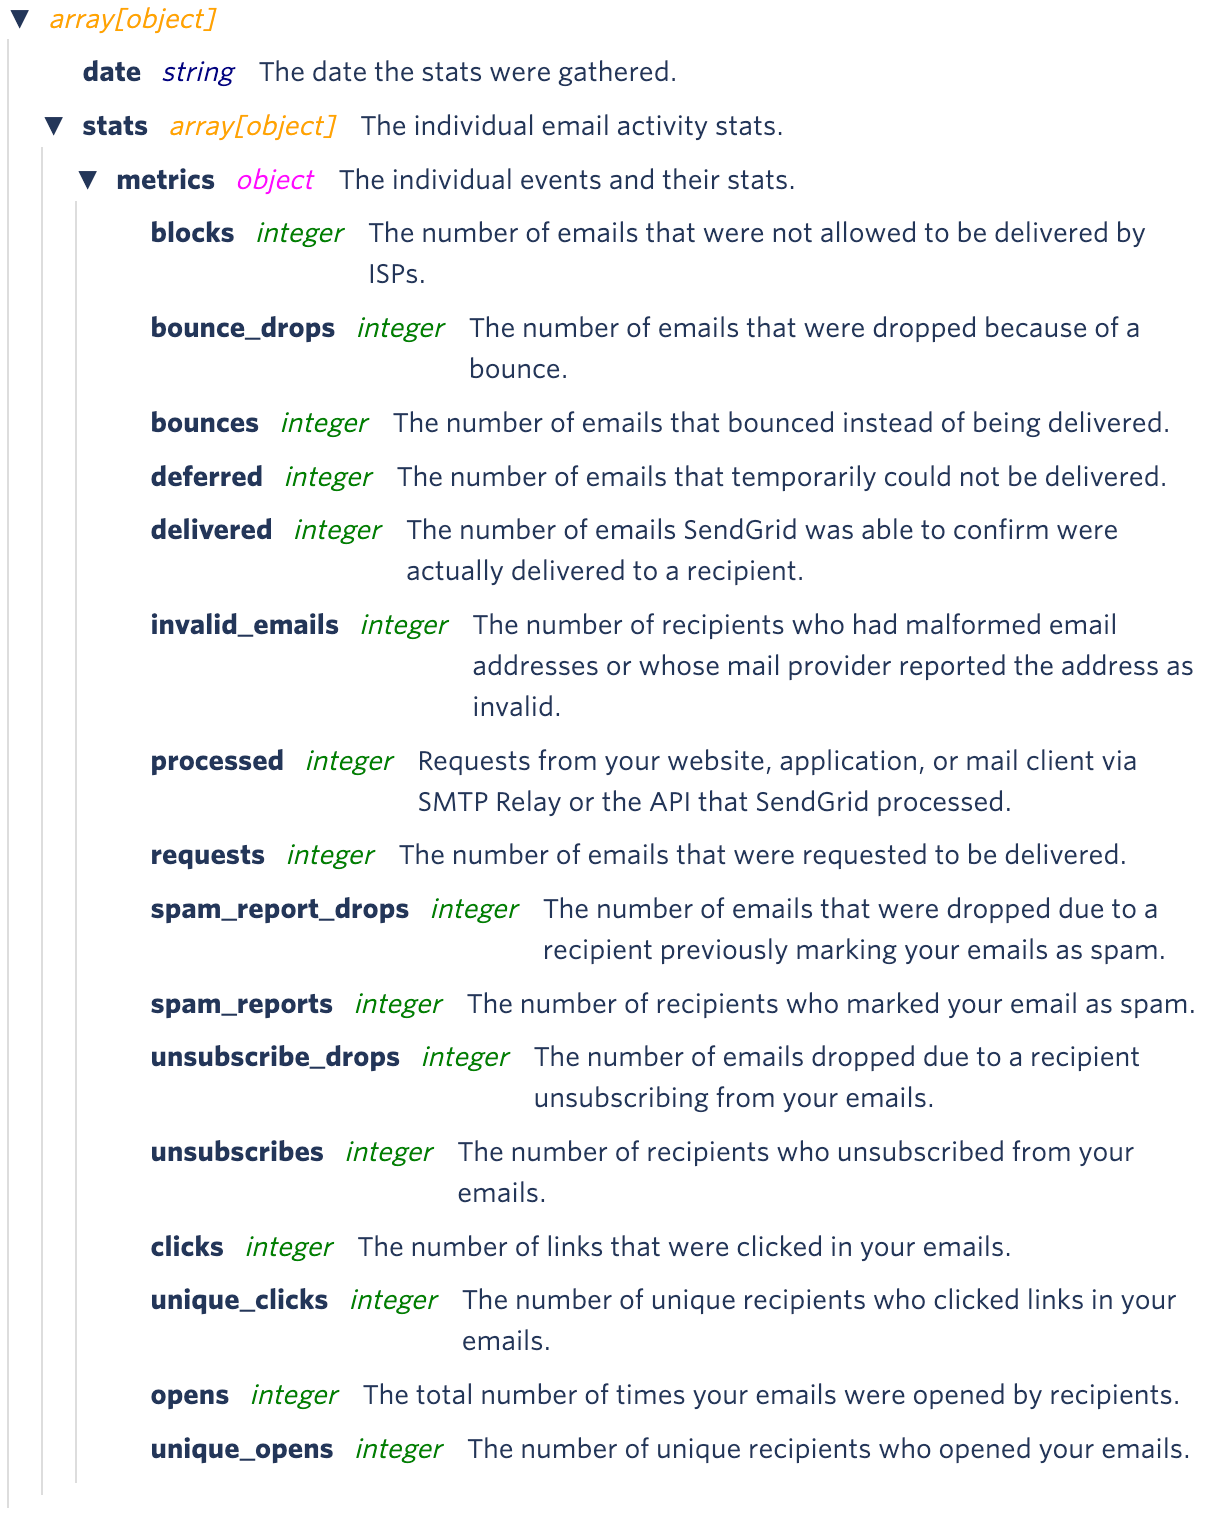
After reviewing the structure above, note that the repeating group being used in our example will show one aggregation by date per cell. You can think of 1 repeating group cell equating to one date period, with each period containing "Stat's Metrics" from the above breakdown.
If 4 weeks of data are requested (meaning "week" is selected as the aggregation and a date range of Jan 1st - Jan 24th is selected), 4 rows (date periods) will appear in this repeating group.
If 2 months of data are requested (meaning "month" is selected as the aggregation and a date range of Jan 1st - Feb 28th is selected), 2 rows (date periods) will appear.
Inside each repeating group cell, you have access to all data points listed above, starting with the cell's date and stat, then that stat's metrics. When selecting this expression in the repeating group cell, it will look like this:
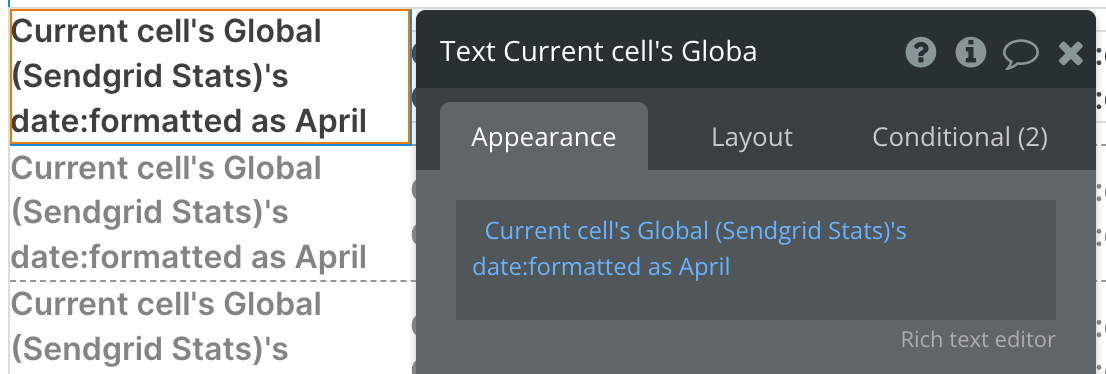
Let's take a look at the individual metrics next. We're now using the expression Current cell's Global (Sendgrid Stats)'s stats:each item's metrics clicks to show the number of clicks on our emails for the cell's date period:
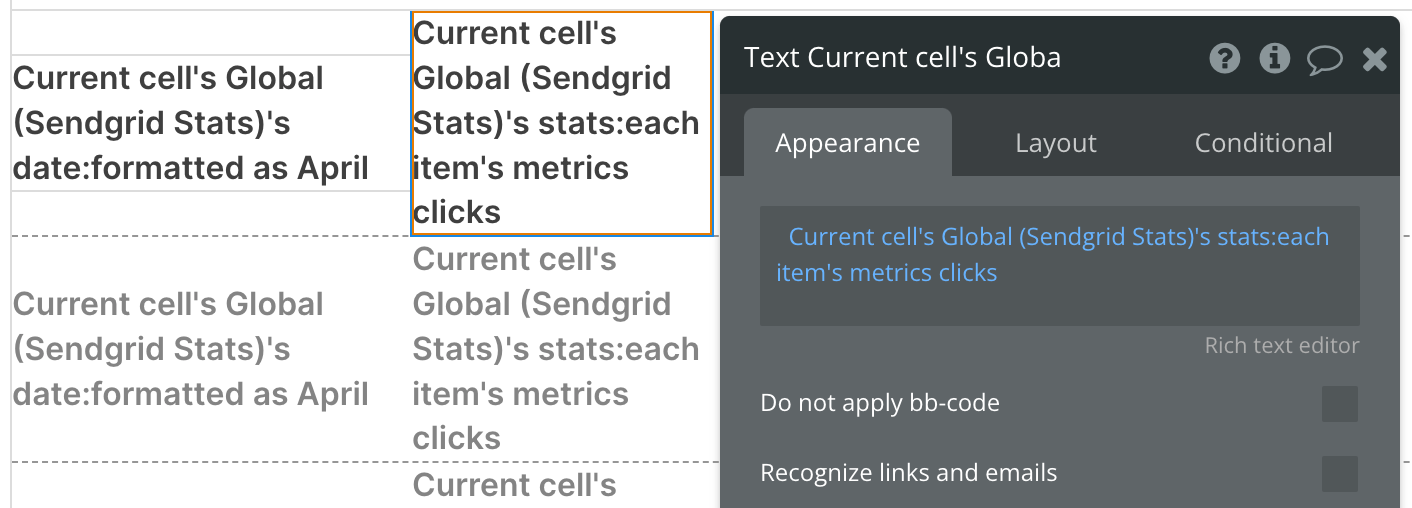
The same can be done for any other metrics listed in the documentation screenshot above.
Here's an example of our resulting data. We can see two rows in the repeating group (indicating "month" is selected as the aggregation and data from March and April is being requested) and a number following each month. In February there were 61 clicks and in March 129 clicks.

Available Parameters (* indicates a required value)
start_date - This parameter must follow the yyyy-mm-dd format. This is a required field and cannot be left blank. Be sure to format your parameter value is this way above, else you will receive an error.
end_date - This parameter must follow the yyyy-mm-dd format. This is not a required field and can be left blank. Be sure to format your parameter value is this way above, else you will receive an error.
aggregated_ - This parameter can contain any of the three text values: day, week, month. These values must be type text and lowercase.
By Country and State/Province - Data Call
This endpoint allows you to retrieve your email statistics segmented by country and state/province.
🔗
Set up your data source
In this example, we'll use a repeating group to display our data:
- Type of content = By Country and State/Province (SendGrid Stats)
- Data source = Get data from an external API > Sendgrid Stats - By Country and State/Province
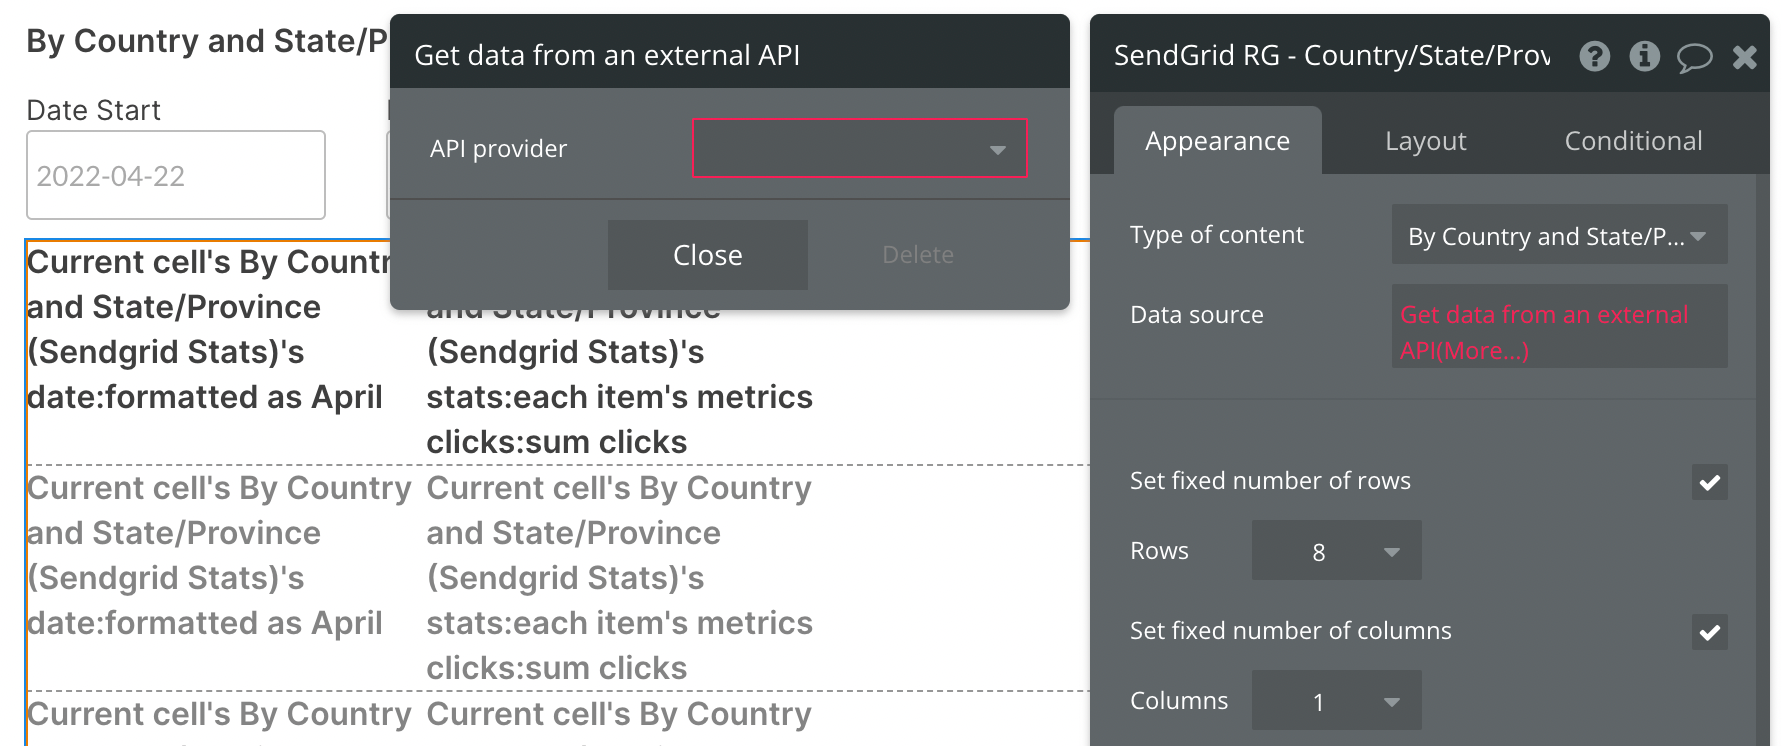
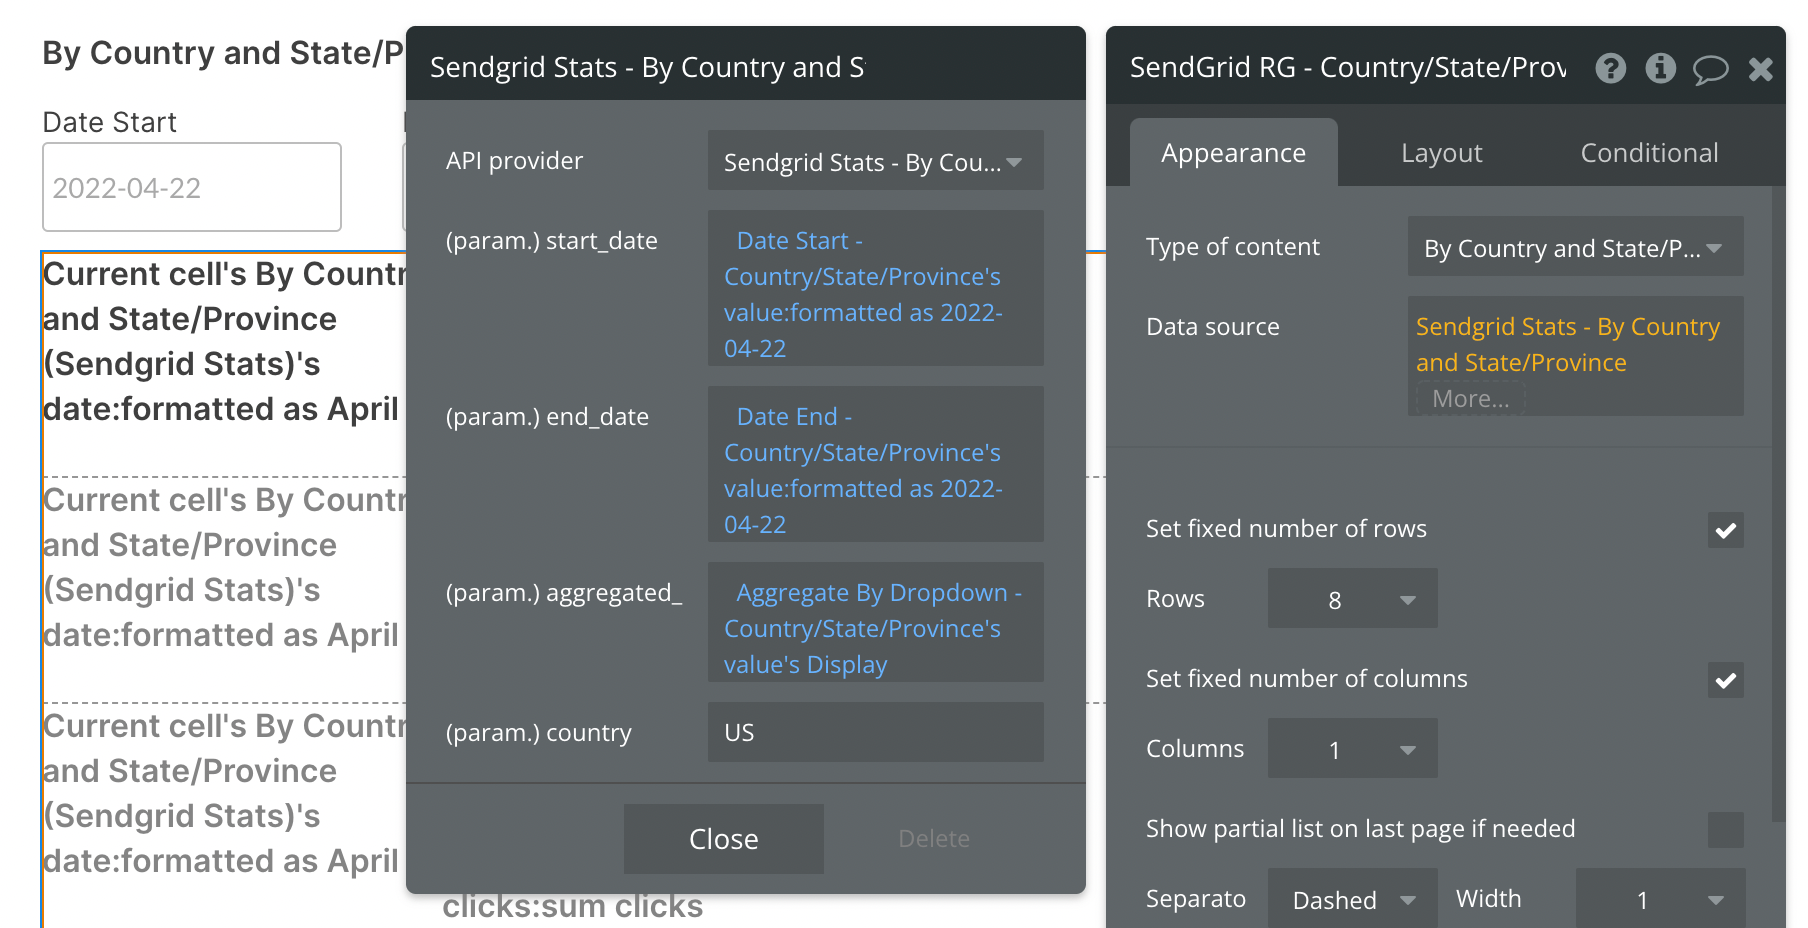
By default, you'll see a static start_date and aggregated values. You can continue using static values, or replace them with dynamic data sources, like in the above example.
Here we are using two date/time pickers to dynamically select our date range.
The Aggregate By Dropdown is pulling from an option set with three text values: day, week, month. You can use any method for selecting these options, provided they are type text and are lowercase.
The (param.) country option will default to US, and currently only US and CA are accepted values for this API call.
Previewing your data
Before you configure the contents of the repeating group, it's important to understand the format of the response sent from SendGrid. Below is a screenshot taken from SendGrid documentation highlighting the structure of the data being returned.
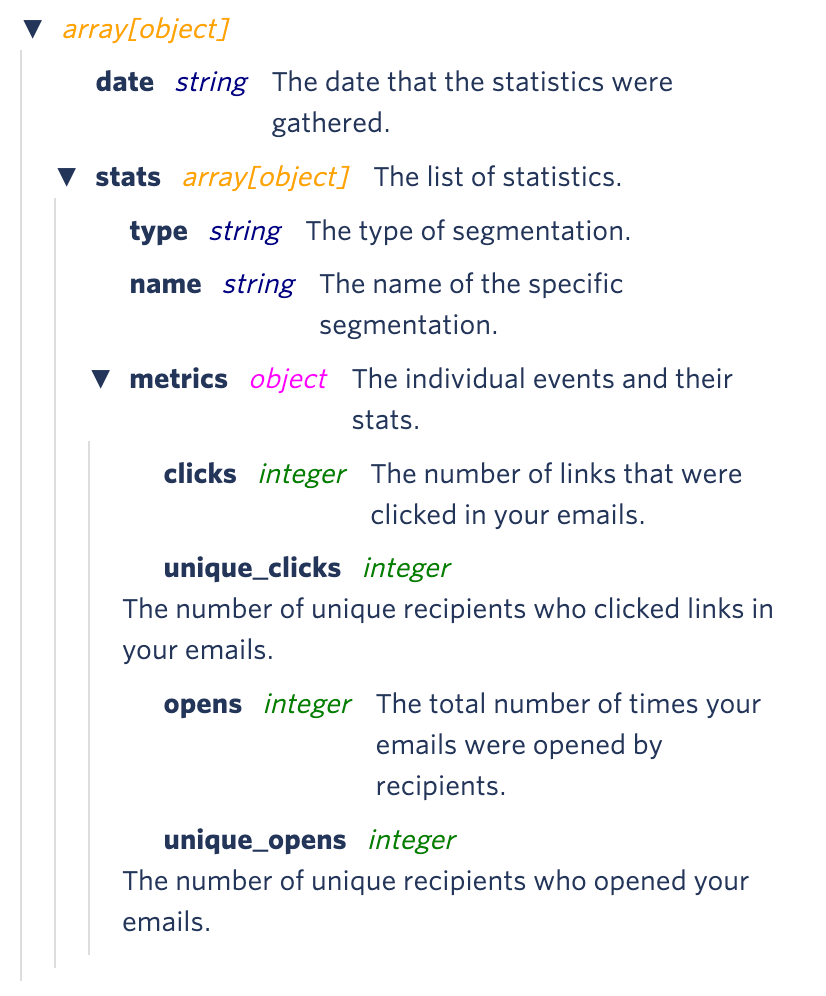
After reviewing the structure above, note that the repeating group being used in our example will show one aggregation by date per cell. You can think of 1 repeating group cell equating to one date period, with each period containing "Stat's Metrics" from the above breakdown.
If 4 weeks of data are requested (meaning "week" is selected as the aggregation and a date range of Jan 1st - Jan 24th is selected), 4 rows (date periods) will appear in this repeating group.
If 2 months of data are requested (meaning "month" is selected as the aggregation and a date range of Jan 1st - Feb 28th is selected), 2 rows (date periods) will appear.
Inside each repeating group cell, you have access to all data points listed above, starting with the cell's date and stat, then that stat's metrics.
Since this data call allows you to preview data grouped by country, each stat is equivalent to a Country.
Let's start by reviewing the top level of the data we're previewing:
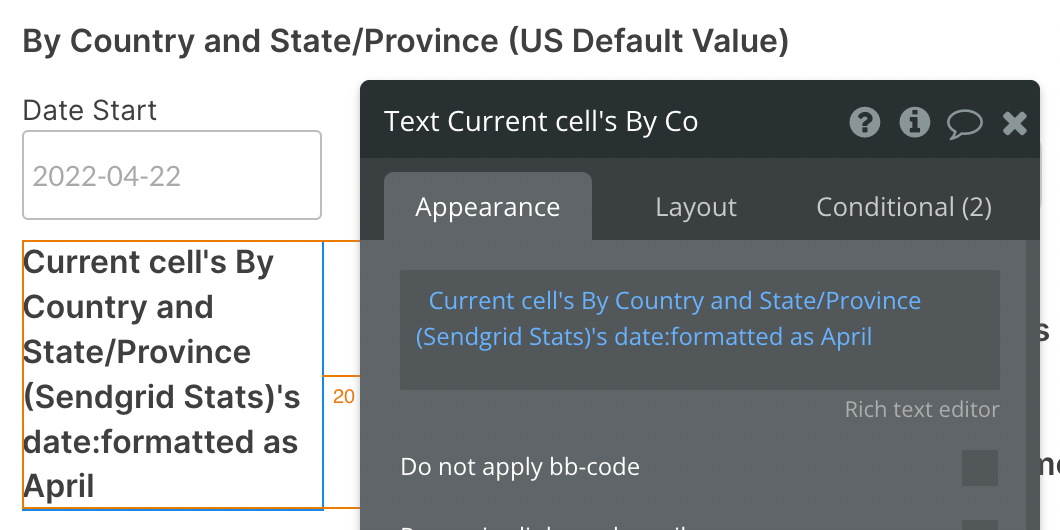
Each repeating group cell will display a date period. By default, we'll see data grouped together by month, so this first text block gives us a month.
Add a nested repeating group
We'll add another repeating group inside the first repeating group's cell to view the date period's list of countries with stats. This nested repeating group will have a different type of content and data source:
- Type of content = By Country and State/Province stat (Sendgrid Stat)
- Data source = Current cell's By Country and Sate/Province (Sendgrid Stat)'s stats
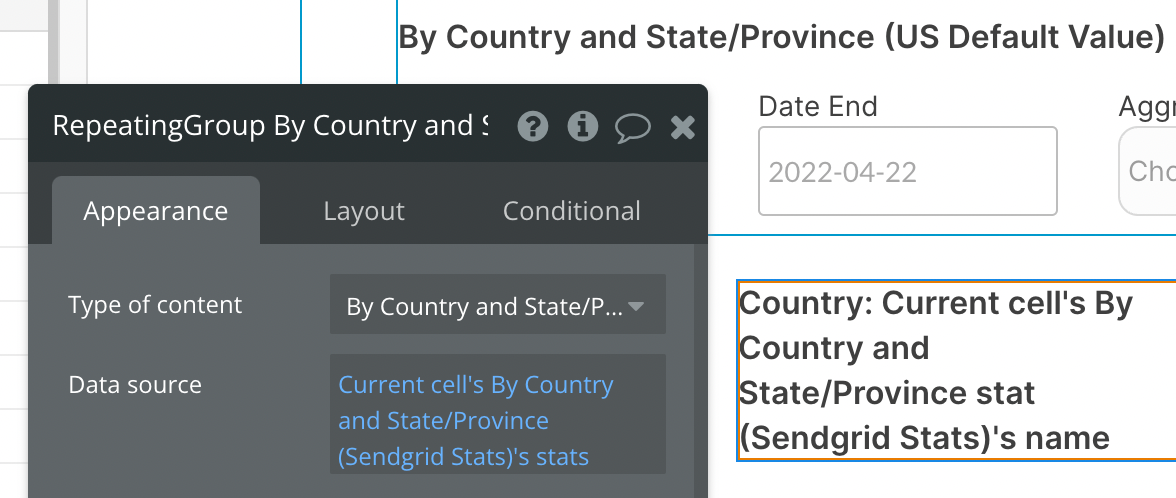
Now we're able to show the data unique to each country for the given date period. The first screenshot shows how we can display each Country name:
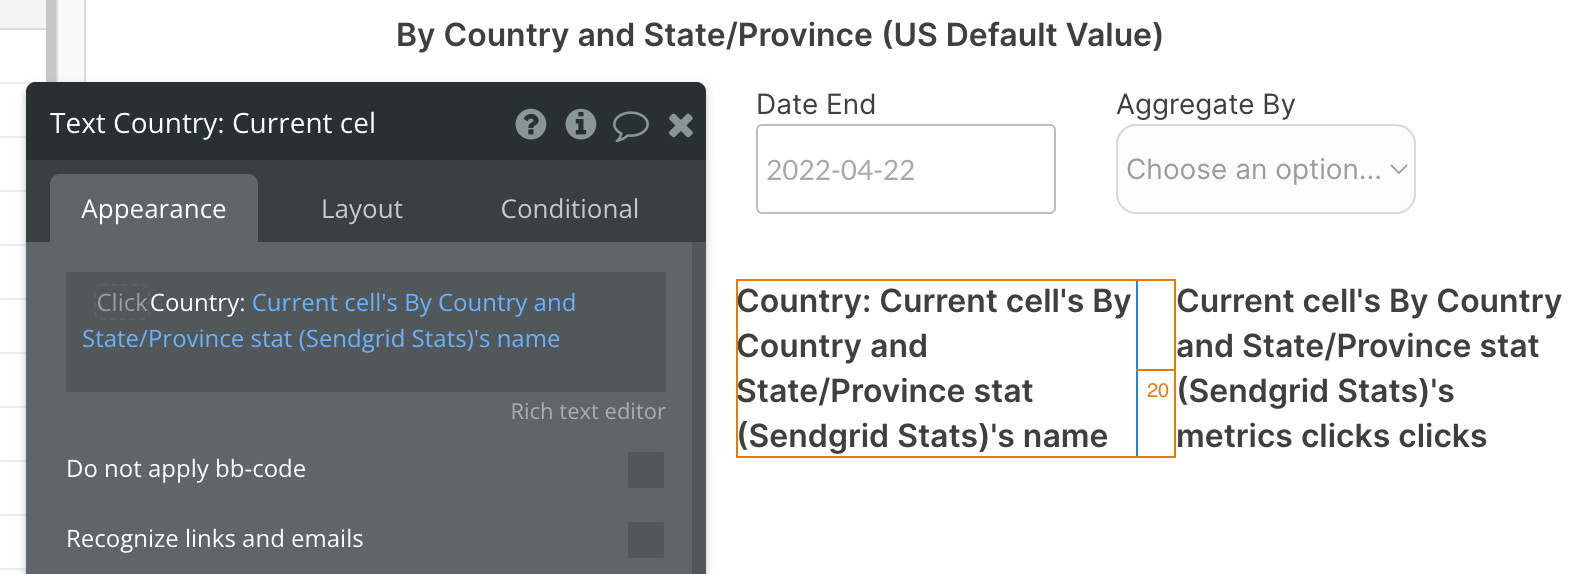
And the second screenshot shows how we can display the number of email clicks for each cell's Country:
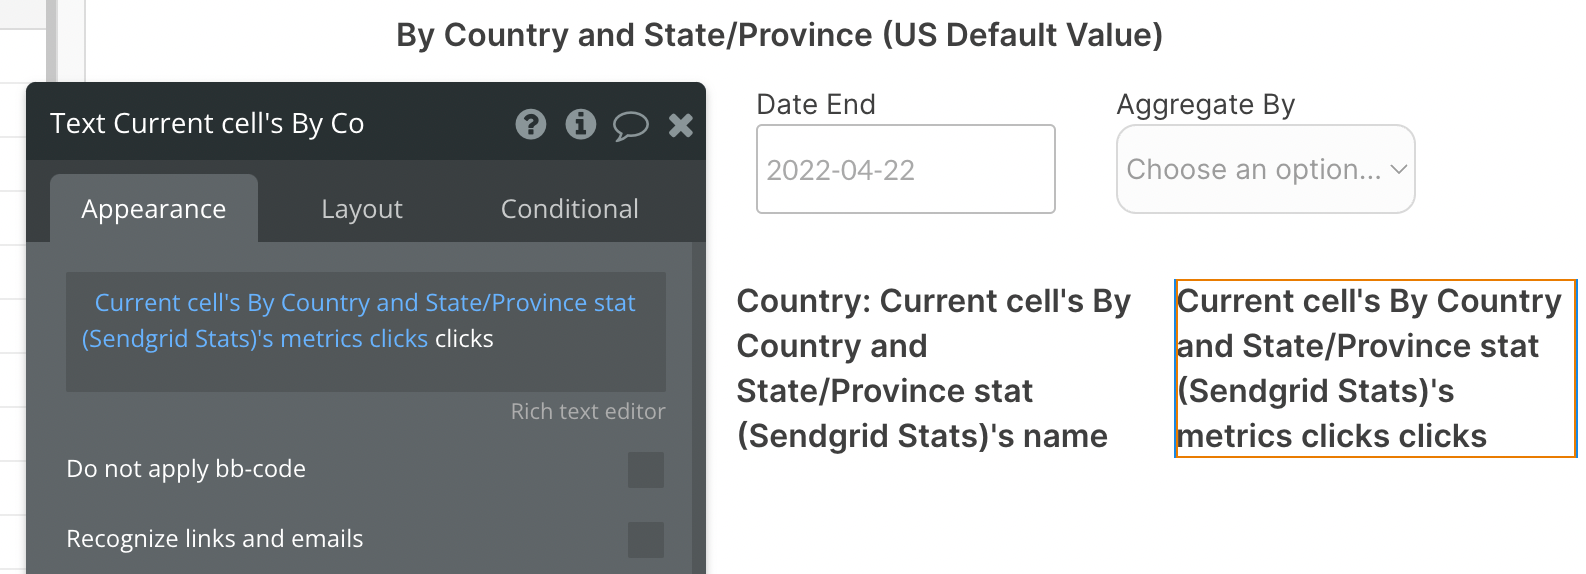
Let's look at a live example now:
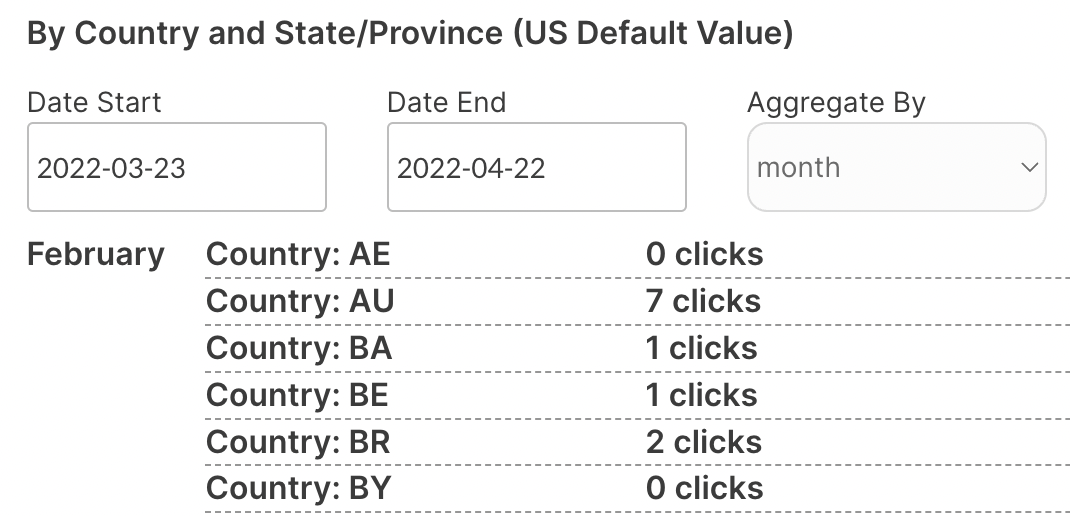
The first row displays data relevant to February (the first cell in our main repeating group), followed by a list of Countries and their number of email clicks for that month.
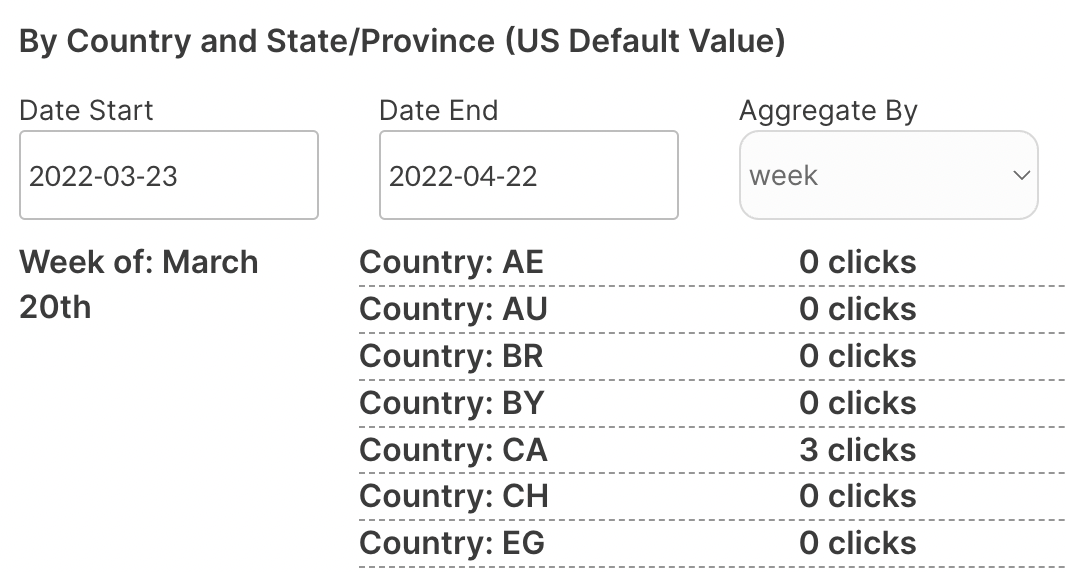
If we change the date period by selecting a new Aggregate By value, we'll see a different organization of data. In the example below, we're viewing data by week, so each cell in the primary repeating group will display one week's worth of data depending on the date range specified by the Date Start and Date End inputs.
Available Parameters (* indicates a required value)
start_date - This parameter must follow the yyyy-mm-dd format. This is a required field and cannot be left blank. Be sure to format your parameter value is this way above, else you will receive an error.
end_date - This parameter must follow the yyyy-mm-dd format. This is not a required field and can be left blank. Be sure to format your parameter value is this way above, else you will receive an error.
aggregated_ - This parameter can contain any of the three text values: day, week, month. These values must be type text and lowercase.
country - US and CA are the only accepted values for this API call.
By Device - Data Call
This endpoint allows you to retrieve your email statistics segmented by the device type.
🔗
SendGrid documentation: https://docs.sendgrid.com/api-reference/stats/retrieve-email-statistics-by-device-type
Set up your data source
In this example, we'll use a repeating group to display our data:
- Type of content = By Device (SendGrid Stats)
- Data source = Get data from an external API > Sendgrid Stats - By Device

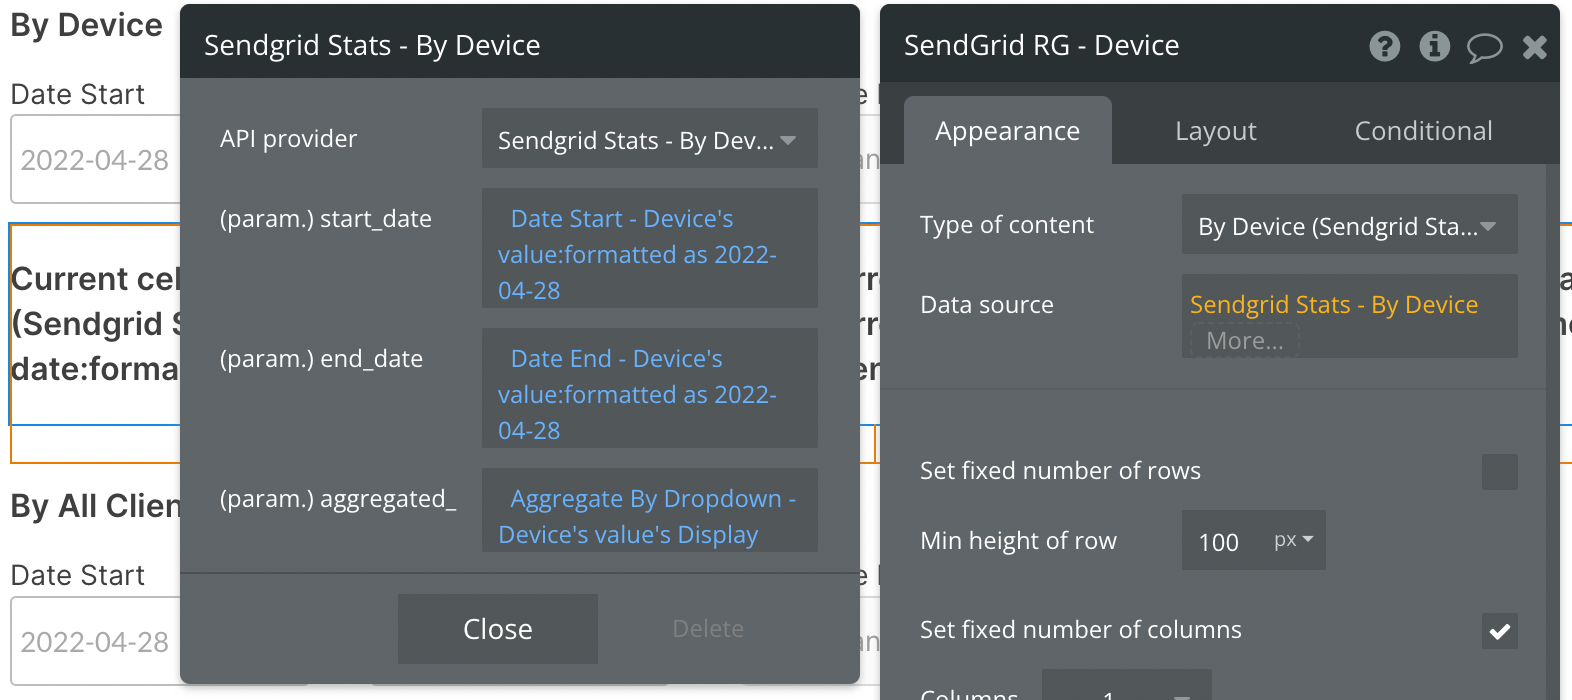
By default, you'll see a static start_date and aggregated values. You can continue using static values, or replace them with dynamic data sources, like in the above example.
Here we are using two date/time pickers to dynamically select our date range.
The Aggregate By Dropdown is pulling from an option set with three text values: day, week, month. You can use any method for selecting these options, provided they are type text and are lowercase.
Previewing your data
Before you configure the contents of the repeating group, it's important to understand the format of the response sent from SendGrid. Below is a screenshot taken from SendGrid documentation highlighting the structure of the data being returned.
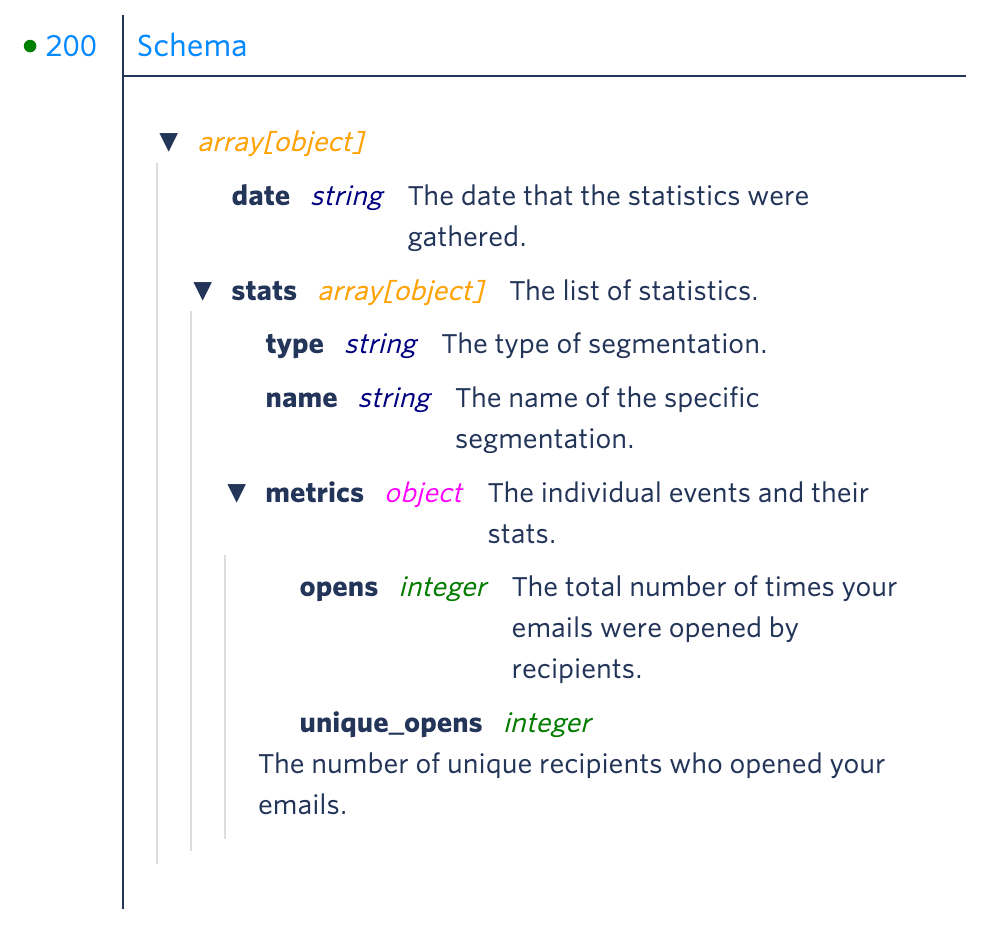
After reviewing the structure above, note that the repeating group being used in our example will show one aggregation by date per cell. You can think of 1 repeating group cell equating to one date period, with each period containing "Stat's Metrics" from the above breakdown.
If 4 weeks of data are requested (meaning "week" is selected as the aggregation and a date range of Jan 1st - Jan 24th is selected), 4 rows (date periods) will appear in this repeating group.
If 2 months of data are requested (meaning "month" is selected as the aggregation and a date range of Jan 1st - Feb 28th is selected), 2 rows (date periods) will appear.
Inside each repeating group cell, you'll want to add another repeating group to display metrics for each device type.
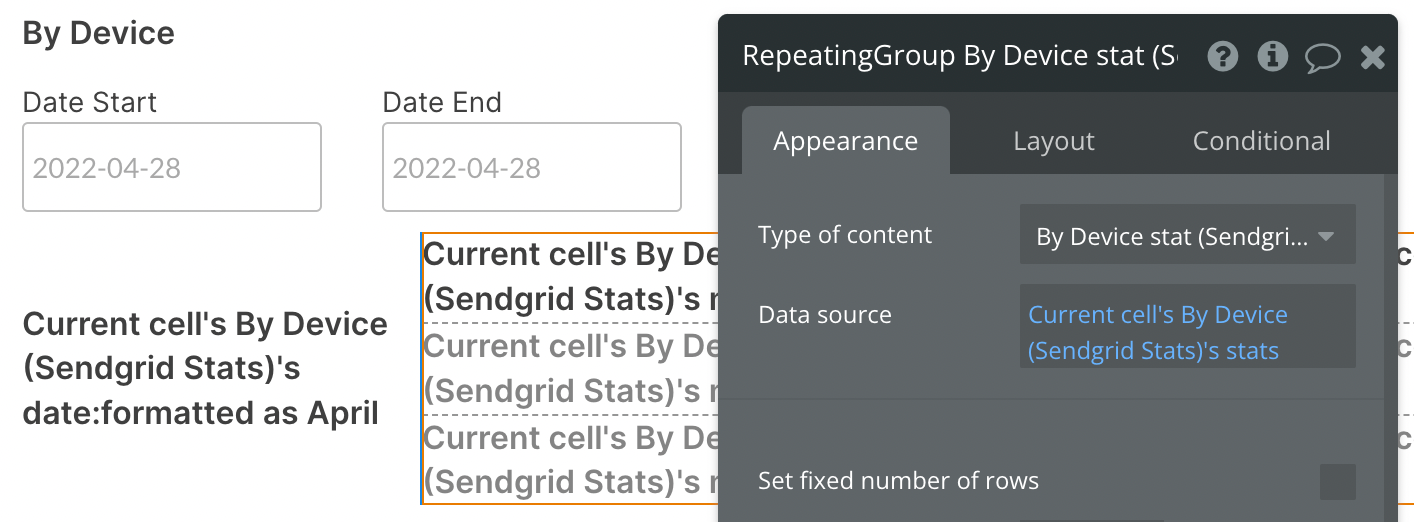
- Type of content = By Device stat (SendGrid Stats)
- Data source = Current cell's By Device (Sendgrid Stats)'s stats
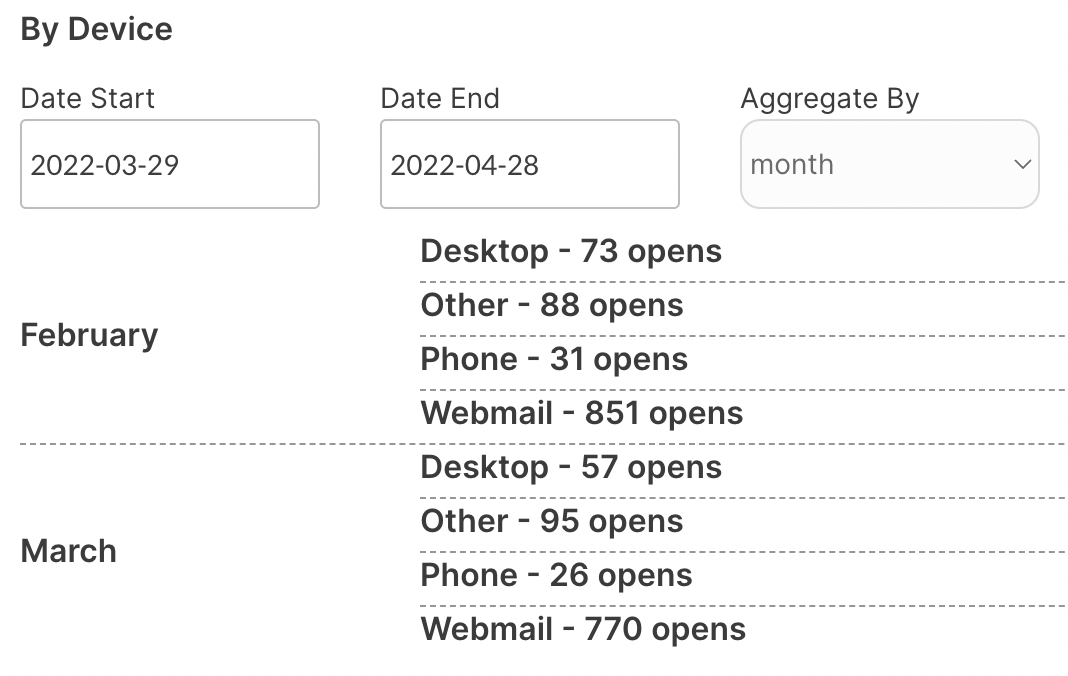
Now we can set up the text element to display each cell's device type, as well as metrics for each.

Let's look at a live example now:
Available Parameters (* indicates a required value)
start_date - This parameter must follow the yyyy-mm-dd format. This is a required field and cannot be left blank. Be sure to format your parameter value is this way above, else you will receive an error.
end_date - This parameter must follow the yyyy-mm-dd format. This is not a required field and can be left blank. Be sure to format your parameter value is this way above, else you will receive an error.
aggregated_ - This parameter can contain any of the three text values: day, week, month. These values must be type text and lowercase.
By All Clients - Data Call
This endpoint allows you to retrieve your email statistics segmented by client type.
🔗
SendGrid documentation: https://docs.sendgrid.com/api-reference/stats/retrieve-email-statistics-by-client-type
Set up your data source
In this example, we'll use a repeating group to display our data:
- Type of content = By All Clients (SendGrid Stats)
- Data source = Get data from an external API > Sendgrid Stats - By All Clients

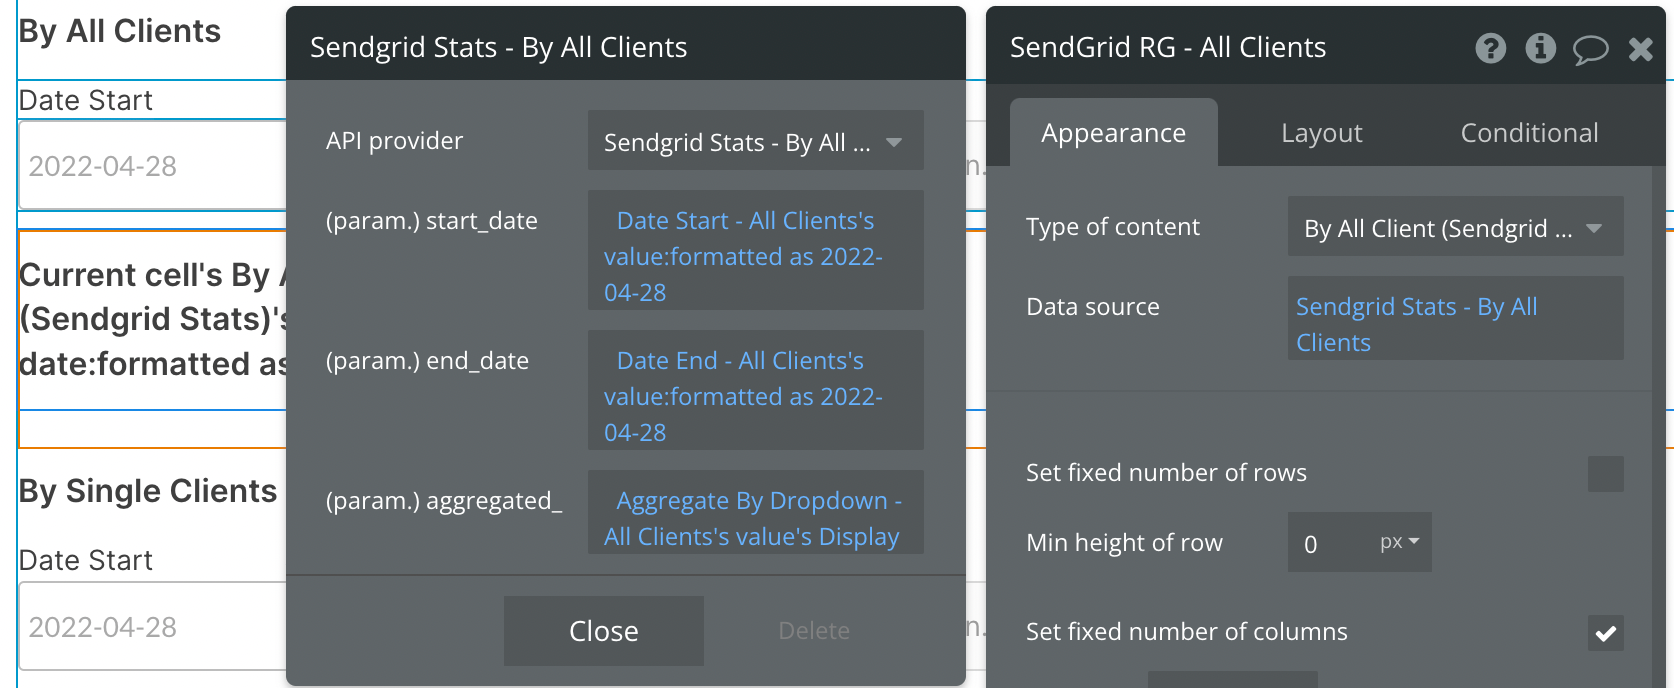
By default, you'll see a static start_date and aggregated values. You can continue using static values, or replace them with dynamic data sources, like in the above example.
Here we are using two date/time pickers to dynamically select our date range.
The Aggregate By Dropdown is pulling from an option set with three text values: day, week, month. You can use any method for selecting these options, provided they are type text and are lowercase.
Previewing your data
Before you configure the contents of the repeating group, it's important to understand the format of the response sent from SendGrid. Below is a screenshot taken from SendGrid documentation highlighting the structure of the data being returned.
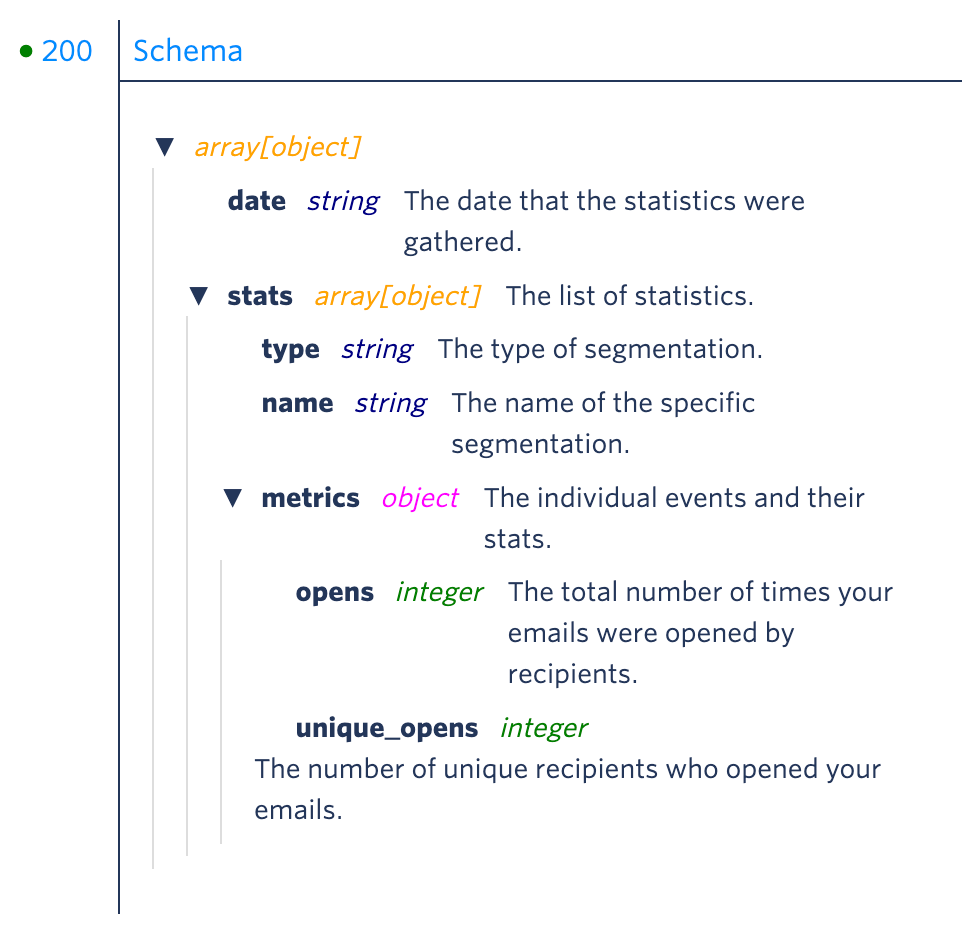
After reviewing the structure above, note that the repeating group being used in our example will show one aggregation by date per cell. You can think of 1 repeating group cell equating to one date period, with each period containing "Stat's Metrics" from the above breakdown.
If 4 weeks of data are requested (meaning "week" is selected as the aggregation and a date range of Jan 1st - Jan 24th is selected), 4 rows (date periods) will appear in this repeating group.
If 2 months of data are requested (meaning "month" is selected as the aggregation and a date range of Jan 1st - Feb 28th is selected), 2 rows (date periods) will appear.
Inside each repeating group cell, you have access to all data points listed above, starting with the cell's date and stat, then that stat's metrics. When selecting this expression in the repeating group cell, it will look like this:
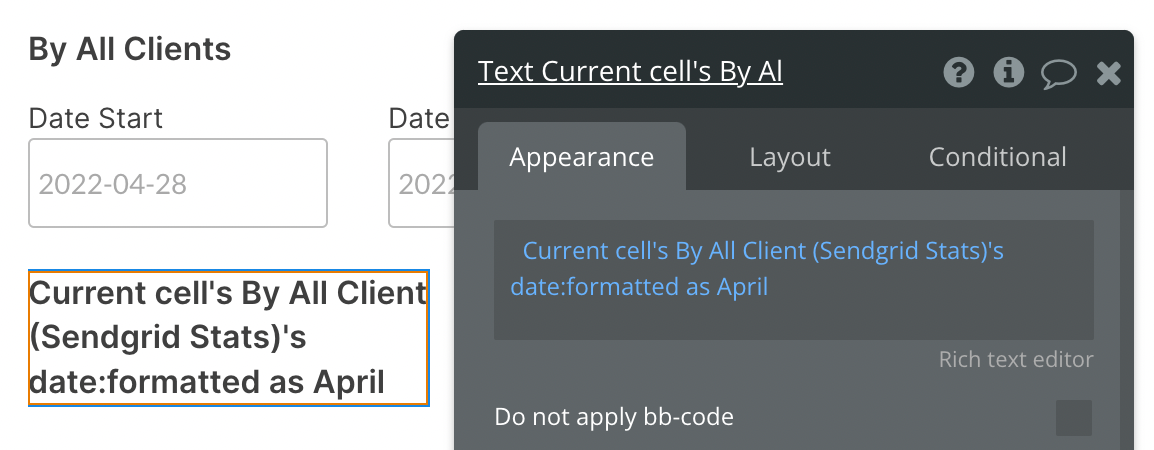
Let's take a look at the individual metrics next. We're now using the expression Current cell's By All Client (Sendgrid Stats)'s stats:each item's metrics opens:sum to show the number of opens on our emails for the cell's date period:

The same can be done for any other metrics listed in the documentation screenshot above.
Here's an example of our resulting data. We can see two rows in the repeating group (indicating "month" is selected as the aggregation and data from March and April is being requested) and a number following each month. In February there were 1043 clicks and in March 949 clicks.

Available Parameters (* indicates a required value)
start_date - This parameter must follow the yyyy-mm-dd format. This is a required field and cannot be left blank. Be sure to format your parameter value is this way above, else you will receive an error.
end_date - This parameter must follow the yyyy-mm-dd format. This is not a required field and can be left blank. Be sure to format your parameter value is this way above, else you will receive an error.
aggregated_ - This parameter can contain any of the three text values: day, week, month. These values must be type text and lowercase.
By Single Client - Data Call
This endpoint allows you to retrieve your email statistics segmented by a specific client type.
🔗
SendGrid documentation: https://docs.sendgrid.com/api-reference/stats/retrieve-stats-by-a-specific-client-type
Set up your data source
In this example, we'll use a repeating group to display our data:
- Type of content = By Single Client (SendGrid Stats)
- Data source = Get data from an external API > Sendgrid Stats - By Single Client

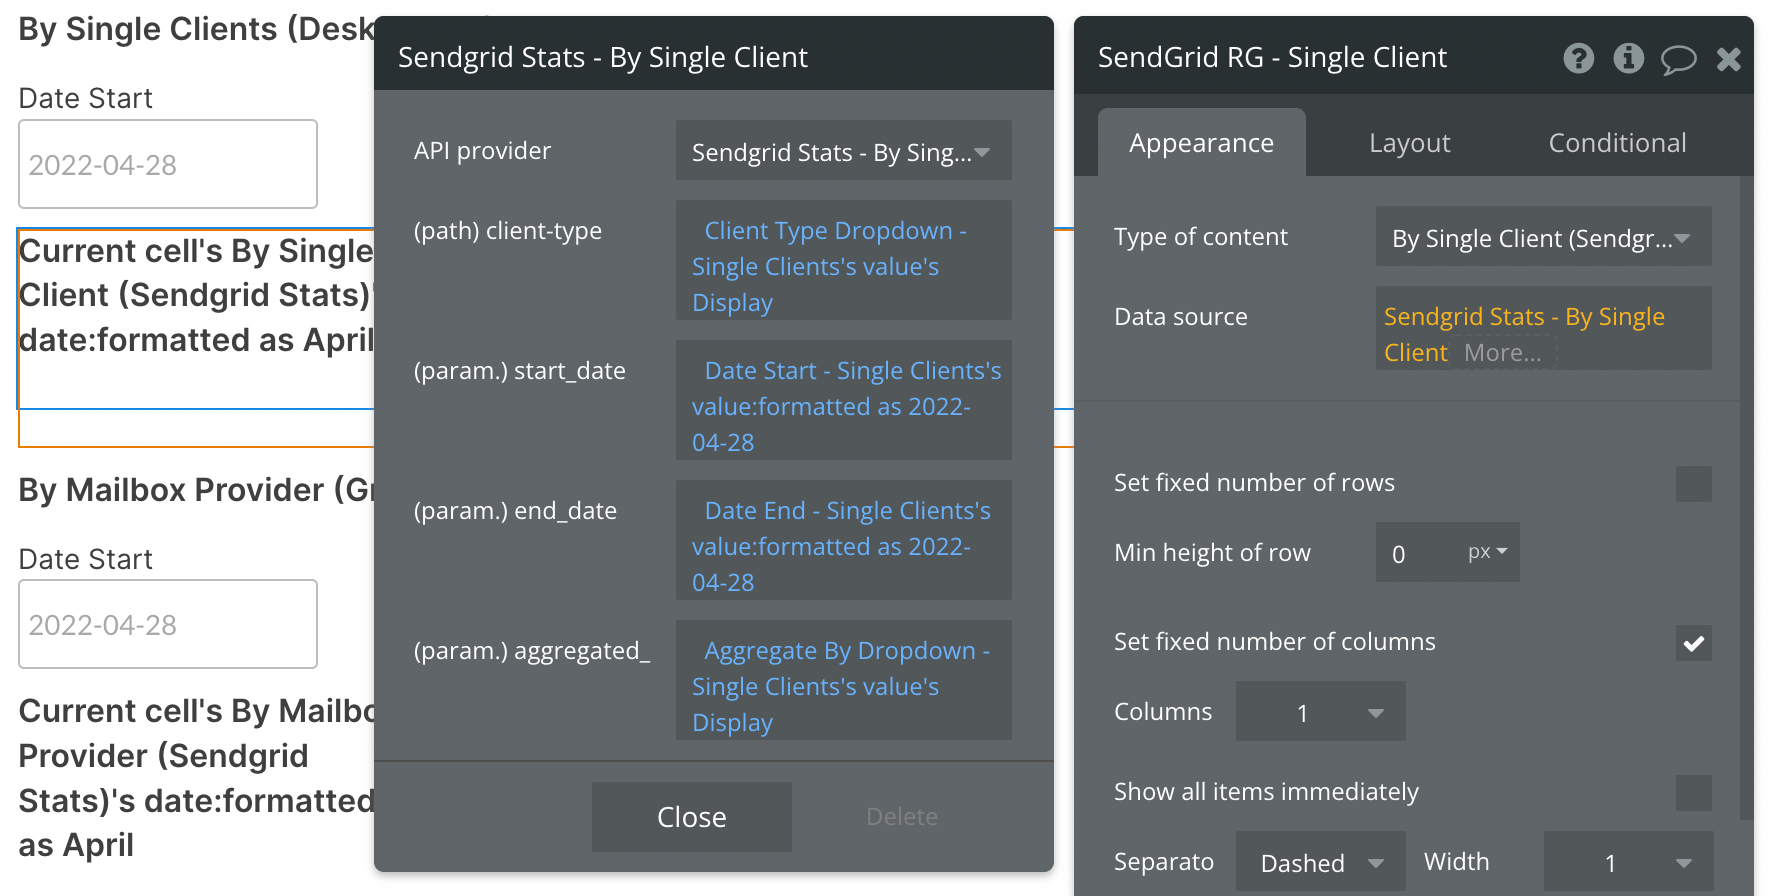
This data call provides the option to filter by client. In this example, we've prepared a dropdown with all of the available client options (phone, tablet, webmail, desktop).
By default, you'll see a static start_date and aggregated values. You can continue using static values, or replace them with dynamic data sources, like in the above example.
Here we are using two date/time pickers to dynamically select our date range.
The Aggregate By Dropdown is pulling from an option set with three text values: day, week, month. You can use any method for selecting these options, provided they are type text and are lowercase.
Previewing your data
Before you configure the contents of the repeating group, it's important to understand the format of the response sent from SendGrid. Below is a screenshot taken from SendGrid documentation highlighting the structure of the data being returned.
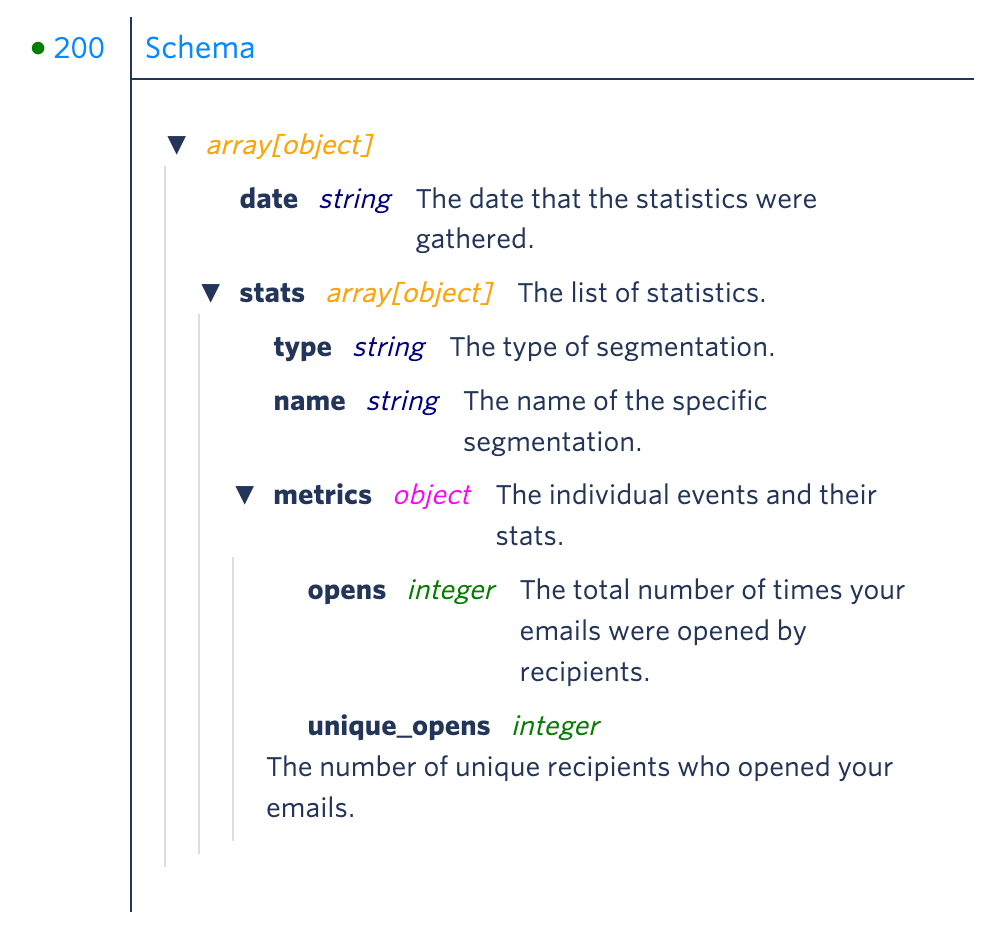
After reviewing the structure above, note that the repeating group being used in our example will show one aggregation by date per cell. You can think of 1 repeating group cell equating to one date period, with each period containing "Stat's Metrics" from the above breakdown.
If 4 weeks of data are requested (meaning "week" is selected as the aggregation and a date range of Jan 1st - Jan 24th is selected), 4 rows (date periods) will appear in this repeating group.
If 2 months of data are requested (meaning "month" is selected as the aggregation and a date range of Jan 1st - Feb 28th is selected), 2 rows (date periods) will appear.
Inside each repeating group cell, you have access to all data points listed above, starting with the cell's date and stat, then that stat's metrics. When selecting this expression in the repeating group cell, it will look like this:

Let's take a look at the individual metrics next. We're now using the expression Current cell's By Single Client (Sendgrid Stats)'s stats:each item's metrics opens:sum to show the number of opens on our emails for the cell's date period:

The same can be done for any other metrics listed in the documentation screenshot above.
Here's an example of our resulting data. We can see two rows in the repeating group (indicating "month" is selected as the aggregation and data from March and April is being requested) and a number following each month. Since desktop is selected from the client type dropdown, only opens from desktop clients are counted.

Available Path (* indicates a required value)
client-type - This should be any of the following four options: phone, tablet, webmail, desktop. These values must be lowercase.
Available Parameters (* indicates a required value)
start_date - This parameter must follow the yyyy-mm-dd format. This is a required field and cannot be left blank. Be sure to format your parameter value is this way above, else you will receive an error.
end_date - This parameter must follow the yyyy-mm-dd format. This is not a required field and can be left blank. Be sure to format your parameter value is this way above, else you will receive an error.
aggregated_ - This parameter can contain any of the three text values: day, week, month. These values must be type text and lowercase.
By Mailbox Provider - Data Call
This endpoint allows you to retrieve your email statistics segmented by recipient mailbox provider.
🔗
SendGrid documentation: https://docs.sendgrid.com/api-reference/stats/retrieve-email-statistics-by-mailbox-provider
Set up your data source
In this example, we'll use a repeating group to display our data:
- Type of content = By Mailbox Provider (SendGrid Stats)
- Data source = Get data from an external API > Sendgrid Stats - By Mailbox Provider

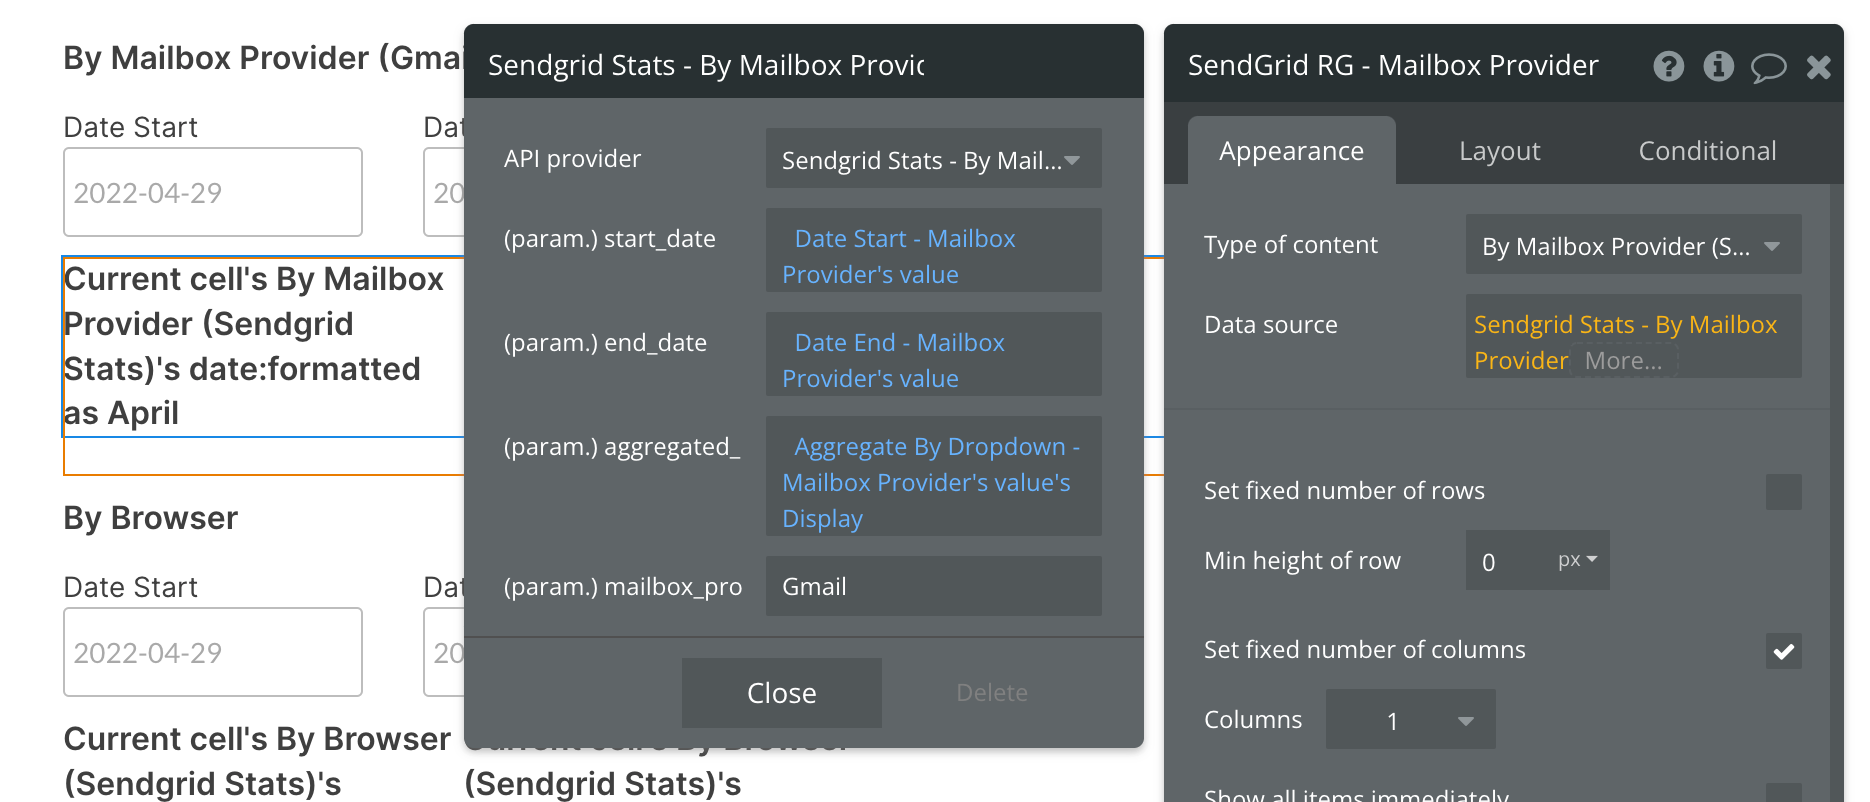
By default, you'll see a static start_date and aggregated values. You can continue using static values, or replace them with dynamic data sources, like in the above example.
Here we are using two date/time pickers to dynamically select our date range.
The Aggregate By Dropdown is pulling from an option set with three text values: day, week, month. You can use any method for selecting these options, provided they are type text and are lowercase.
The last parameter allows you to filter the results by mailbox provider. In this example, we're leaving the default value as Gmail, but you can change this as you need (or provide a dropdown of various mailbox providers).
Previewing your data
Before you configure the contents of the repeating group, it's important to understand the format of the response sent from SendGrid. Below is a screenshot taken from SendGrid documentation highlighting the structure of the data being returned.
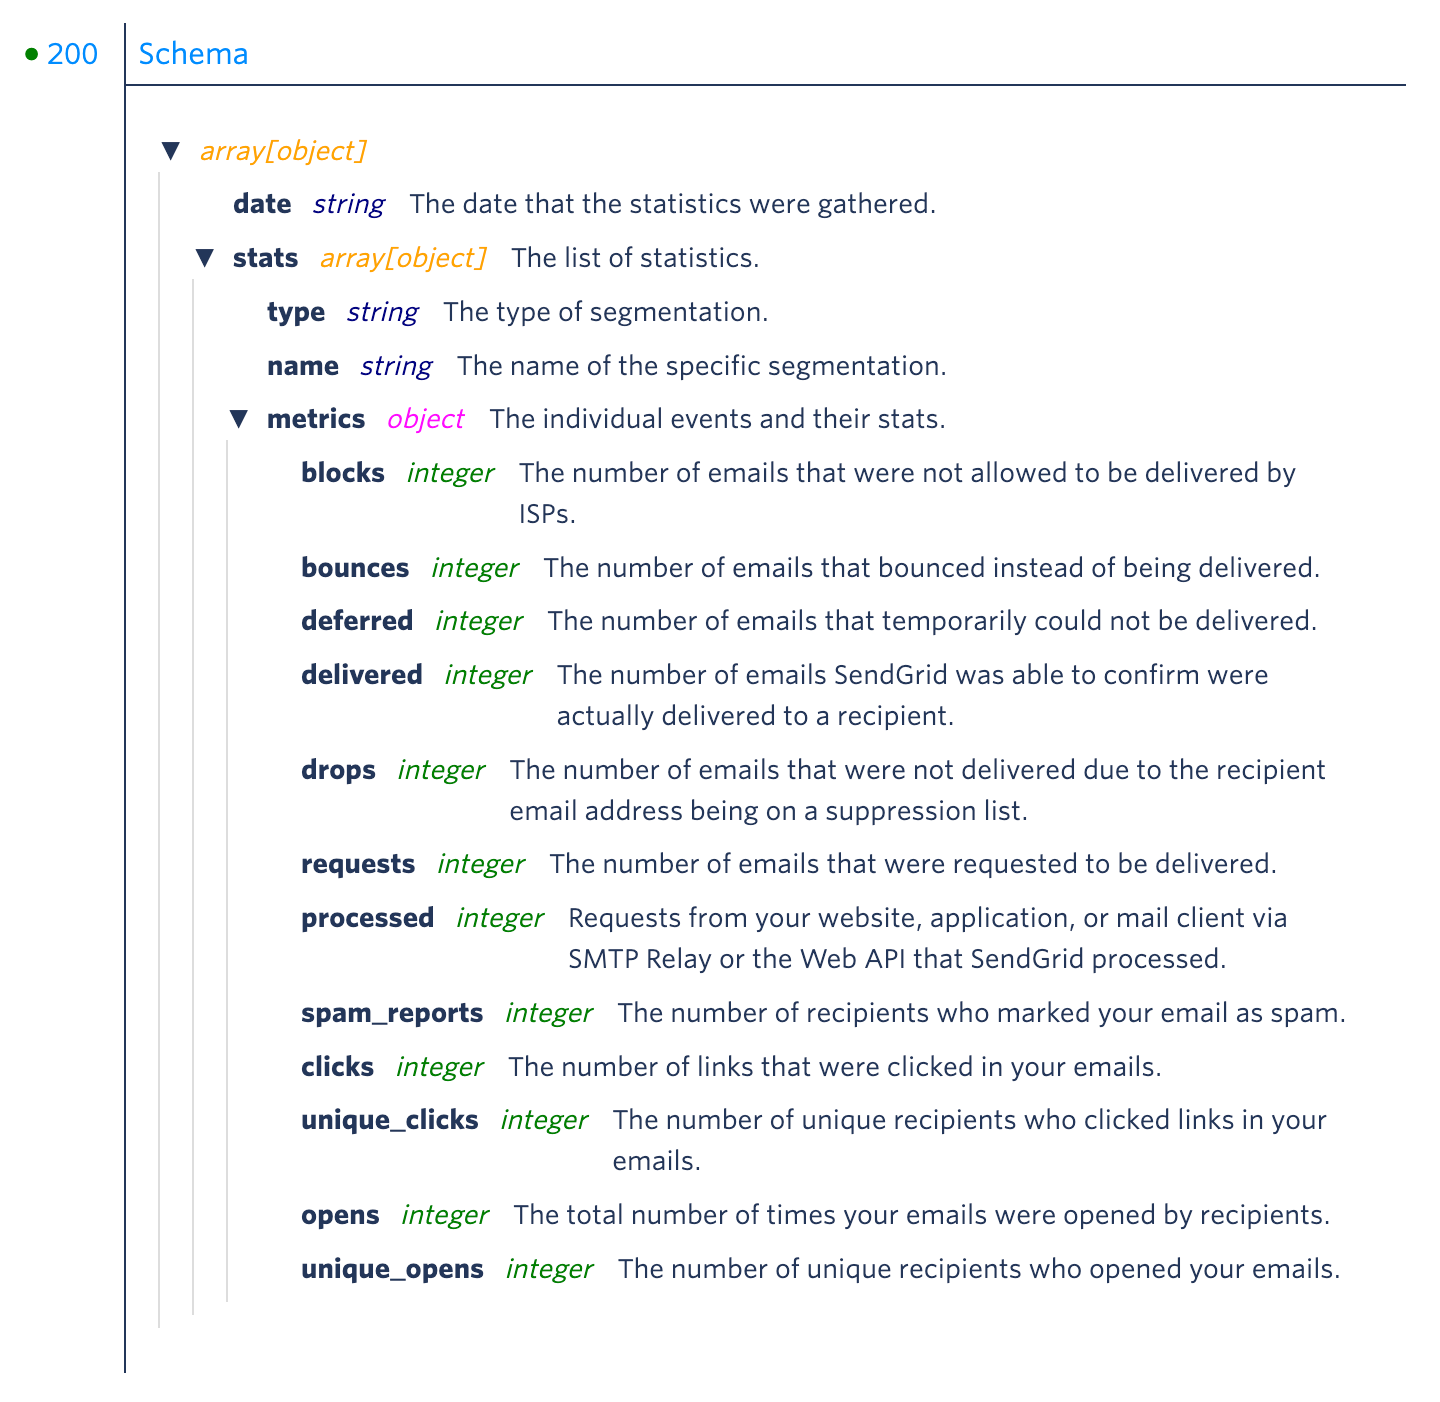
After reviewing the structure above, note that the repeating group being used in our example will show one aggregation by date per cell. You can think of 1 repeating group cell equating to one date period, with each period containing "Stat's Metrics" from the above breakdown.
If 4 weeks of data are requested (meaning "week" is selected as the aggregation and a date range of Jan 1st - Jan 24th is selected), 4 rows (date periods) will appear in this repeating group.
If 2 months of data are requested (meaning "month" is selected as the aggregation and a date range of Jan 1st - Feb 28th is selected), 2 rows (date periods) will appear.
Inside each repeating group cell, you have access to all data points listed above, starting with the cell's date and stat, then that stat's metrics. When selecting this expression in the repeating group cell, it will look like this:
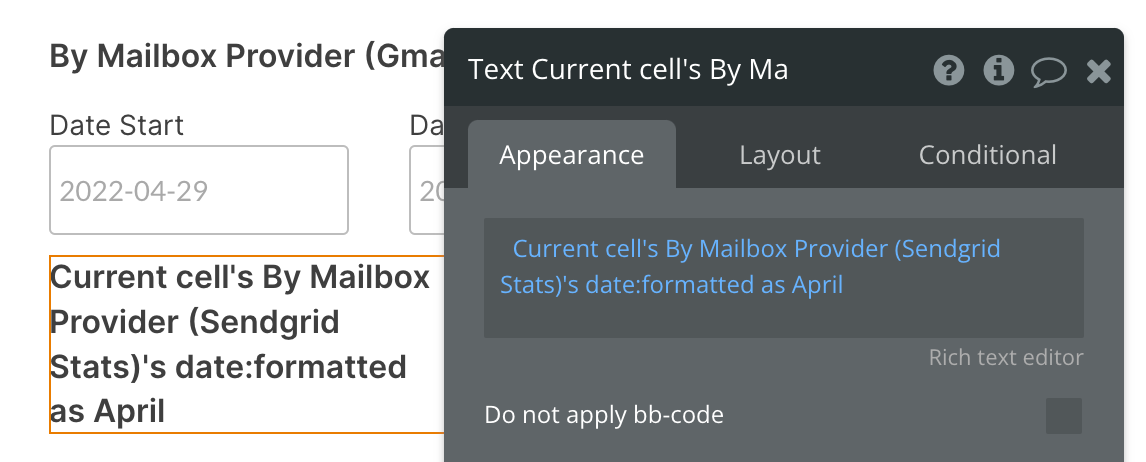
Let's take a look at the individual metrics next. We're now using the expression Current cell's By Mailbox Provider (Sendgrid Stats)'s stats:each item's metrics clicks:sum to show the number of clicks on our emails for the cell's date period:

The same can be done for any other metrics listed in the documentation screenshot above.
Here's an example of our resulting data. We can see two rows in the repeating group (indicating "month" is selected as the aggregation and data from February and March is being requested) and a number following each month. In February there were 222 clicks and in March 165 clicks.

Available Parameters (* indicates a required value)
start_date - This parameter must follow the yyyy-mm-dd format. This is a required field and cannot be left blank. Be sure to format your parameter value is this way above, else you will receive an error.
end_date - This parameter must follow the yyyy-mm-dd format. This is not a required field and can be left blank. Be sure to format your parameter value is this way above, else you will receive an error.
aggregated_ - This parameter can contain any of the three text values: day, week, month. These values must be type text and lowercase.
mailbox_pro - This parameter allows one text value at a time. This value can be any of the popular mailbox providers you choose to filter your data by. The first character must be capitalized, else it will not work. Gmail returns a valid response, whereas gmail does not.
By Browser - Data Call
This endpoint allows you to retrieve your email statistics segmented by browser type.
🔗
SendGrid documentation: https://docs.sendgrid.com/api-reference/stats/retrieve-email-statistics-by-browser
Set up your data source
In this example, we'll use a repeating group to display our data:
- Type of content = By Browser (SendGrid Stats)
- Data source = Get data from an external API > Sendgrid Stats - By Browser
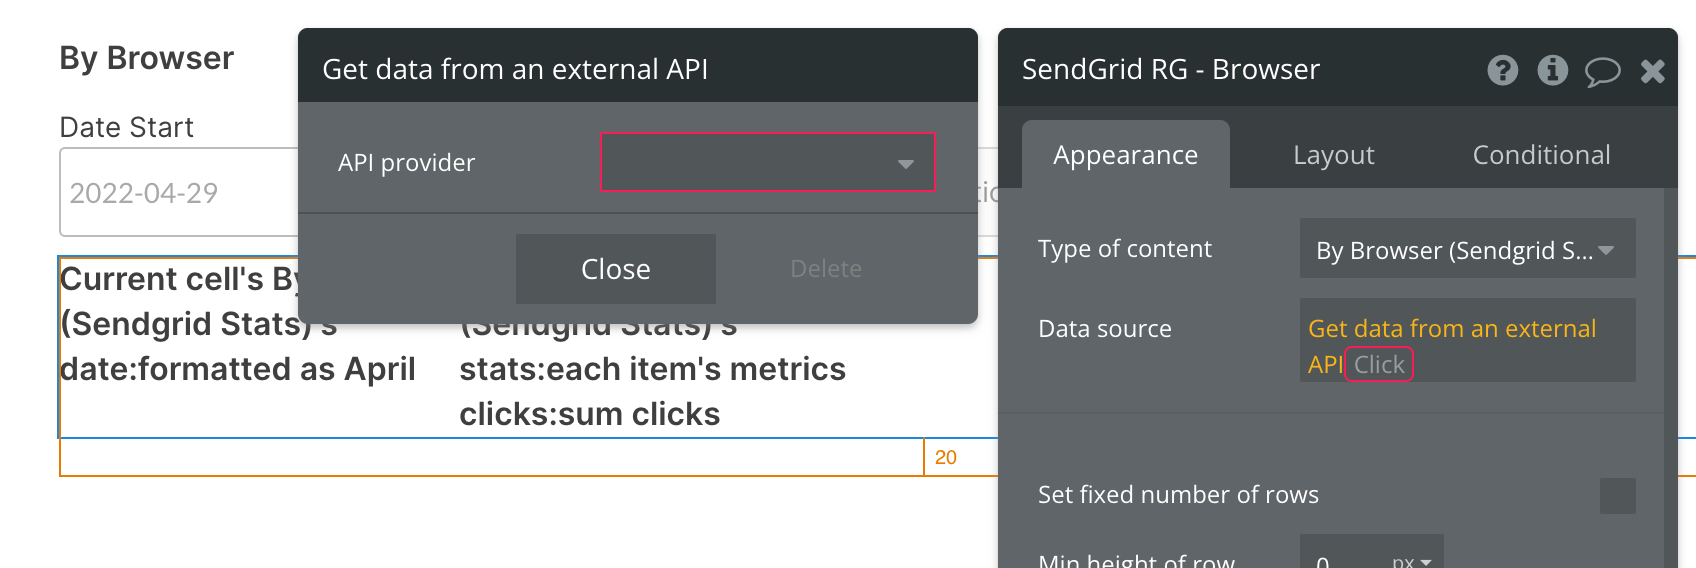
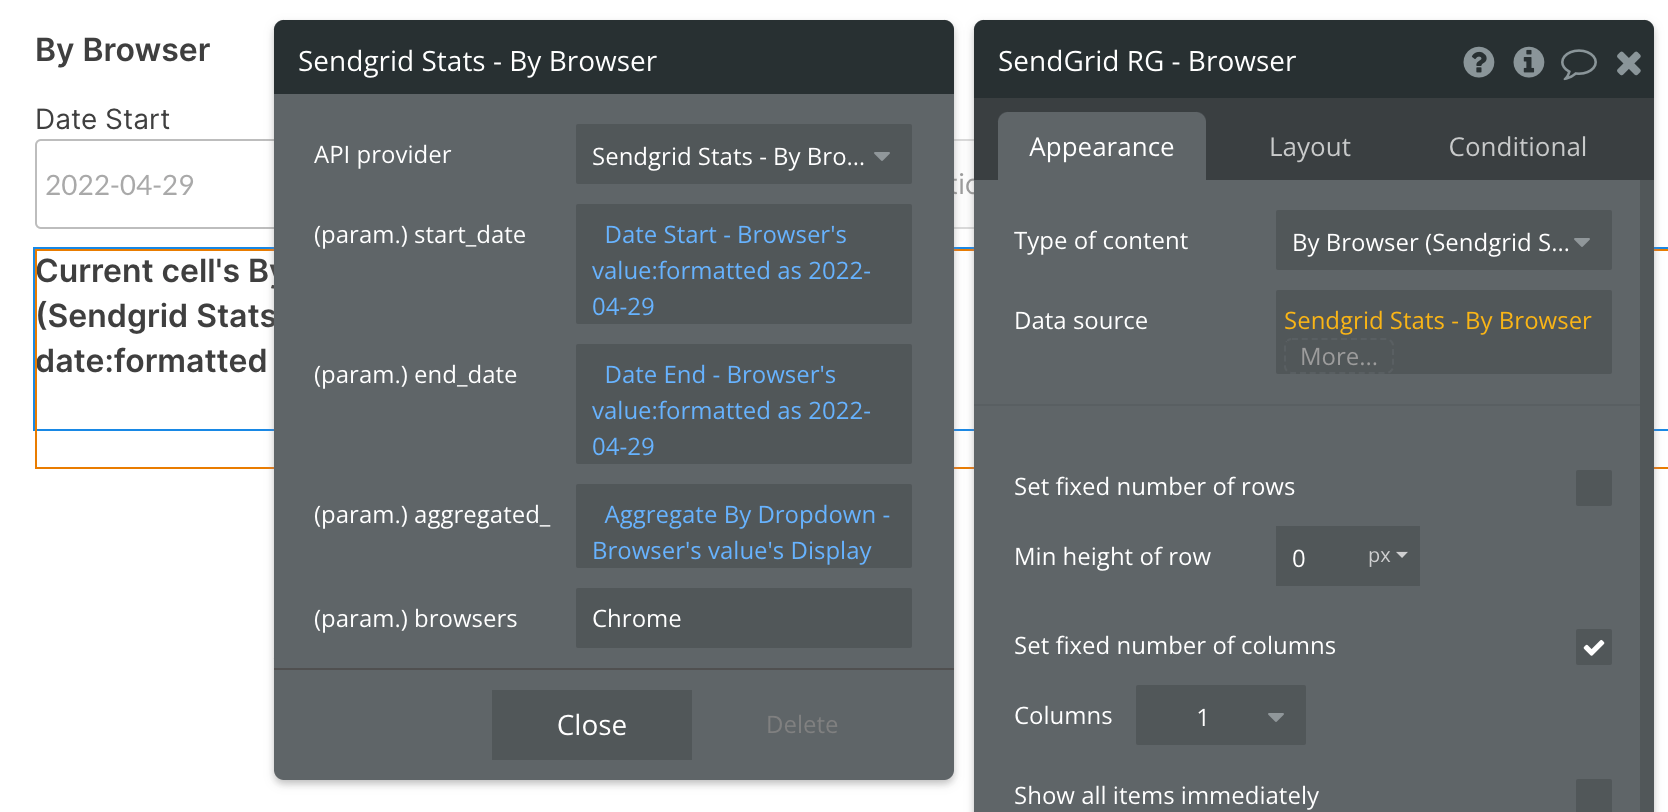
By default, you'll see a static start_date and aggregated values. You can continue using static values, or replace them with dynamic data sources, like in the above example.
Here we are using two date/time pickers to dynamically select our date range.
The Aggregate By Dropdown is pulling from an option set with three text values: day, week, month. You can use any method for selecting these options, provided they are type text and are lowercase.
The last parameter allows you to filter the results by browser. In this example, we're leaving the default value as Chrome, but you can change this as you need (or provide a dropdown of various browsers).
Previewing your data
Before you configure the contents of the repeating group, it's important to understand the format of the response sent from SendGrid. Below is a screenshot taken from SendGrid documentation highlighting the structure of the data being returned.
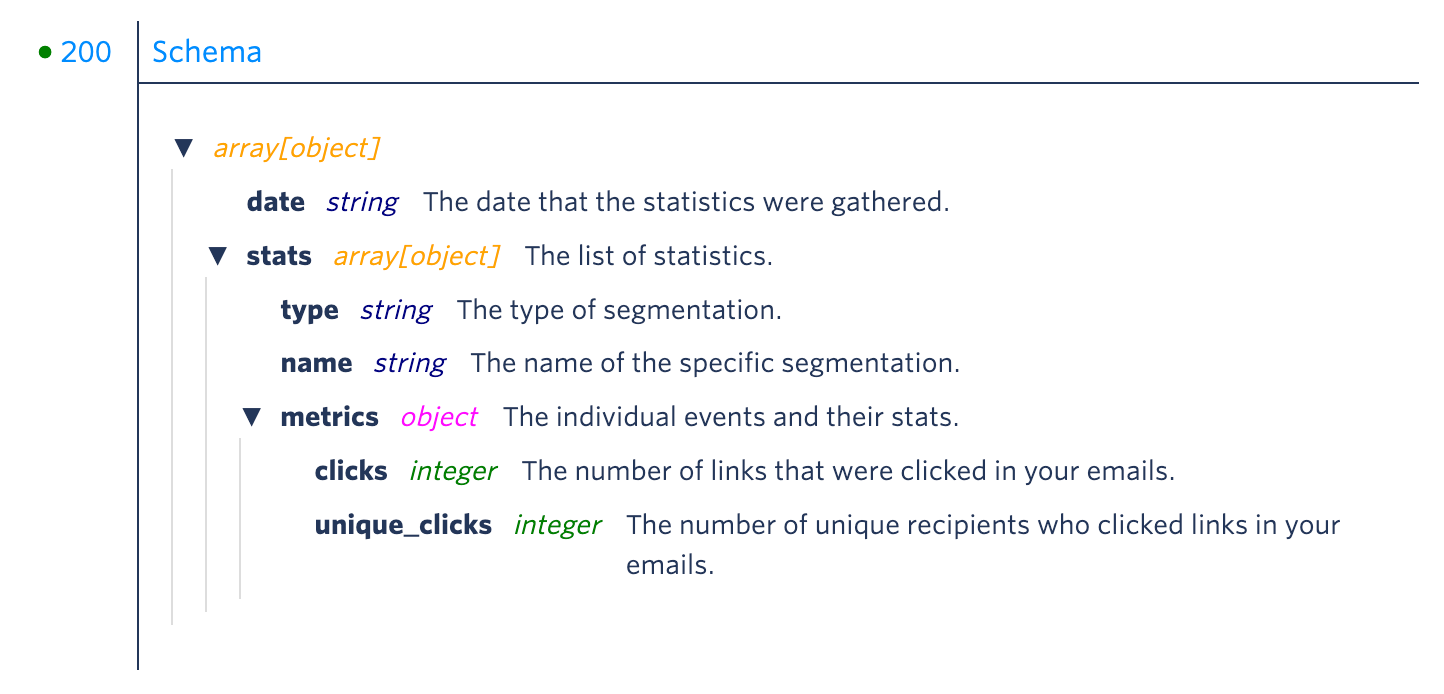
After reviewing the structure above, note that the repeating group being used in our example will show one aggregation by date per cell. You can think of 1 repeating group cell equating to one date period, with each period containing "Stat's Metrics" from the above breakdown.
If 4 weeks of data are requested (meaning "week" is selected as the aggregation and a date range of Jan 1st - Jan 24th is selected), 4 rows (date periods) will appear in this repeating group.
If 2 months of data are requested (meaning "month" is selected as the aggregation and a date range of Jan 1st - Feb 28th is selected), 2 rows (date periods) will appear.
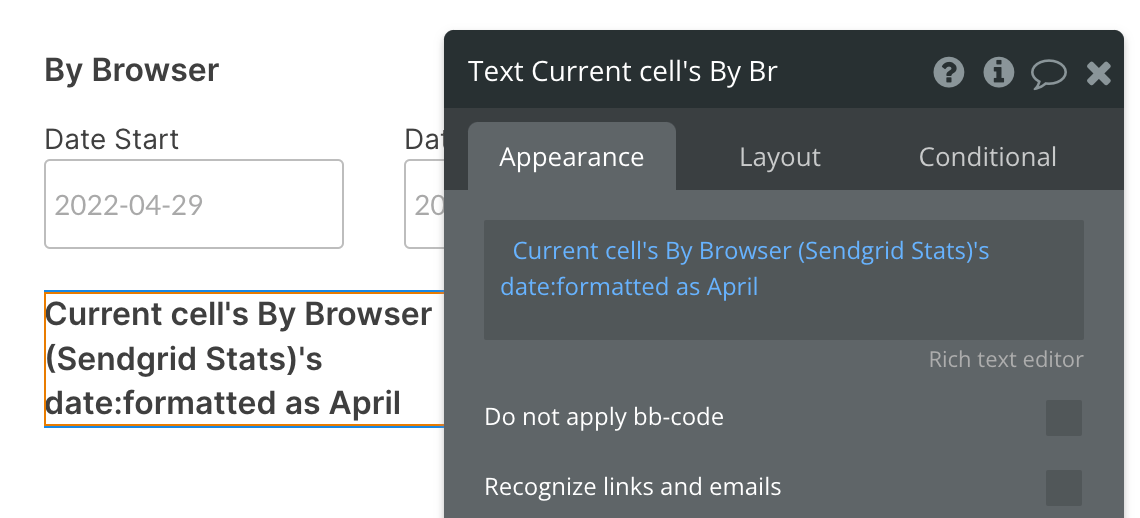
Inside each repeating group cell, you have access to all data points listed above, starting with the cell's date and stat, then that stat's metrics. When selecting this expression in the repeating group cell, it will look like this:
Let's take a look at the individual metrics next. We're now using the expression Current cell's By Browser (Sendgrid Stats)'s stats:each item's metrics clicks:sum to show the number of clicks on our emails for the cell's date period:
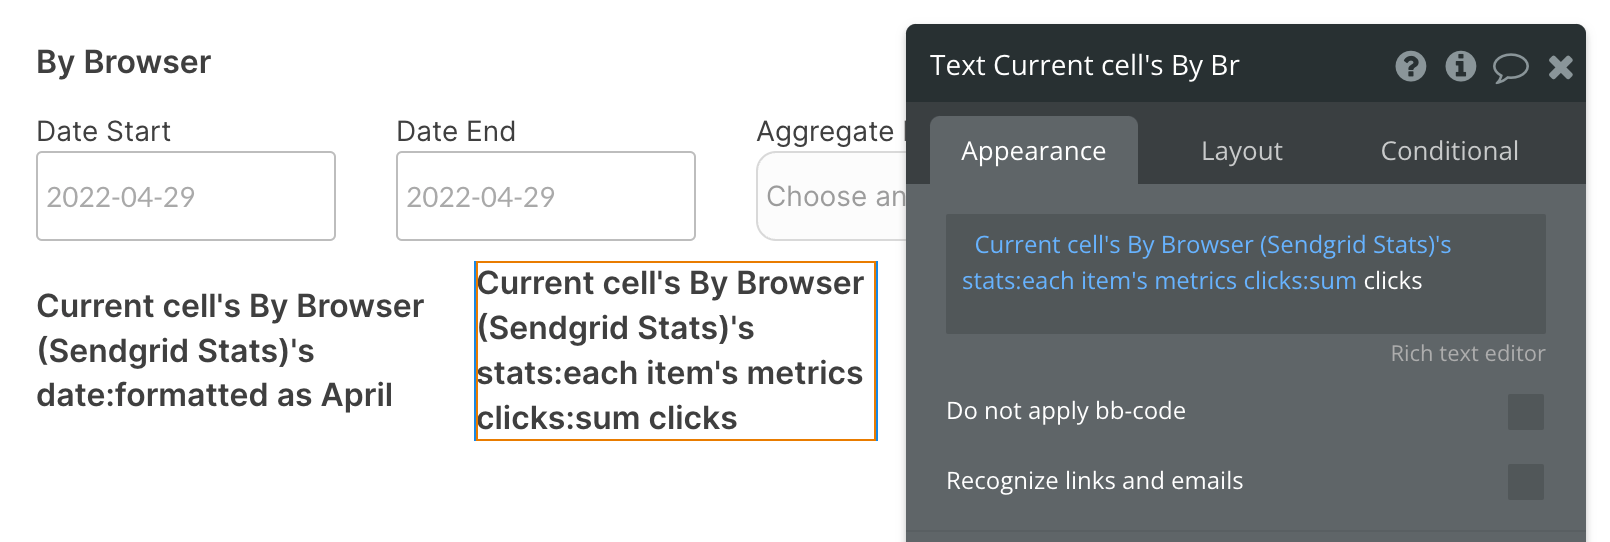
The same can be done for any other metrics listed in the documentation screenshot above.
Here's an example of our resulting data. We can see two rows in the repeating group (indicating "month" is selected as the aggregation and data from February and March is being requested) and a number following each month. In February there were 53 clicks and in March 87 clicks.

Available Parameters (* indicates a required value)
start_date - This parameter must follow the yyyy-mm-dd format. This is a required field and cannot be left blank. Be sure to format your parameter value is this way above, else you will receive an error.
end_date - This parameter must follow the yyyy-mm-dd format. This is not a required field and can be left blank. Be sure to format your parameter value is this way above, else you will receive an error.
aggregated_ - This parameter can contain any of the three text values: day, week, month. These values must be type text and lowercase.
browsers - This parameter allows one text value at a time. This value can be any of the popular web browsers you choose to filter your data by. The first character must be capitalized, else it will not work. Chrome returns a valid response, whereas chrome does not.

Changelogs
Update 15.09.24 - Version 1.11.0
- Minor update (Marketing update).
Update 25.07.24 - Version 1.10.0
- Minor update .
Update 24.06.24 - Version 1.9.0
- Updated demo/service links.
Update 22.11.23 - Version 1.8.0
- updated description.
Update 19.10.23 - Version 1.7.0
- Updated description.
Update 18.09.23 - Version 1.6.0
- updated descriptions.
Update 13.09.23 - Version 1.5.0
- minor updates.
Update 04.09.23 - Version 1.4.0
- updated description.
Update 12.07.23 - Version 1.3.0
- updated description.
Update 26.06.23 - Version 1.2.0
- updated the description.
Update 09.06.22 - Version 1.1.0
- Updated Documentation.
Update 16.07.18 - Version 1.0.0
- Initial release. Global stats call and all Advanced calls.
