Demo to preview the settings
Introduction
This plugin is a commonly used graphical depiction of a project schedule. It's a type of bar chart showing the start and finish dates of a project's elements such as resources, planning, and dependencies.

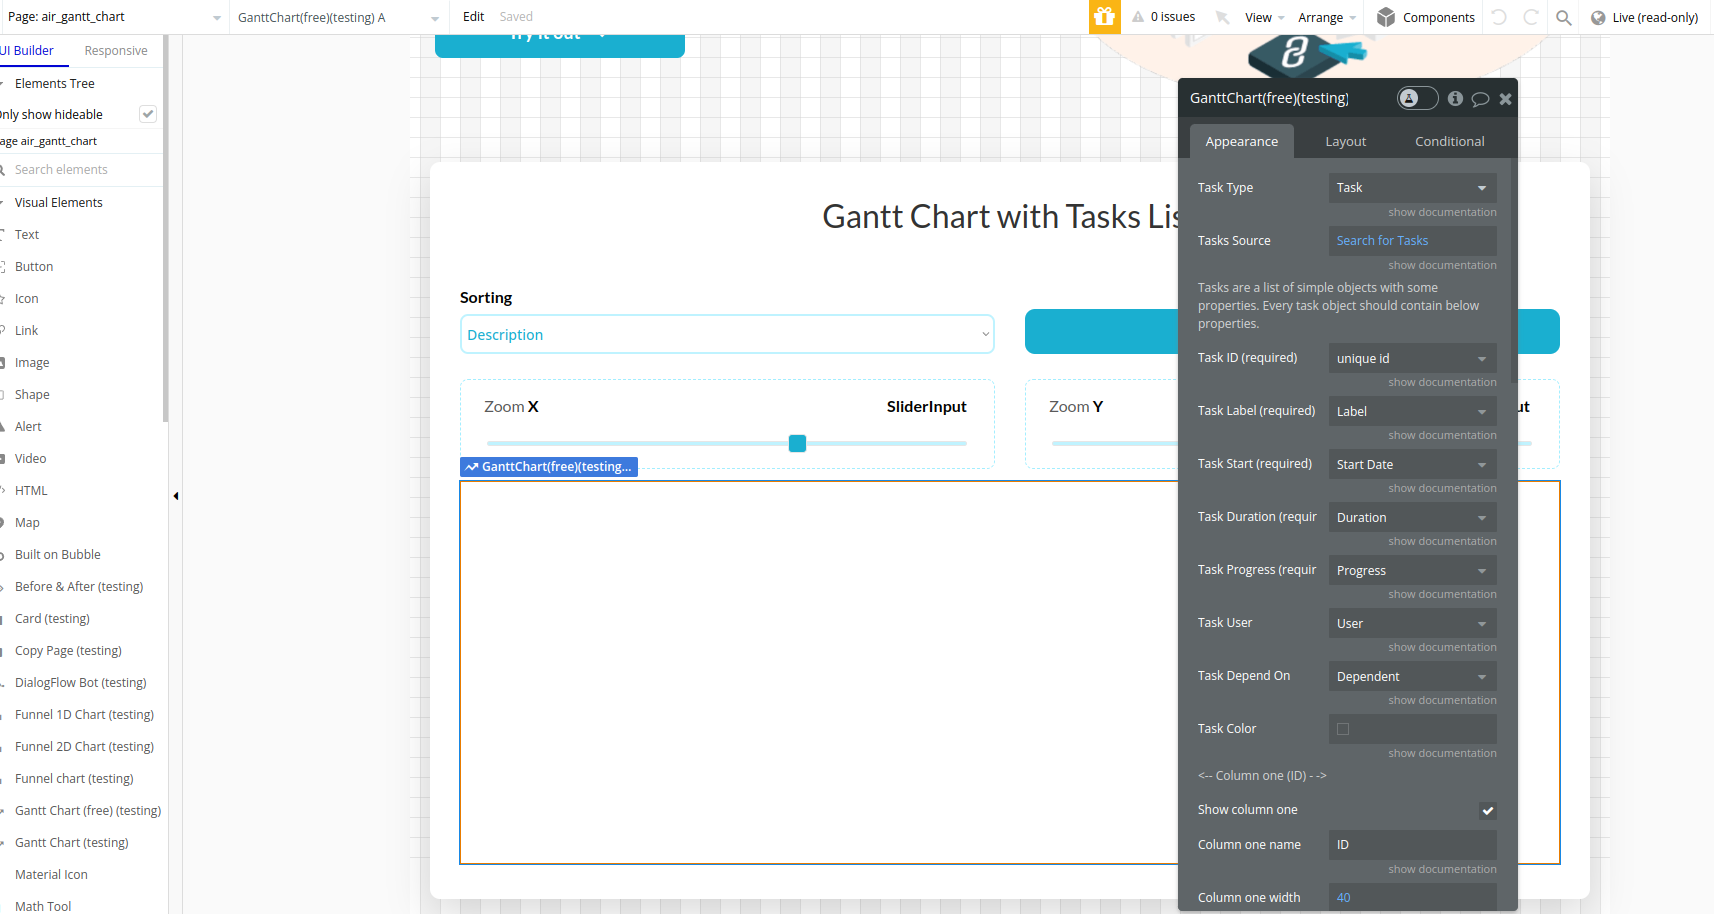
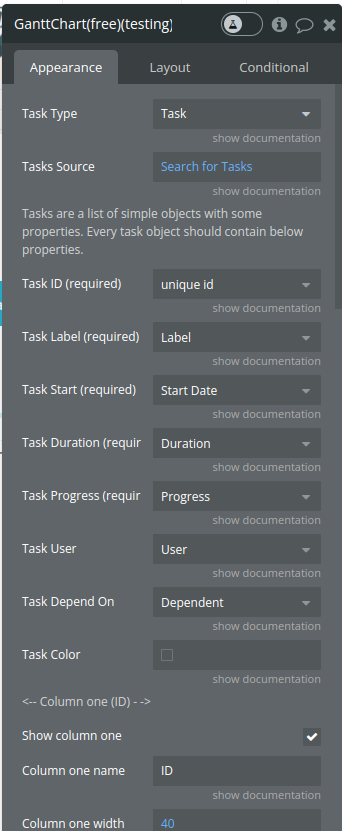
Plugin Element Properties
The plugin contains a Gantt Chart (free) visual element that should be used on a page.
Title | Description | Type |
Task type | The type of data from the database | dropdown |
Task source | The source of tasks in the database | dynamic field |
Task id (REQUIRED) | The unique id of the task. Can be a custom id, or bubble unique id. | text |
Task label (REQUIRED) | The field from the task type object that serves as label on the chart | dropdown |
Task start (REQUIRED) | The time when the task started. Must be a “bubble date” field from the type object. | dropdown |
Task duration (REQUIRED) | The expected duration of the task in seconds. Must be a numeric field from the type object. | dropdown |
Task progress (REQUIRED) | The progress of the task from 0 to 100. Must be a numeric field from the type object. | dropdown |
Task user (REQUIRED) | The user that this task is assigned to. This field can be written in DB like a simple name “John Doe” or it can be written like an HTML link, ex: “<a href=’url_here’>John Doe</a>” | dropdown |
Task depends on (REQUIRED) | The list of ids of other tasks that this task depends on. Must be a value from the task type object. The value is a list of text. | dropdown |
Task color | The color of the task type of task on the chart. The default color is #8E44AD. | color |
Column one (ID) | Displays the id of each item | |
Show column one | Add / remove an additional ID column from / to the list | checkbox |
Column one name | The label of the column | text |
Column one width | The width of the column | number |
Column two (Description) | ||
Show column two | Add / remove an additional Description column from / to the list | checkbox |
Column two name | The label of the column | text |
Column two width | The width of the second column | number |
Column three (ID) | ||
Show column three | Add / remove an additional Assigned to column from / to the list | checkbox |
Column three name | The label of the column | text |
Column three width | The width of the column | dropdown |
Column four (Start) | ||
Show column four | Add / remove an additional Start column from / to the list | checkbox |
Column four name | The name of the column | text |
Column four width | The width of the column | number |
Column five (%) | ||
Show column five | Add / remove an additional Type column from / to the list | checkbox |
Column five name | The name of the column | text |
Column five width | The width of the column | number |
Style settings | ||
Header background | background header container, Default: #f3f5f7 | color |
Header color | Color header container, Default: #000 | color |
Main view background | background main container, Default: #fff | color |
Main view color | color | |
Scale X | min: 2. max: 22. | number |
Scale Y | min: 10. max: 100. | number |
Tip: All the properties marked with REQUIRED are essential for rendering in the Gantt chart. If a REQUIRED field is empty, the Gantt chart on the page preview will ignore the task. The simplest way to get the Gantt chart working is to prepare your data accordingly to our documentation.
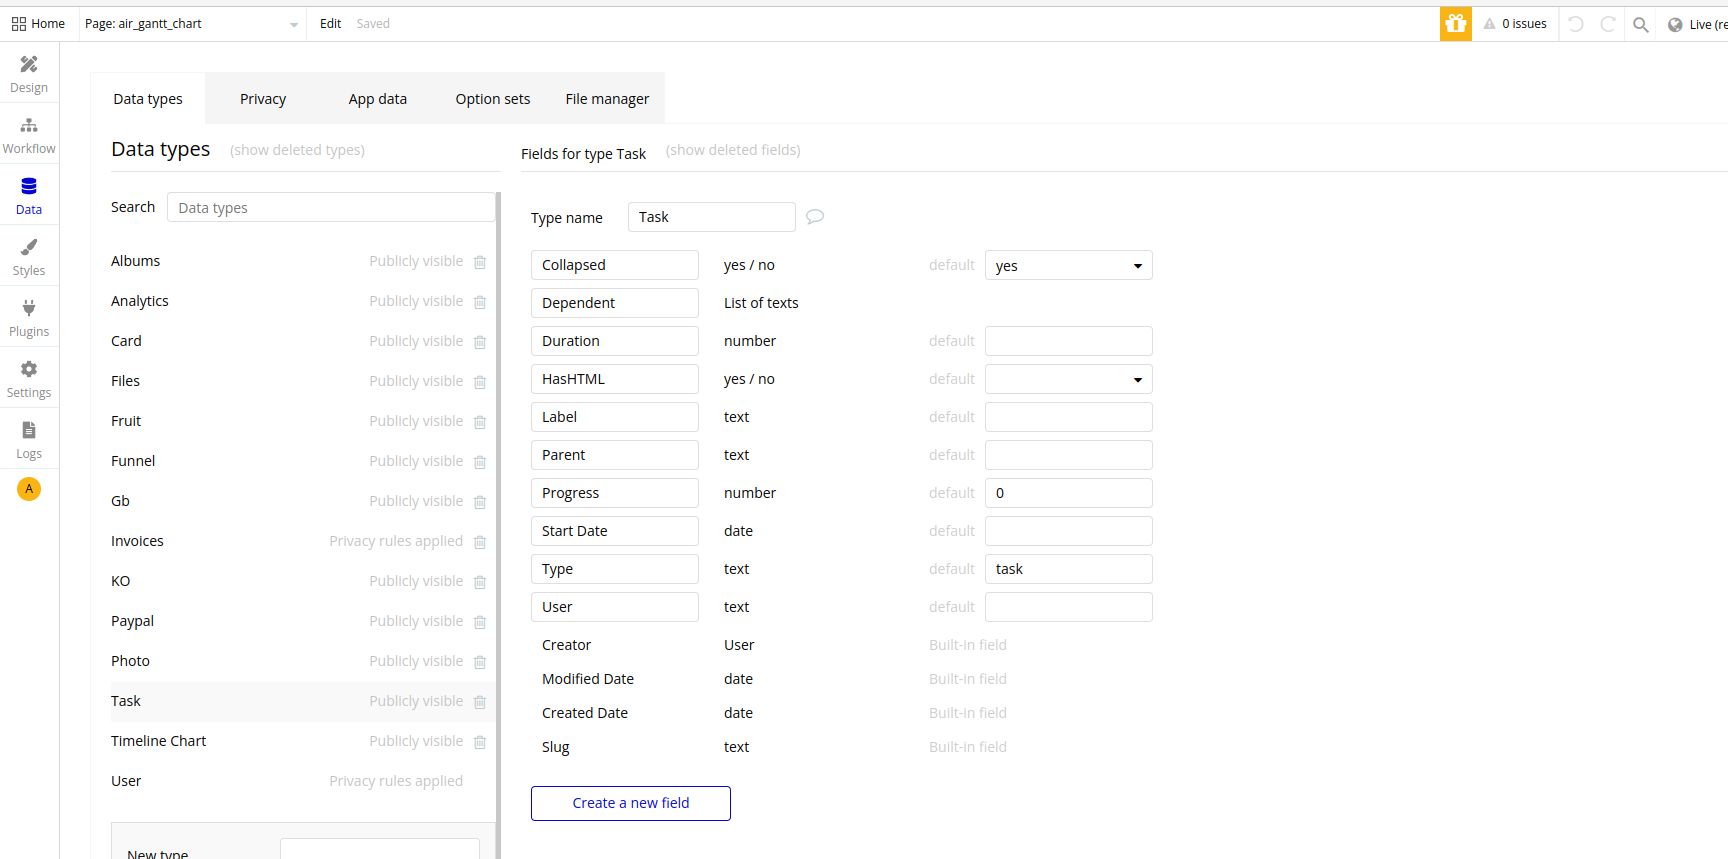
Tip: A best practice is to create a separate type for tasks in Bubble DB, for example, “Task”.
Element actions
- Center Chart
- Refresh Chart
Workflow example
- Create a Task data type in the database with all the required fields
- Place the Gantt Chart (free) visual element on the page and fill the fields with corresponding database fields