Link to plugin page: https://www.framer.com/marketplace/plugins/apex-charts/
Video Demo
Introduction
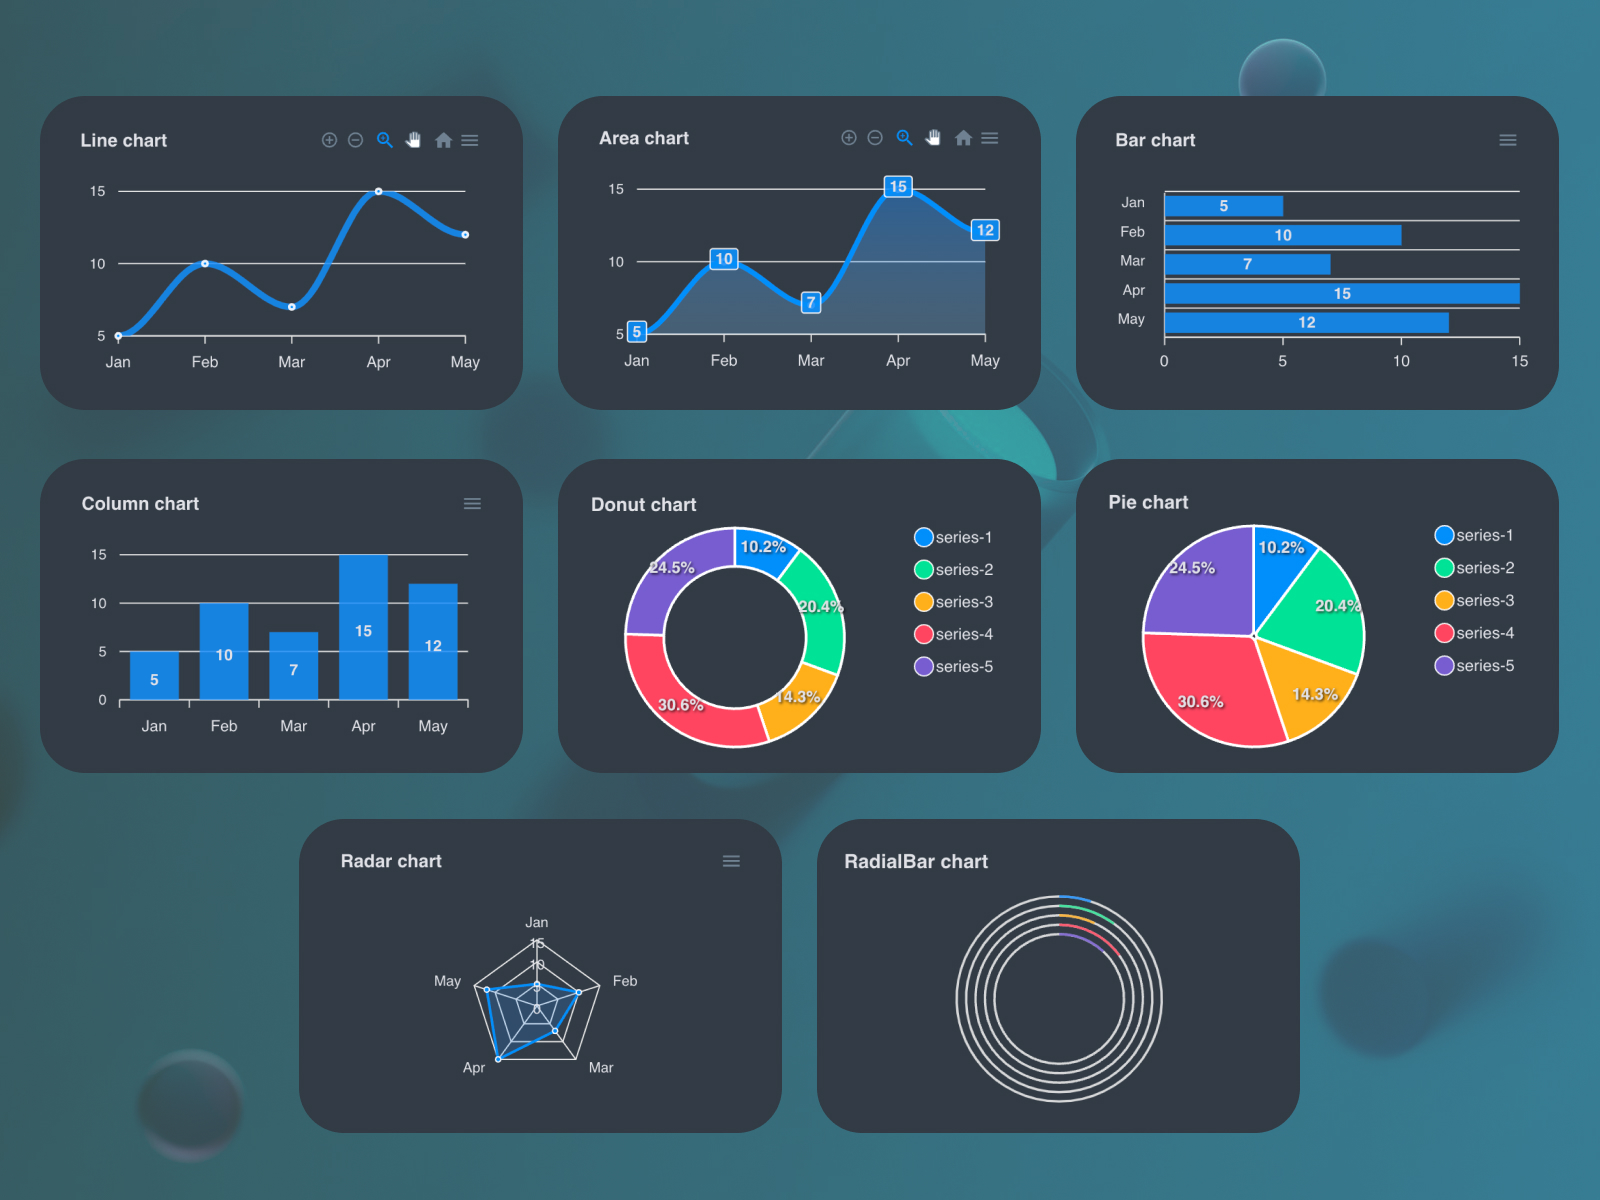
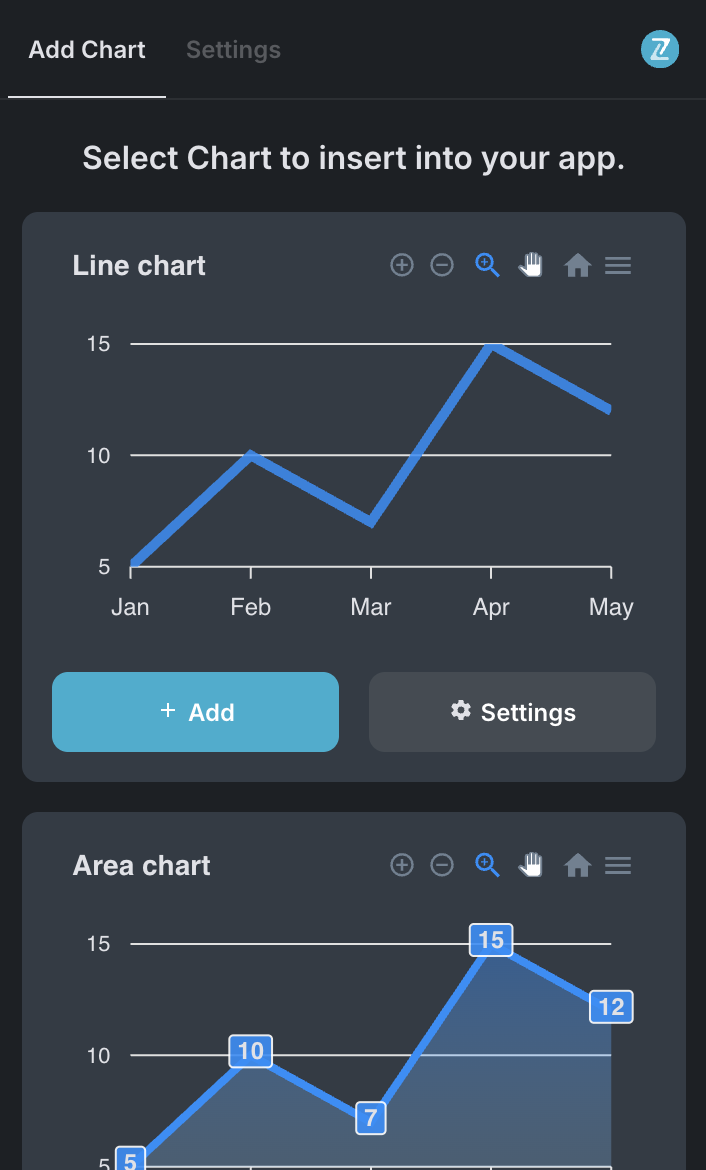
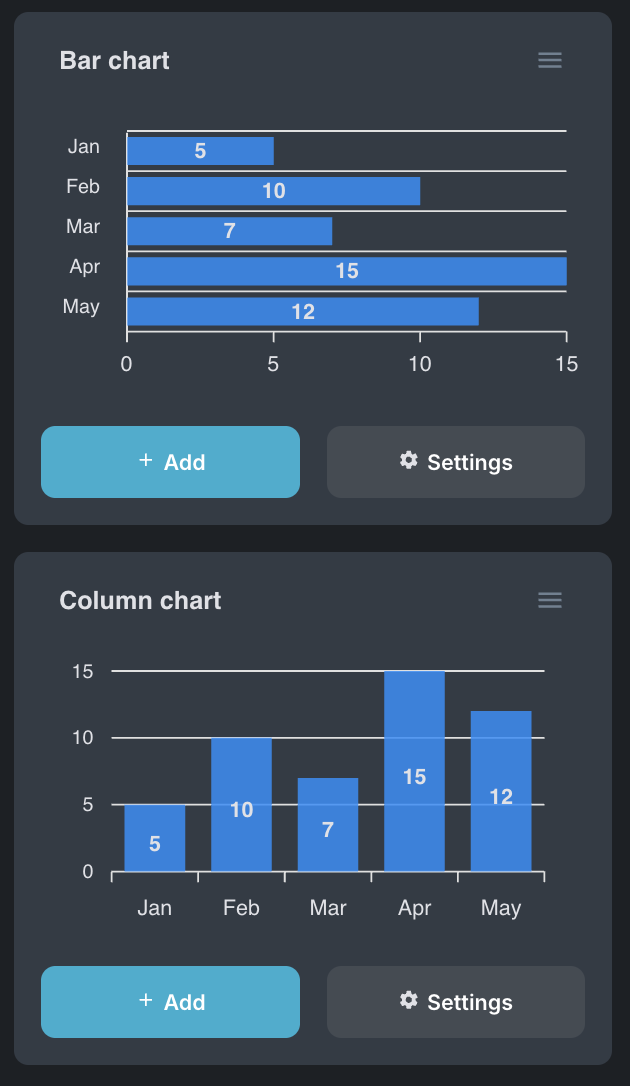
Apex Charts is a powerful no-code tool designed to enhance your app with interactive and customizable charts. The plugin allows users to visualize data through various chart types including line charts, area charts, bar charts, column charts, pie charts, donut charts, radar charts, and radial bar charts. Each chart can be extensively customized with different styling options, making it perfect for dashboards, reports, financial tracking, and any application requiring data visualization.
Prerequisites
No specific API keys or external accounts are needed to begin using the Apex Charts plugin. The plugin uses the ApexCharts library which is fully integrated, so you can get started right away without additional setup.
How to setup
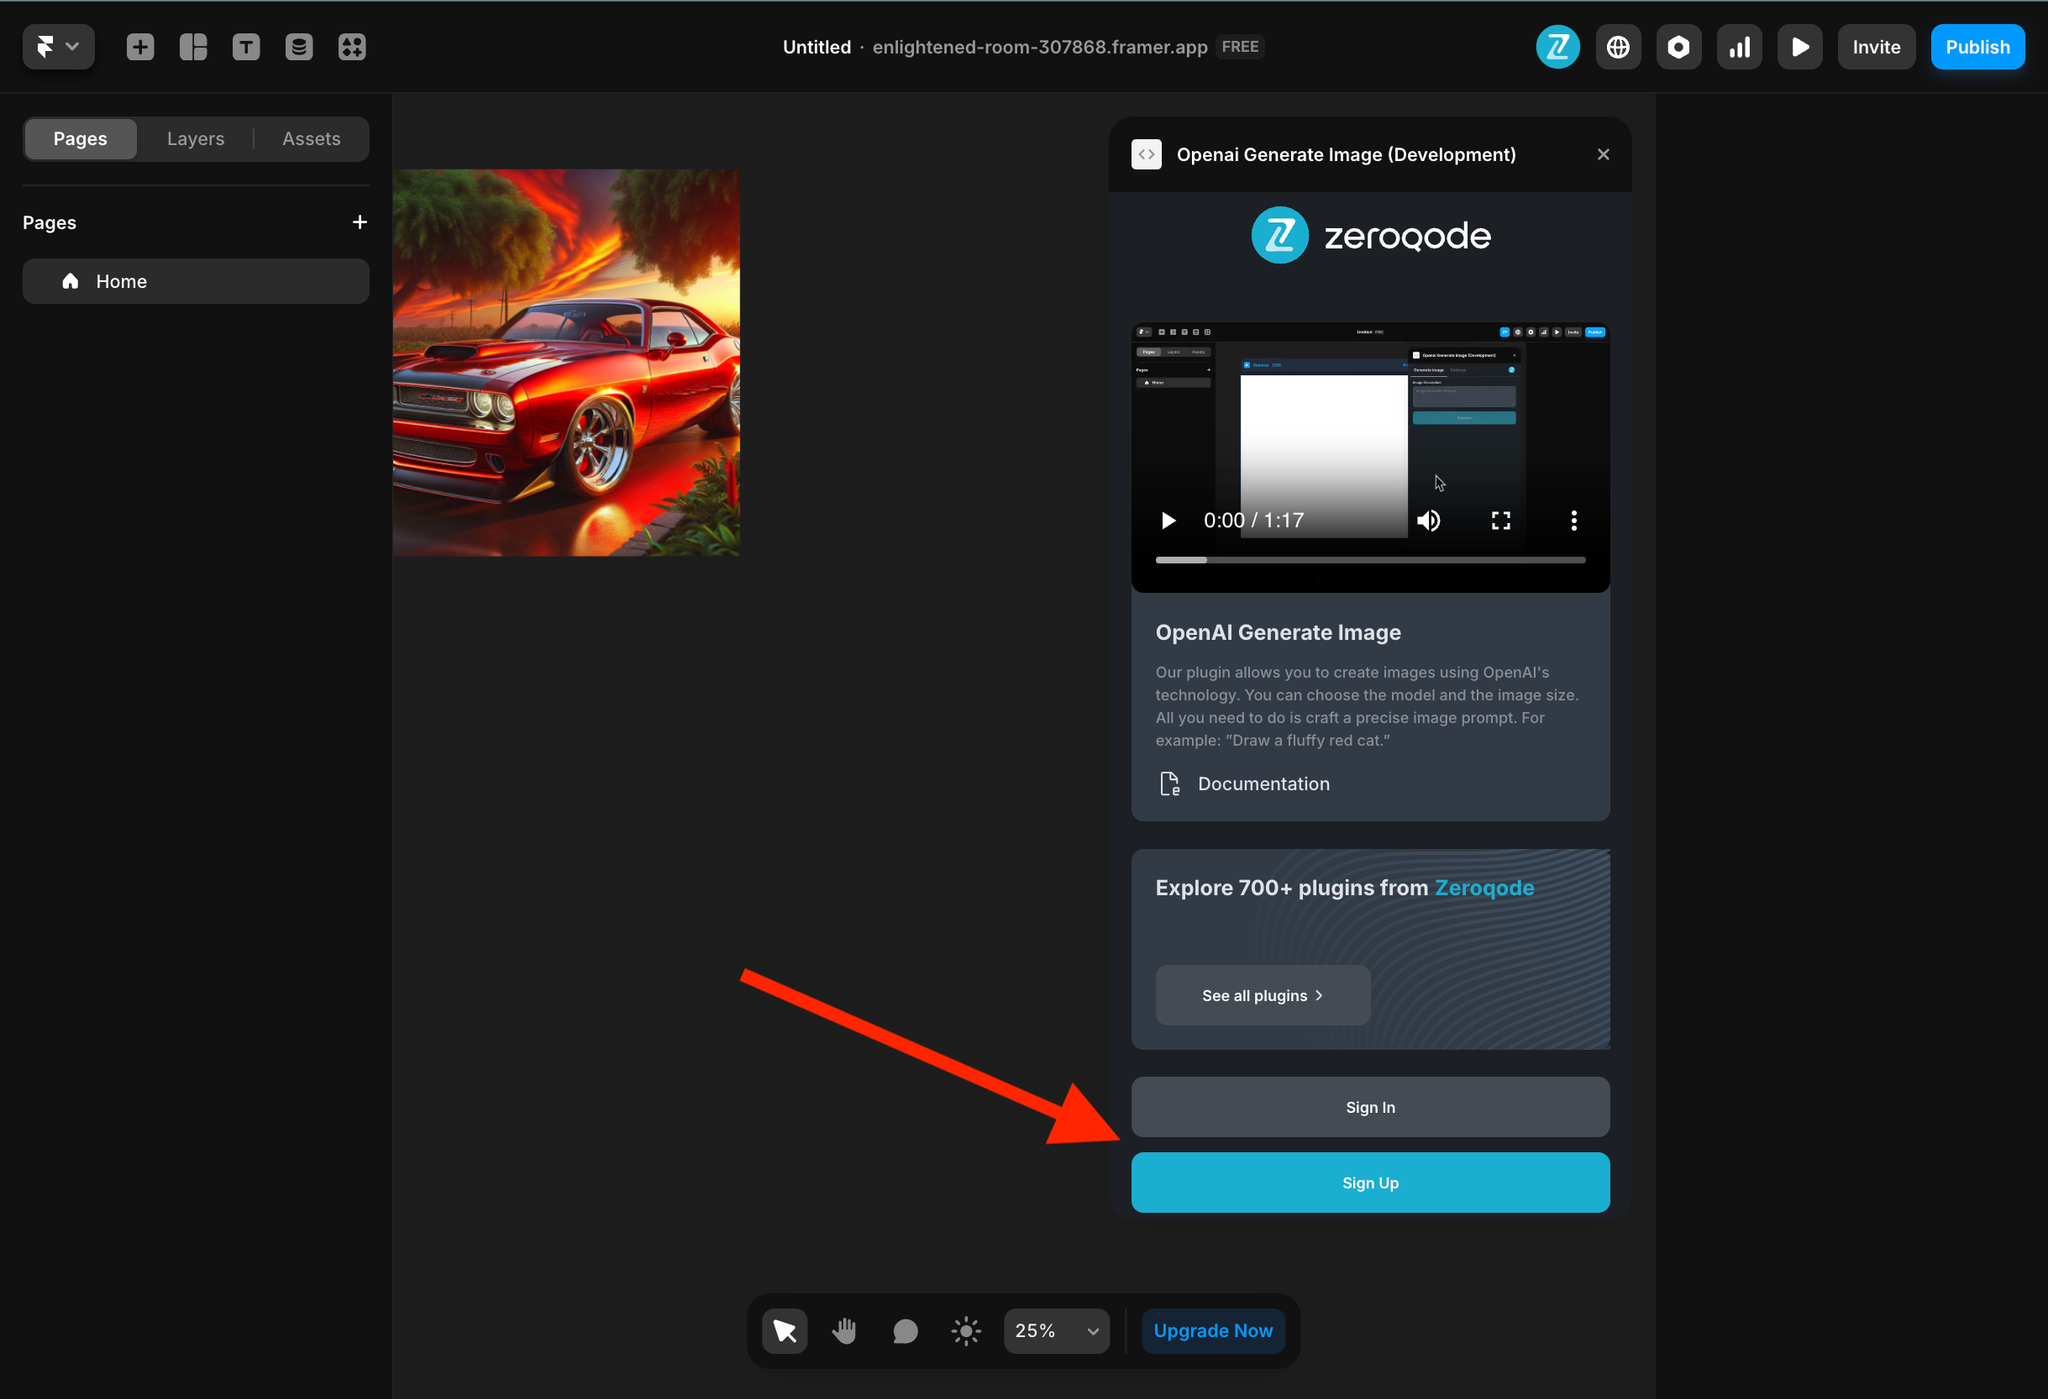
- Open the plugin.
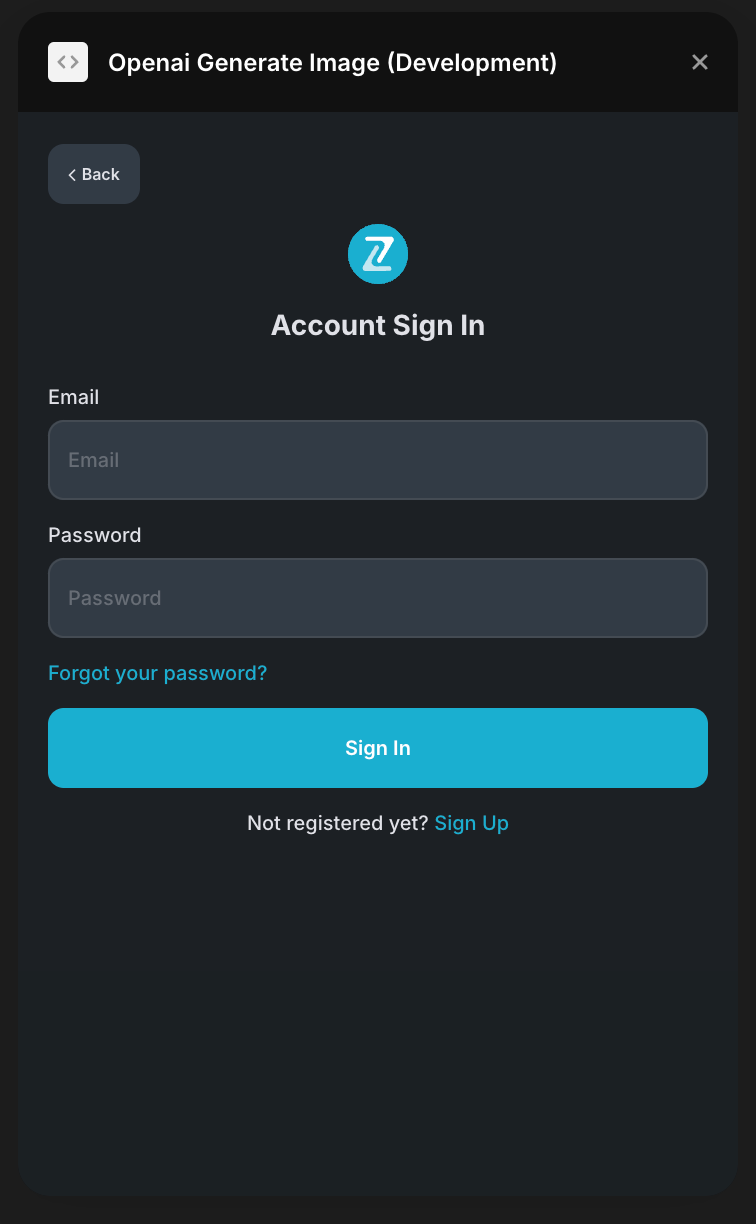
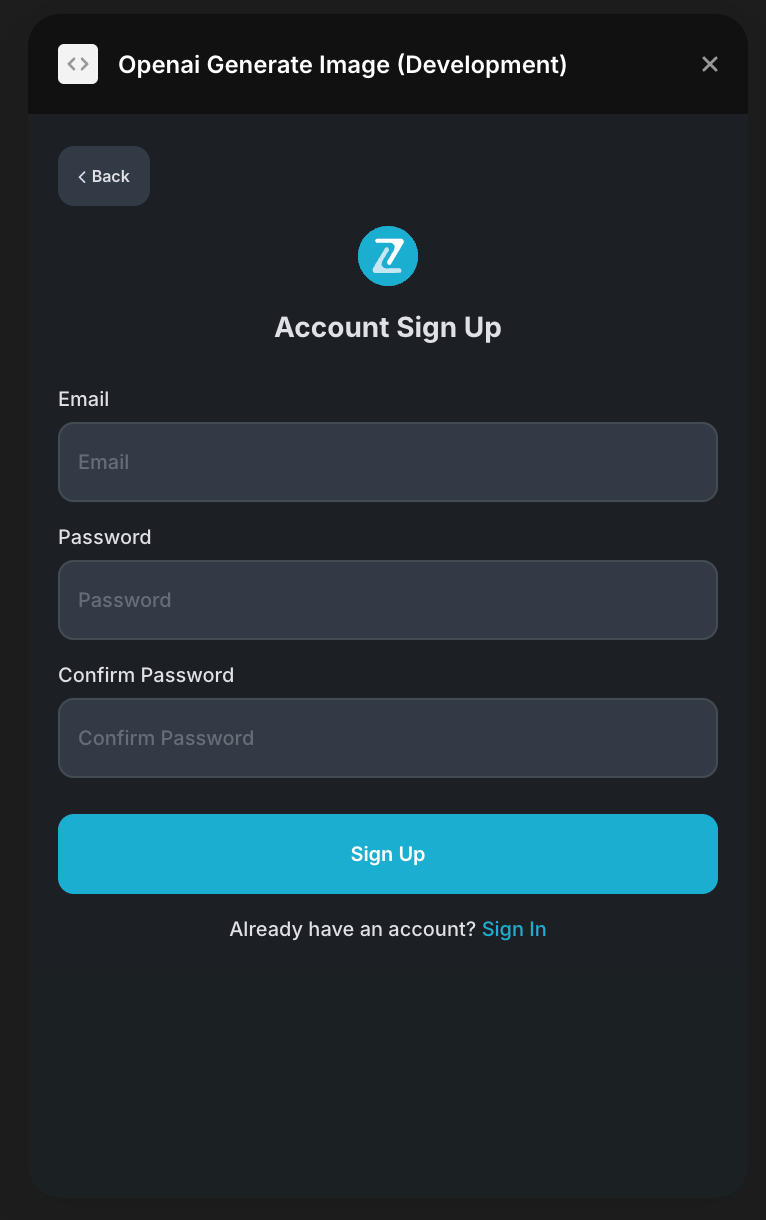
- To start using the plugin, you need to create or log in to your Zeroqode account. Select Sign In or Sign Up.
- Enter your account details.
- A subscription to all our plugins is required. Once subscribed, you will gain access to all our plugins.
- Select the desired chart type to add it to your canvas.
- Customize your chart using the properties panel.
Apex Chart Component
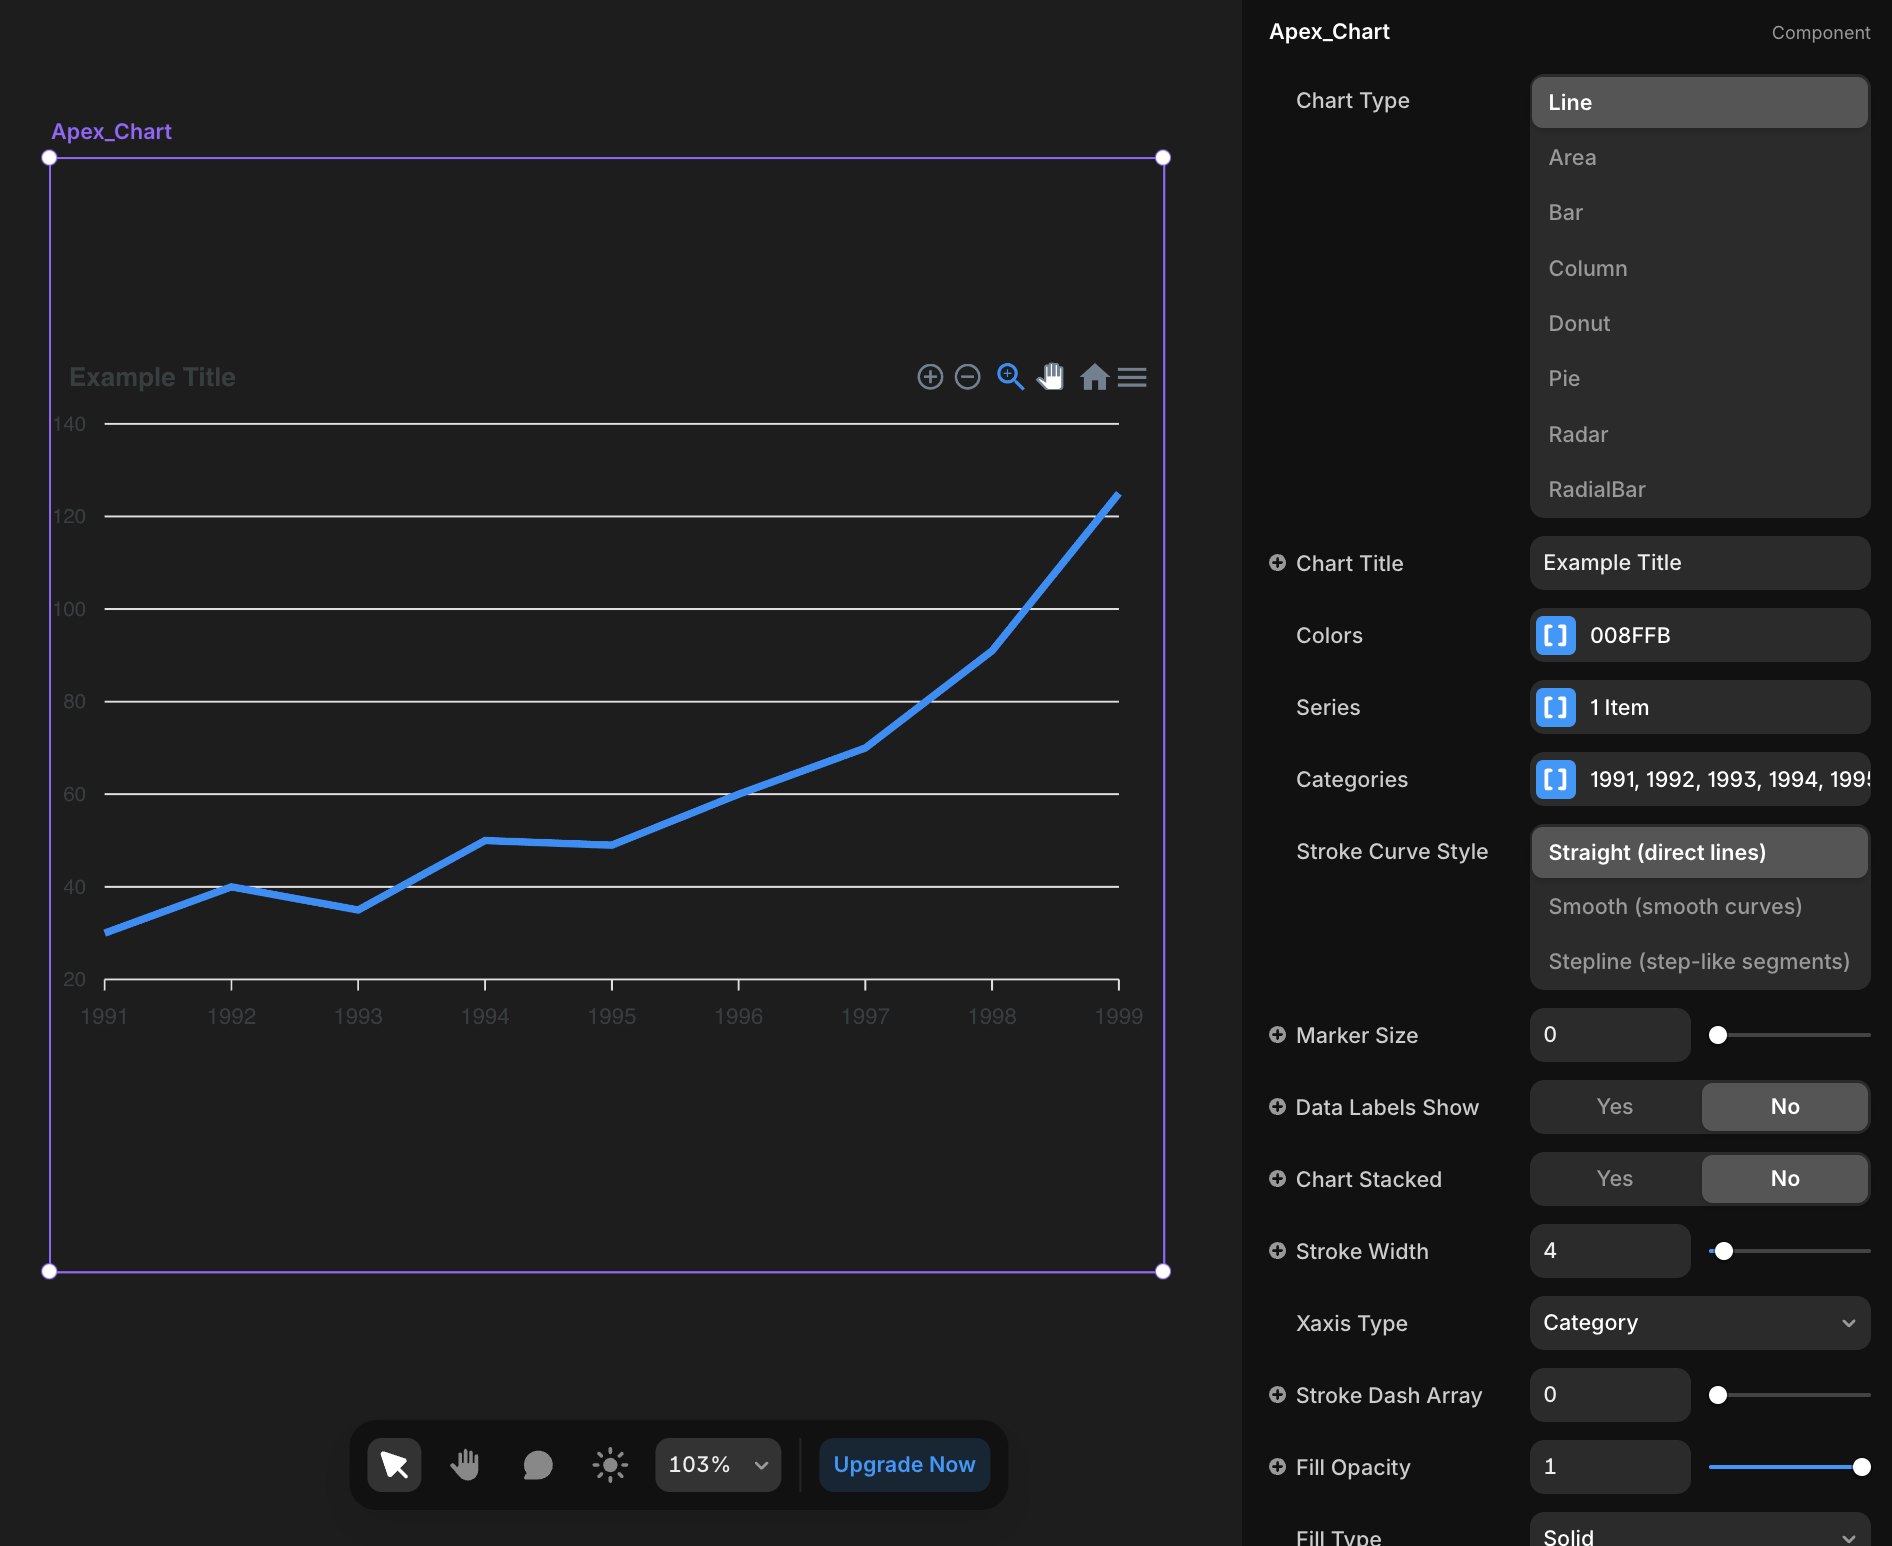
The plugin contains a primary component called Apex Chart that should be added to your canvas.
It's got a lot of settings, let's go over them.
Parameters:
Title | Description | Type |
Chart Type | Determines the type of chart to display (line, area, bar, etc.) | Enum |
Chart Title | The title displayed at the top of the chart | Text |
Colors | Array of colors to use for the chart elements. | Array of Colors |
Series Data | Data points for pie, donut, and radial charts
Example:
Serie Name: Example Sales
Serie Data: [30, 40, 50] | Array of Numbers |
Series | Array of named series with data points for line, area, bar, column, and radar charts | Array of Objects |
Categories | Labels for the x-axis categories | Array of Strings |
Stroke Curve Style | Style of lines connecting data points | Enum |
Marker Size | Size of data point markers | Number |
Data Labels Show | Whether to display labels for data points | Boolean |
Chart Stacked | Whether to stack multiple series | Boolean |
Stroke Width | Width of stroke lines | Number |
Xaxis Type | Data type for the x-axis | Enum |
Stroke Dash Array | Pattern of dashes and gaps in the stroke | Number |
Fill Opacity | Opacity of the fill area | Number |
Fill Type | Type of fill to use (solid, gradient, pattern, image) | Enum |
Fill Gradient | Configuration for gradient fills | Object |
Fill Image | Configuration for image fills | Object |
Fill Pattern | Configuration for pattern fills | Object |
Fill Gradient Properties
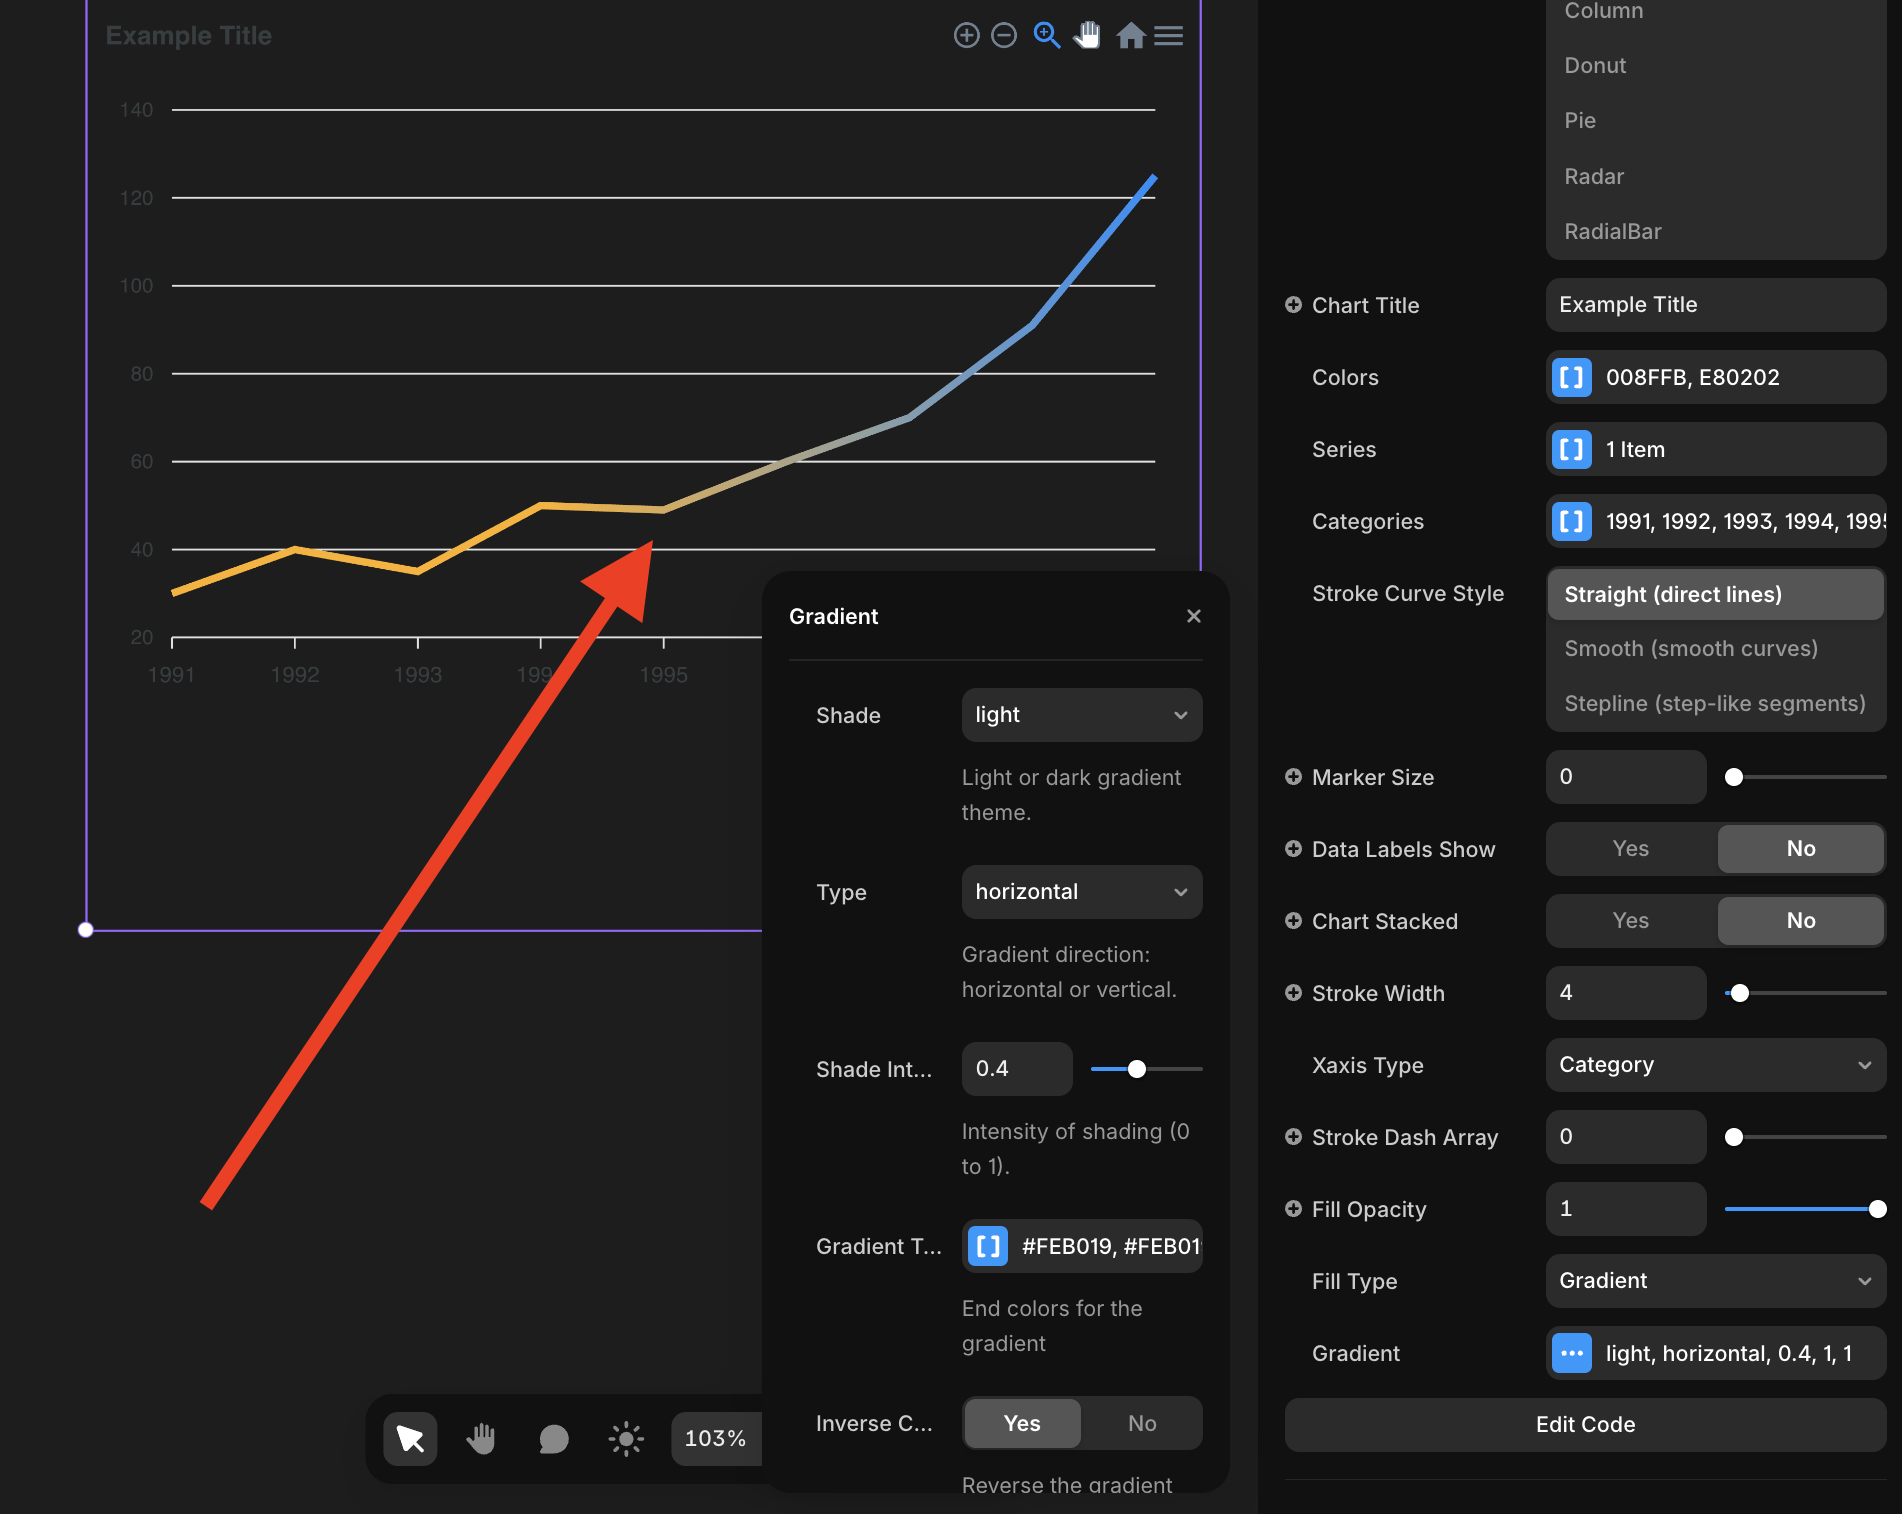
Parameters:
Title | Description | Type |
Shade | Light or dark gradient theme | Enum (light, dark) |
Type | Direction of the gradient | Enum (vertical, horizontal) |
Shade Intensity | Intensity of shading | Number (0-1) |
Gradient To Colors | End colors for the gradient | Array of Colors |
Inverse Colors | Reverse the gradient colors | Boolean |
Opacity From | Starting opacity for gradient | Number (0-1) |
Opacity To | Ending opacity for gradient | Number (0-1) |
Stops | Position of color stops in gradient | Array of Numbers (0-100) |
Fill Pattern Properties
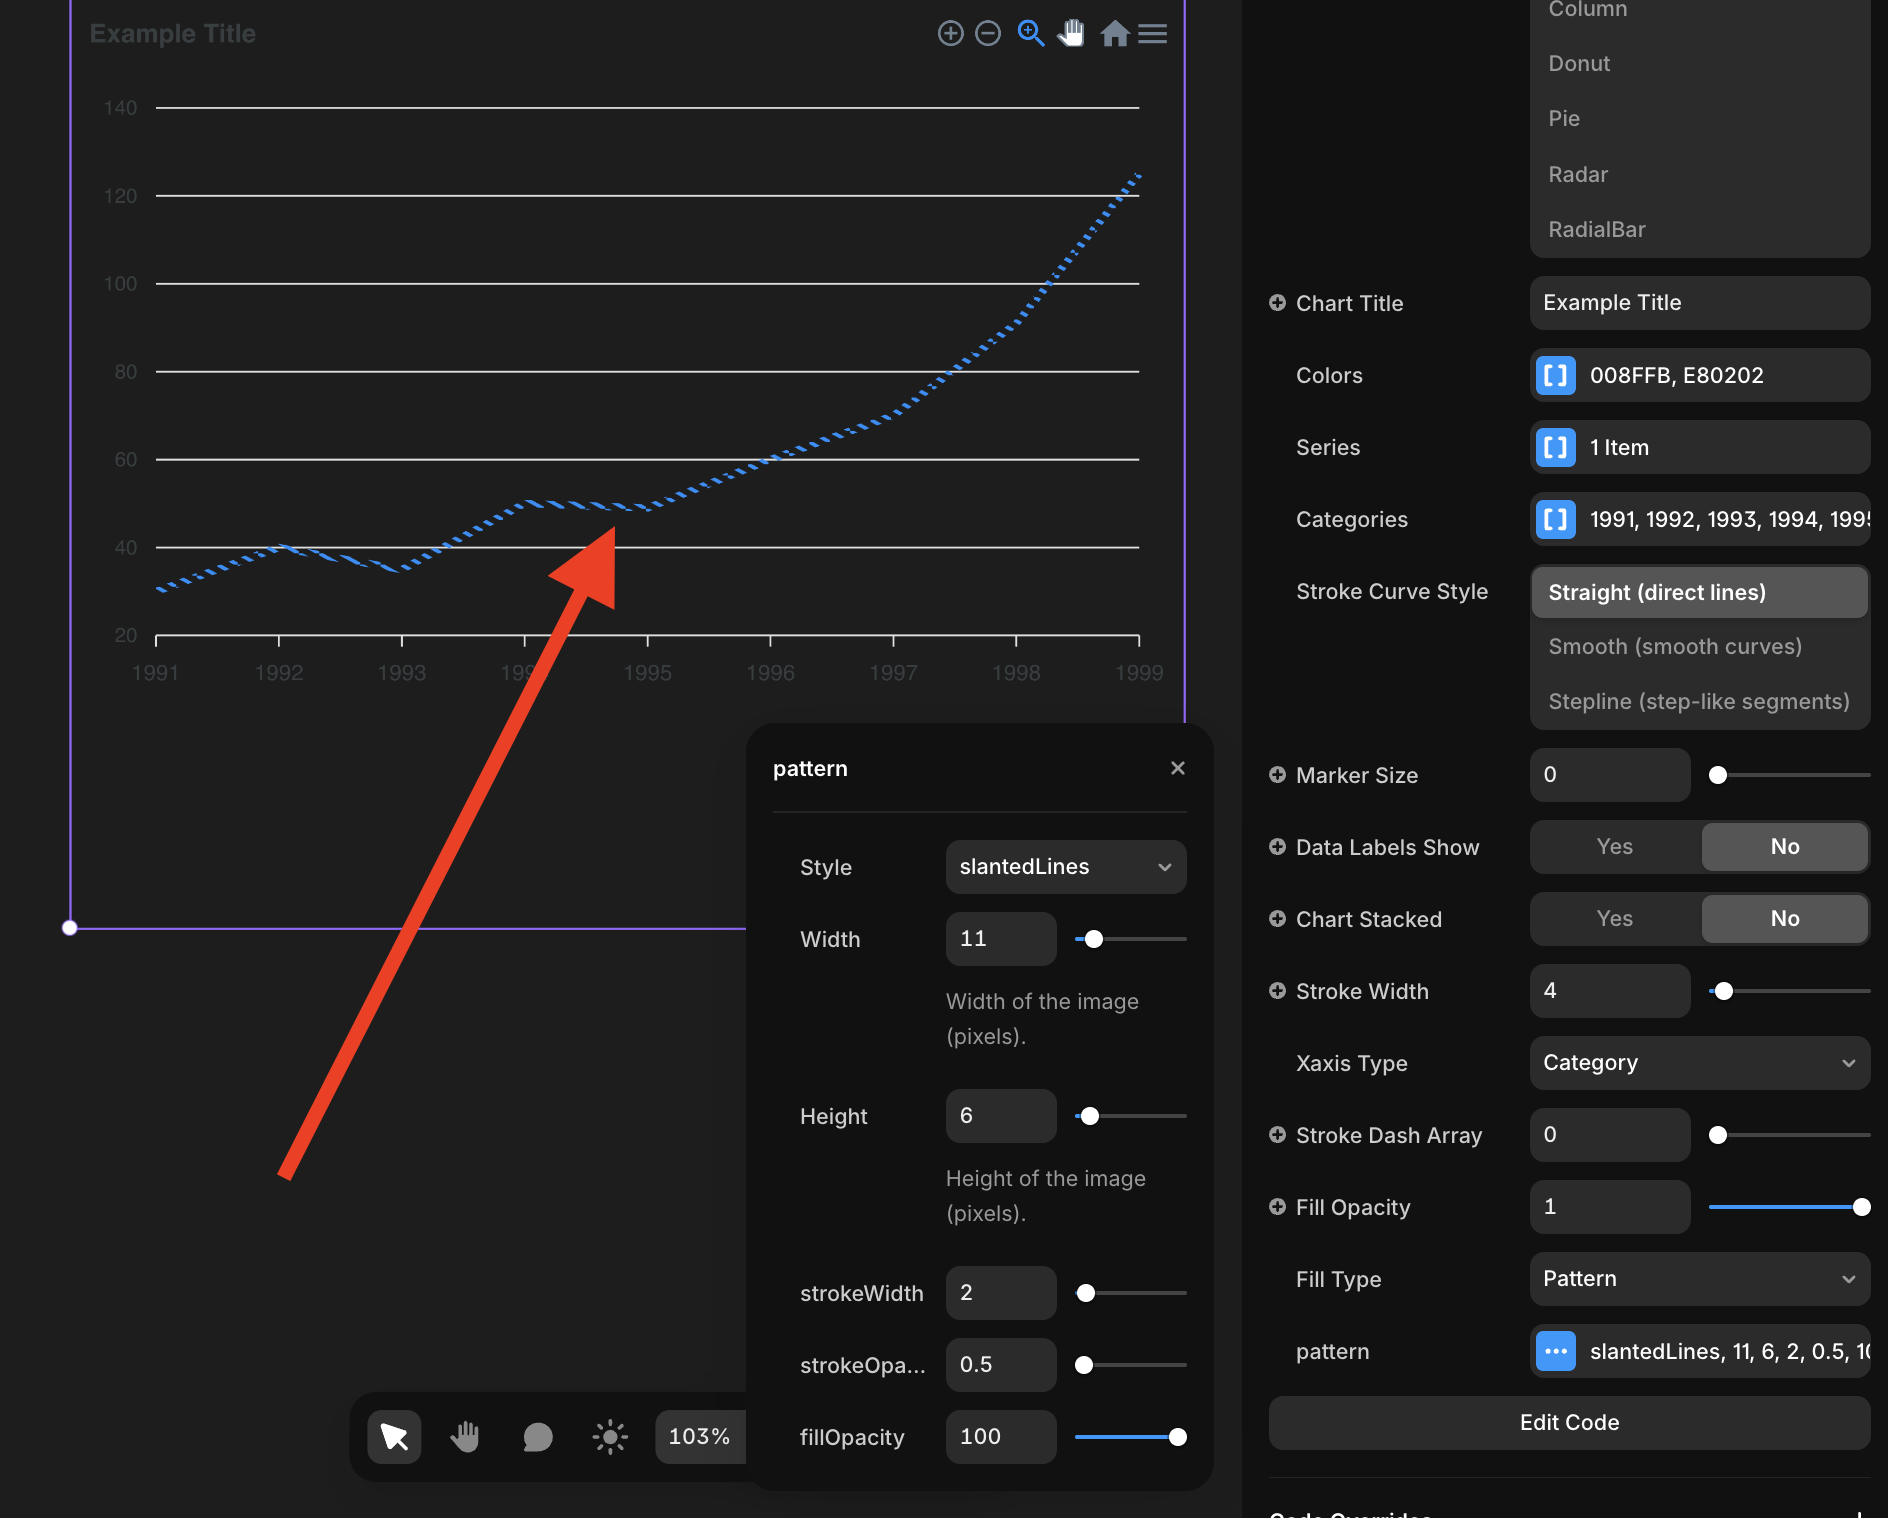
Parameters:
Title | Description | Type |
Style | Pattern style to use | Enum (verticalLines, slantedLines, horizontalLines, squares, circles, dots) |
Width | Width of the pattern elements in pixels | Number |
Height | Height of the pattern elements in pixels | Number |
StrokeWidth | Width of the pattern strokes | Number |
StrokeOpacity | Opacity of the pattern strokes | Number (0-1) |
FillOpacity | Opacity of the pattern fill | Number (0-1) |
Fill Image Properties
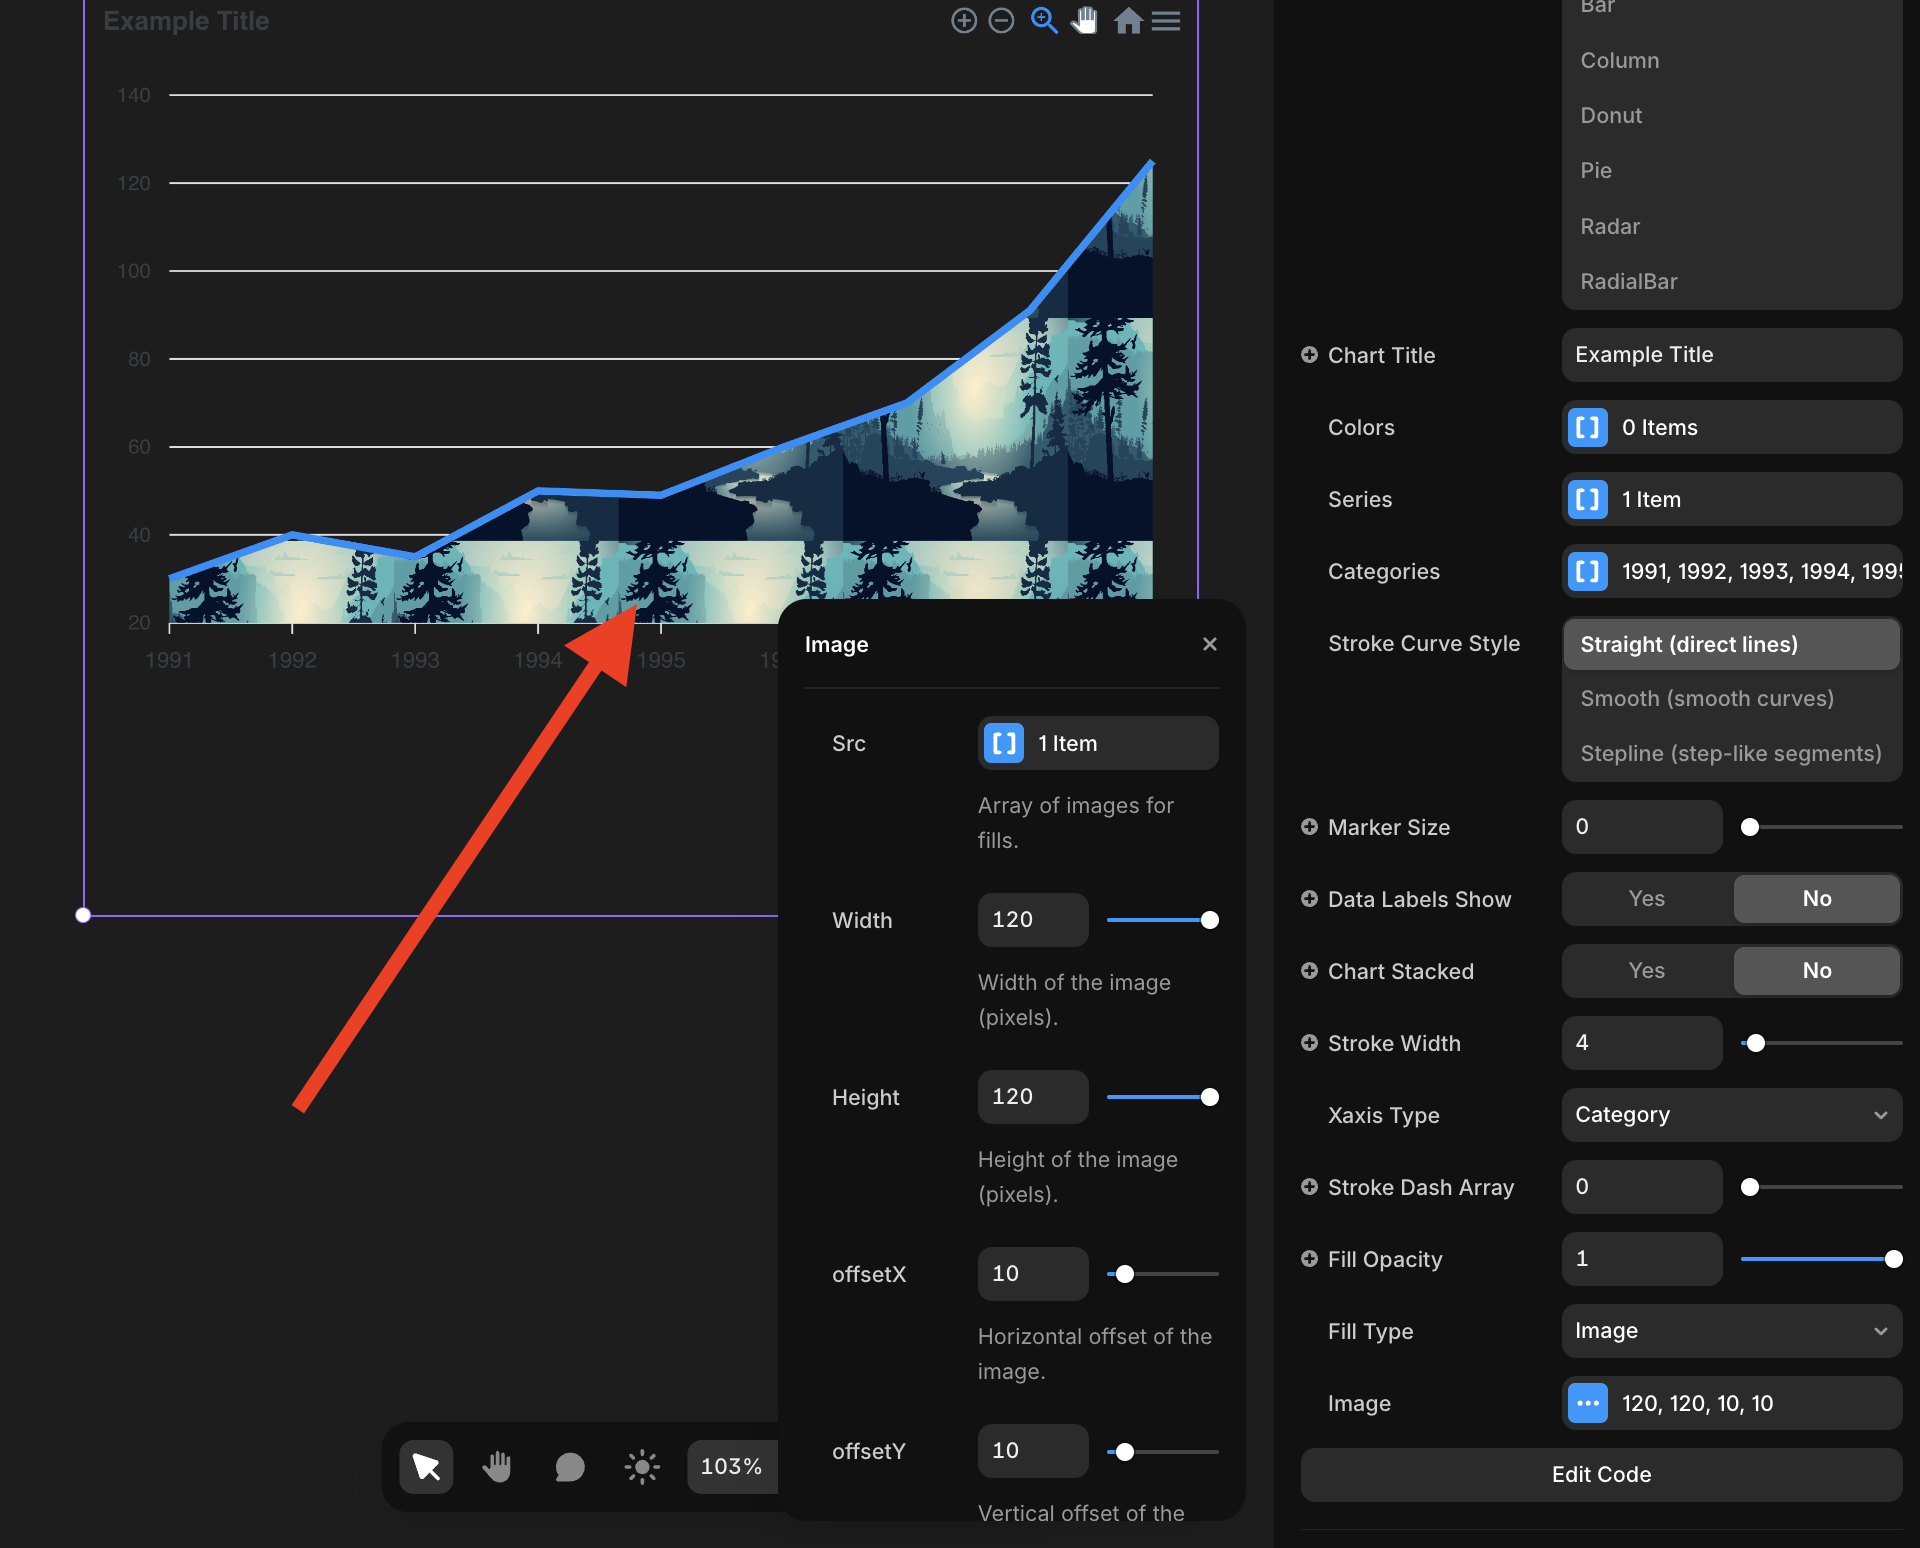
Parameters:
Title | Description | Type |
Src | Source images for fills | Array of Images |
Width | Width of the image in pixels | Number |
Height | Height of the image in pixels | Number |
OffsetX | Horizontal offset of the image | Number |
OffsetY | Vertical offset of the image | Number |
All types of charts