Demo to preview the settings
Introduction
Visualize geographic data effortlessly with the World / Geo Map Chart plugin for your Bubble app. This plugin offers a fully customizable, interactive map chart, allowing you to display world or region-specific data in an intuitive and engaging format. Ideal for visualizing everything from global trends to country-specific metrics, this plugin enhances your app by adding a powerful visual representation of geographical information.
Seamlessly integrate the World / Geo Map Chart element to display data points and customize the look and feel with adjustable settings like color schemes, regions, and markers. Whether you're building dashboards or analytics tools, this plugin provides key states and actions to interact with map elements, ensuring dynamic and responsive maps.
Trigger workflows based on map interactions and data updates, adding flexibility to your application and boosting user engagement with real-time geographic insights. Perfect for apps that require data-driven decisions based on location-based information.

How to setup
- Install World Map & Geo Chart Graph plugin

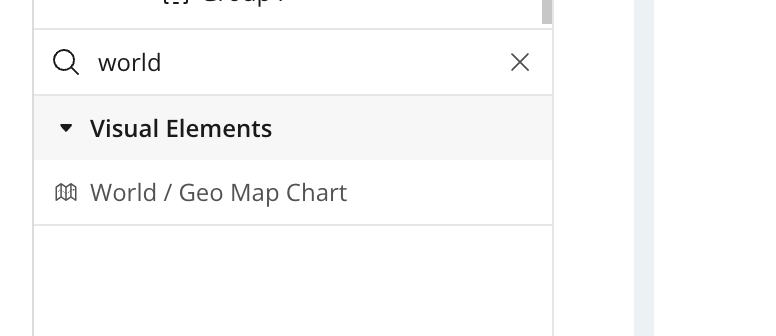
- Place the World / Geo Map Chart element on the page

Plugin Element Properties


Title | Description | Type |
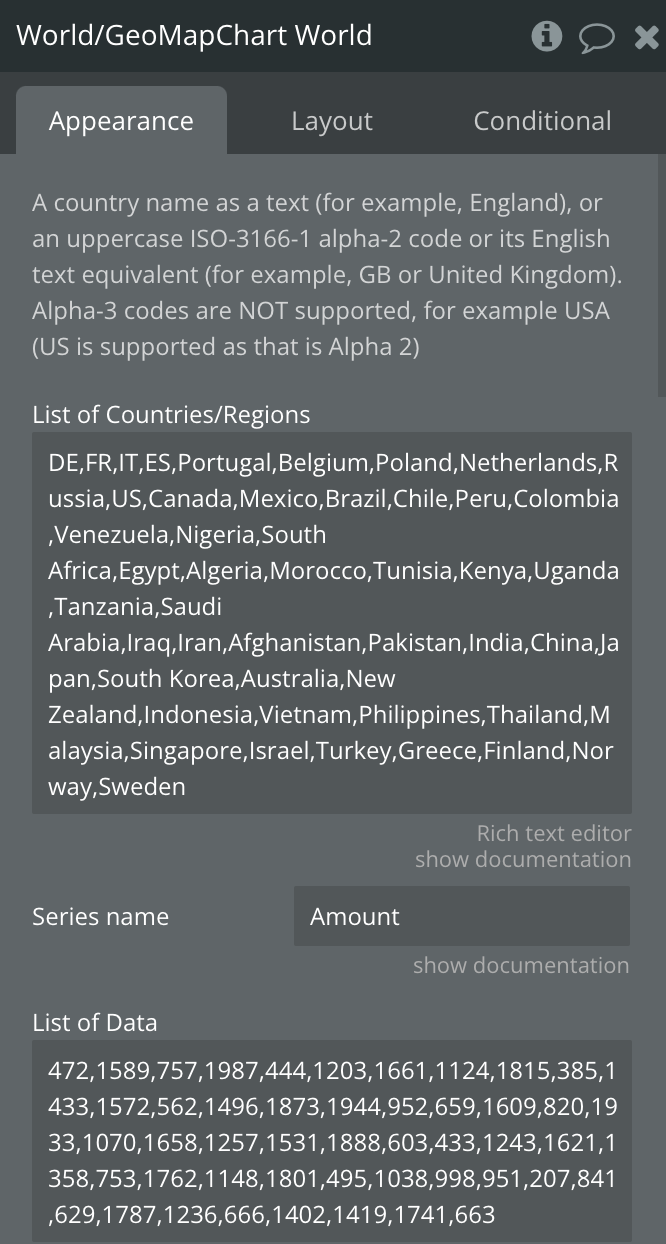
List of Countries/Regions | Comma-separated Country/Region data can be provided as text, including a country name (for example, "England"), an uppercase ISO-3166-1 alpha-2 code or its English text equivalent (for example, "GB" or "United Kingdom"), an uppercase ISO-3166-2 region code name or its English text equivalent (for example, "US-NJ" or "New Jersey"), or a DMA (Designated Market Area) code. These are three-digit DMA codes used to designate various regions within the US only. Please note that these are not the same as telephone area codes. | Text, Required |
Series name | The name of the data series for on the tooltip. | Text, Required |
List of Data | Comma separated Data (Numbers). Make this list has the same size as the List of Countries as they need to match up and vice versa. | Text, Required |
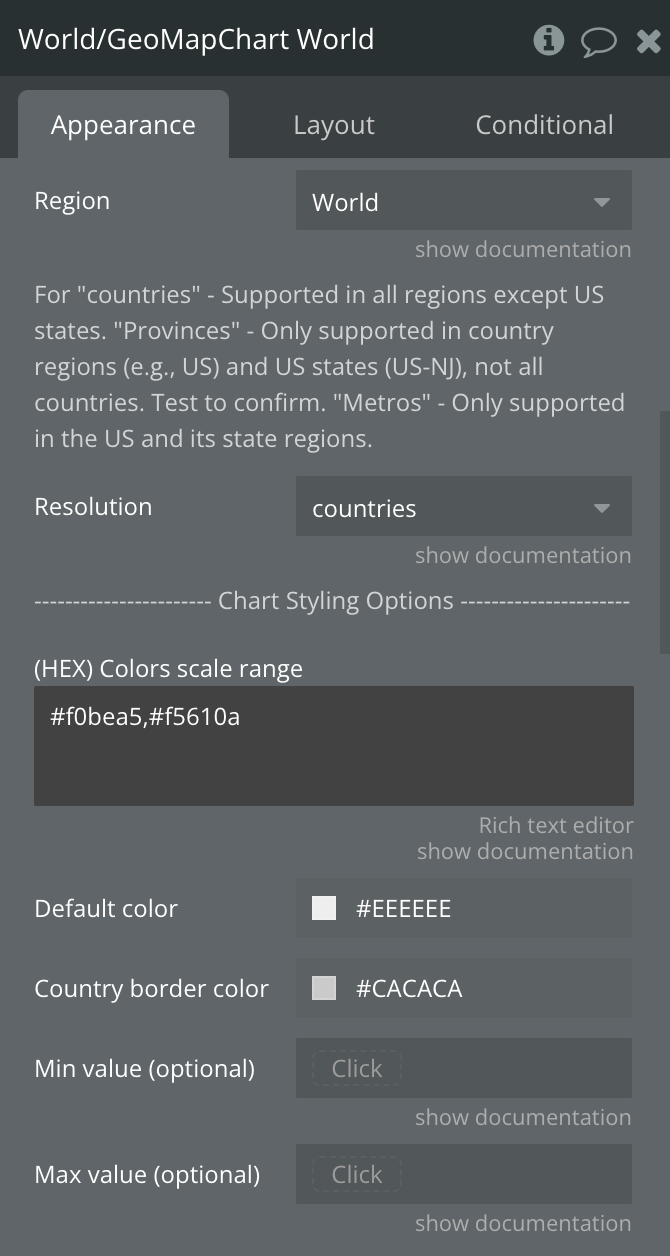
Region | Countries outside of the region will not be colored. For example, when selecting 'Americas' countries in Europe will not be colored | Dropdown |
Resolution | 'countries' - Supported for all regions, except for US state regions. 'provinces' - Supported only for country regions (like region: US) and US state regions. Not supported for all countries; please test a country to see whether this option is supported. 'metros' - Supported for the US country region and US state regions only. 'metros' - Supported for the US country region and US state regions only. Uses DMA (Designated Market Area) codes | Dropdown |
(HEX) Colors scale range | A list of HEX colors used for the chart. | Text, Required |
Default color | Background Color | Color |
Country border color | Country border color | Color |
Min value (optional) | If present, specifies a minimum value for chart color data. Color data values of this value and lower will be rendered as the first color in the Colors range. | Number, Optional |
Max value (optional) | If present, specifies a maximum value for chart color data. Color data values of this value and higher will be rendered as the last color in the Colors range. | Number, Optional |
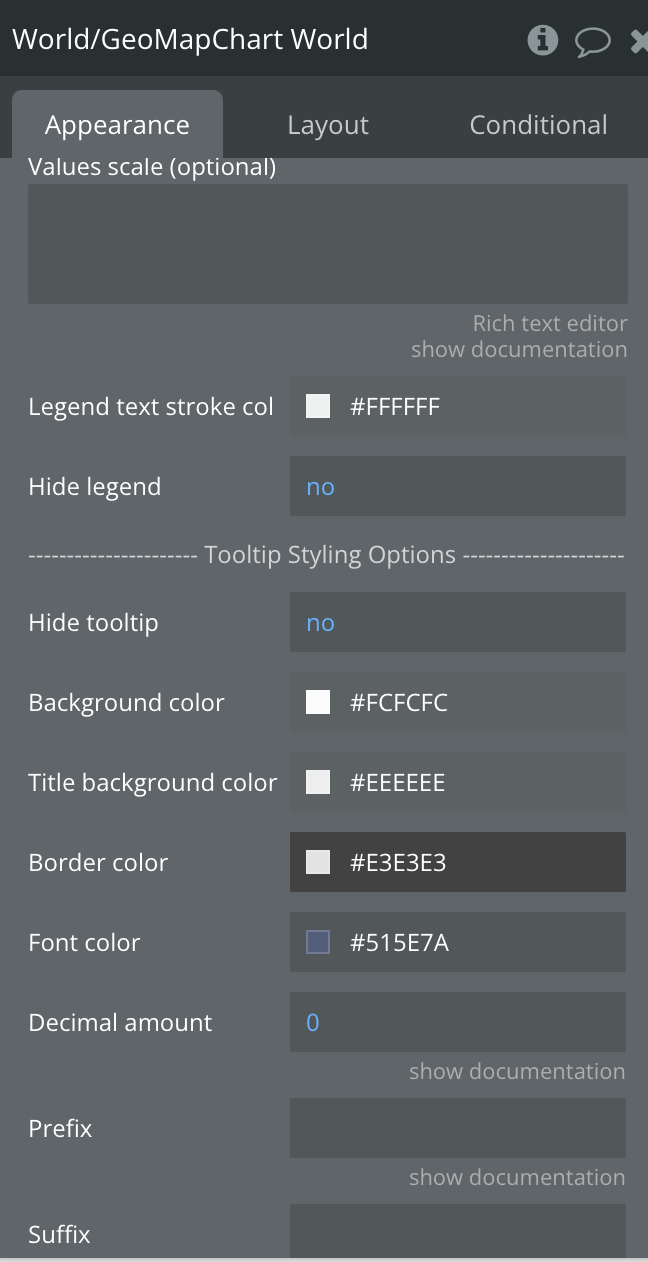
Values scale (optional) | Comma separated numbers. Needs to be same length as Color Scale Range! If present, controls how values are associated with colors. Each value is associated with the corresponding color in the Colors array. These values apply to the chart color data. Coloring is done according to a gradient of the values specified here. Not specifying a value for this option is equivalent to specifying Min value and Max value. | Text, Optional |
Legend text stroke color | Legend text stroke color | Color |
Hide legend | Hide legend | Yes/No, Required |
Hide tooltip | Displays/Hides Tooltips | Yes/No, Required |
Background color | Background color of tooltip | Color |
Title background color | Title background color | Color |
Border color | Border color | Color |
Font color | Text Font color | Color |
Decimal amount | The decimal amount on the tooltip | Number, Required |
Prefix | The prefix on the tooltip | Text, Optional |
Suffix | The suffix on the tooltip | Text, Optional |
Do not refresh | Enables/Disables Refreshing of map | Yes/No, Required |
Exposed states
Title | Description | Type |
is loaded | Indicates wether the map is loaded | Yes/No |
Clicked index | Indicates the clicked index | Number |
Clicked country value | Indicates the value of the clicked country | Text |
Clicked data value | Indicates the value of the clicked data | Number |
Element events
Title | Description |
Country with data is clicked | Triggers when a country that has data is clicked |
Element actions
Re-Render

