Demo to preview the plugin:
Introduction
Try this no-code tool that converts lists into dynamic bar charts, eliminating the need for complex column setups. With this plugin, you can easily add numbers and create bar charts.

How to setup
- Place the Bar Chart Element on Your Page
- Go to the Design tab in Bubble.
- Search for Bar Chart in the Visual Elements panel.
- Drag and drop the element into your page where you want the chart to appear.
- Configure the Bar Chart
- Enter values for the bars.
- Define colors to customize each bar.
- Add labels for the bars.
- Choose the chart orientation (vertical or horizontal).
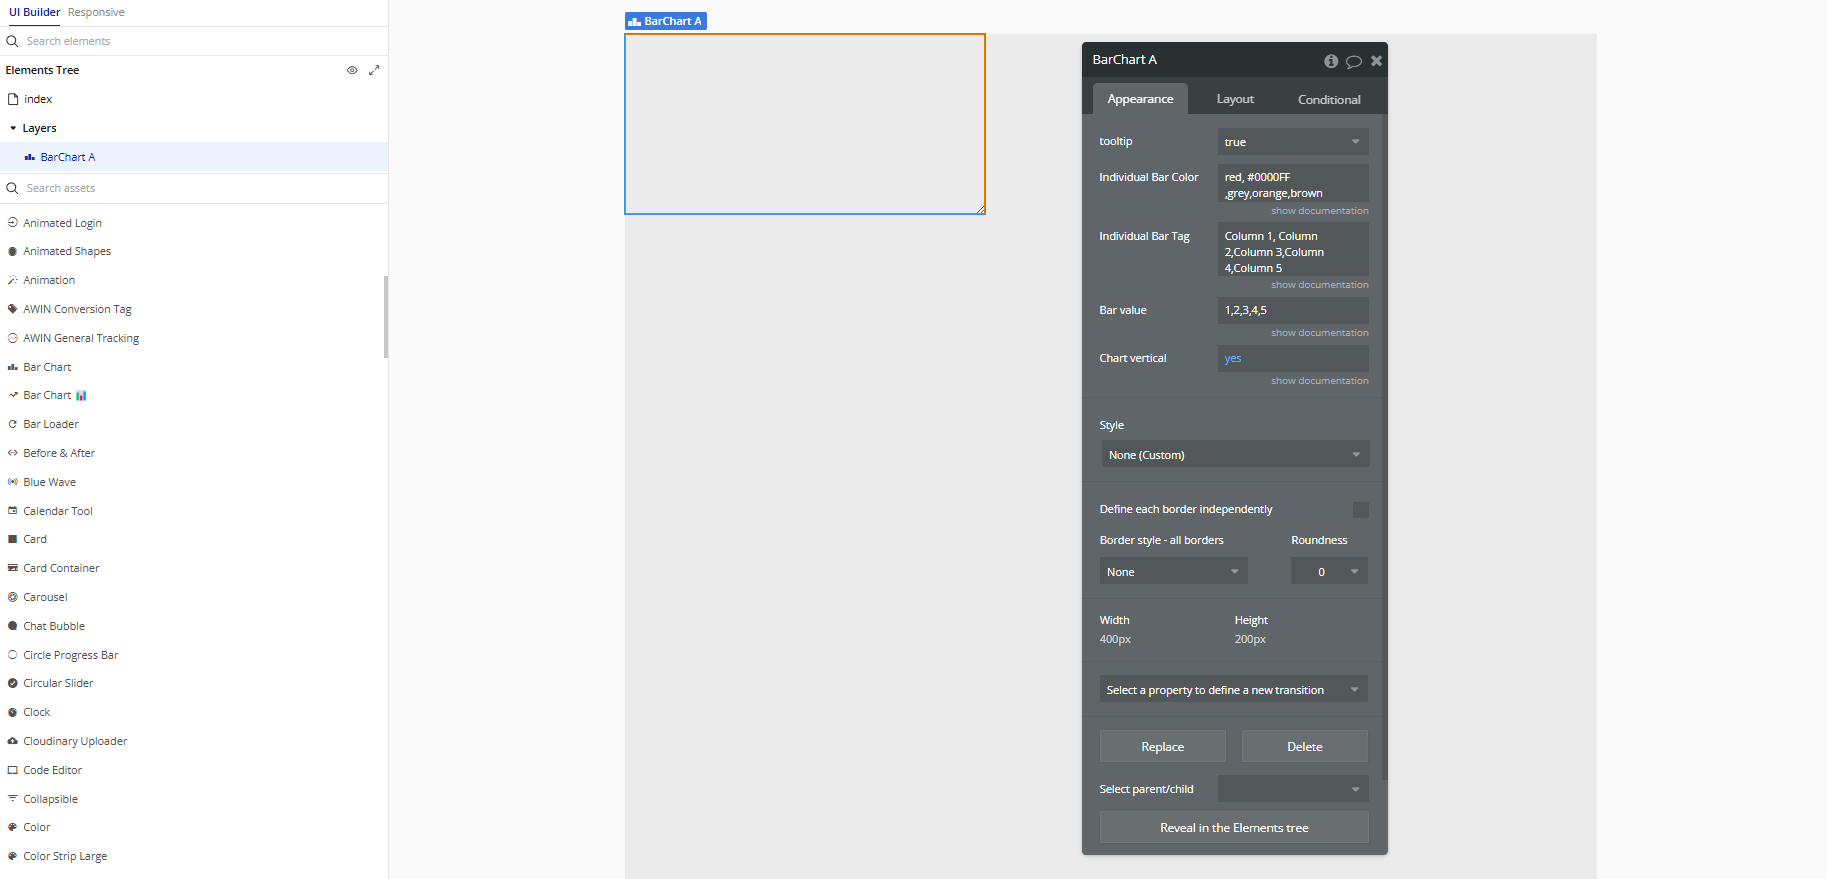
Click on the Bar Chart element on your page, and set up its properties:
Plugin Element Properties
Bar Chart
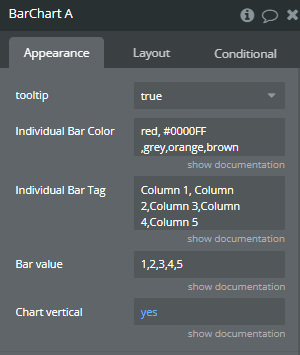
Fields:
Title | Description | Type |
Tooltip | Available options: true, false | Dropdown (optional) |
Individual Bar Color | Seperate by comma in order matchin with value and tags. Example: red, #0000FF,grey,orange,brown | Text |
Individual Bar Tag | Seperate by comma in order matchin with value and tags. Example: Column 1, Column 2,Column 3,Column 4,Column 5 | Text |
Bar value | Seperate by comma in order matchin with value and tags. Example: 1, 2,3,4,5 | Text |
Chart vertical | Switch between vertical and horizontal bars. | Checkbox (yes/no) |