
Link to the plugin page: https://zeroqode.com/plugin/1533644008840x399038893660569600
Demo to preview the plugin:
Introduction
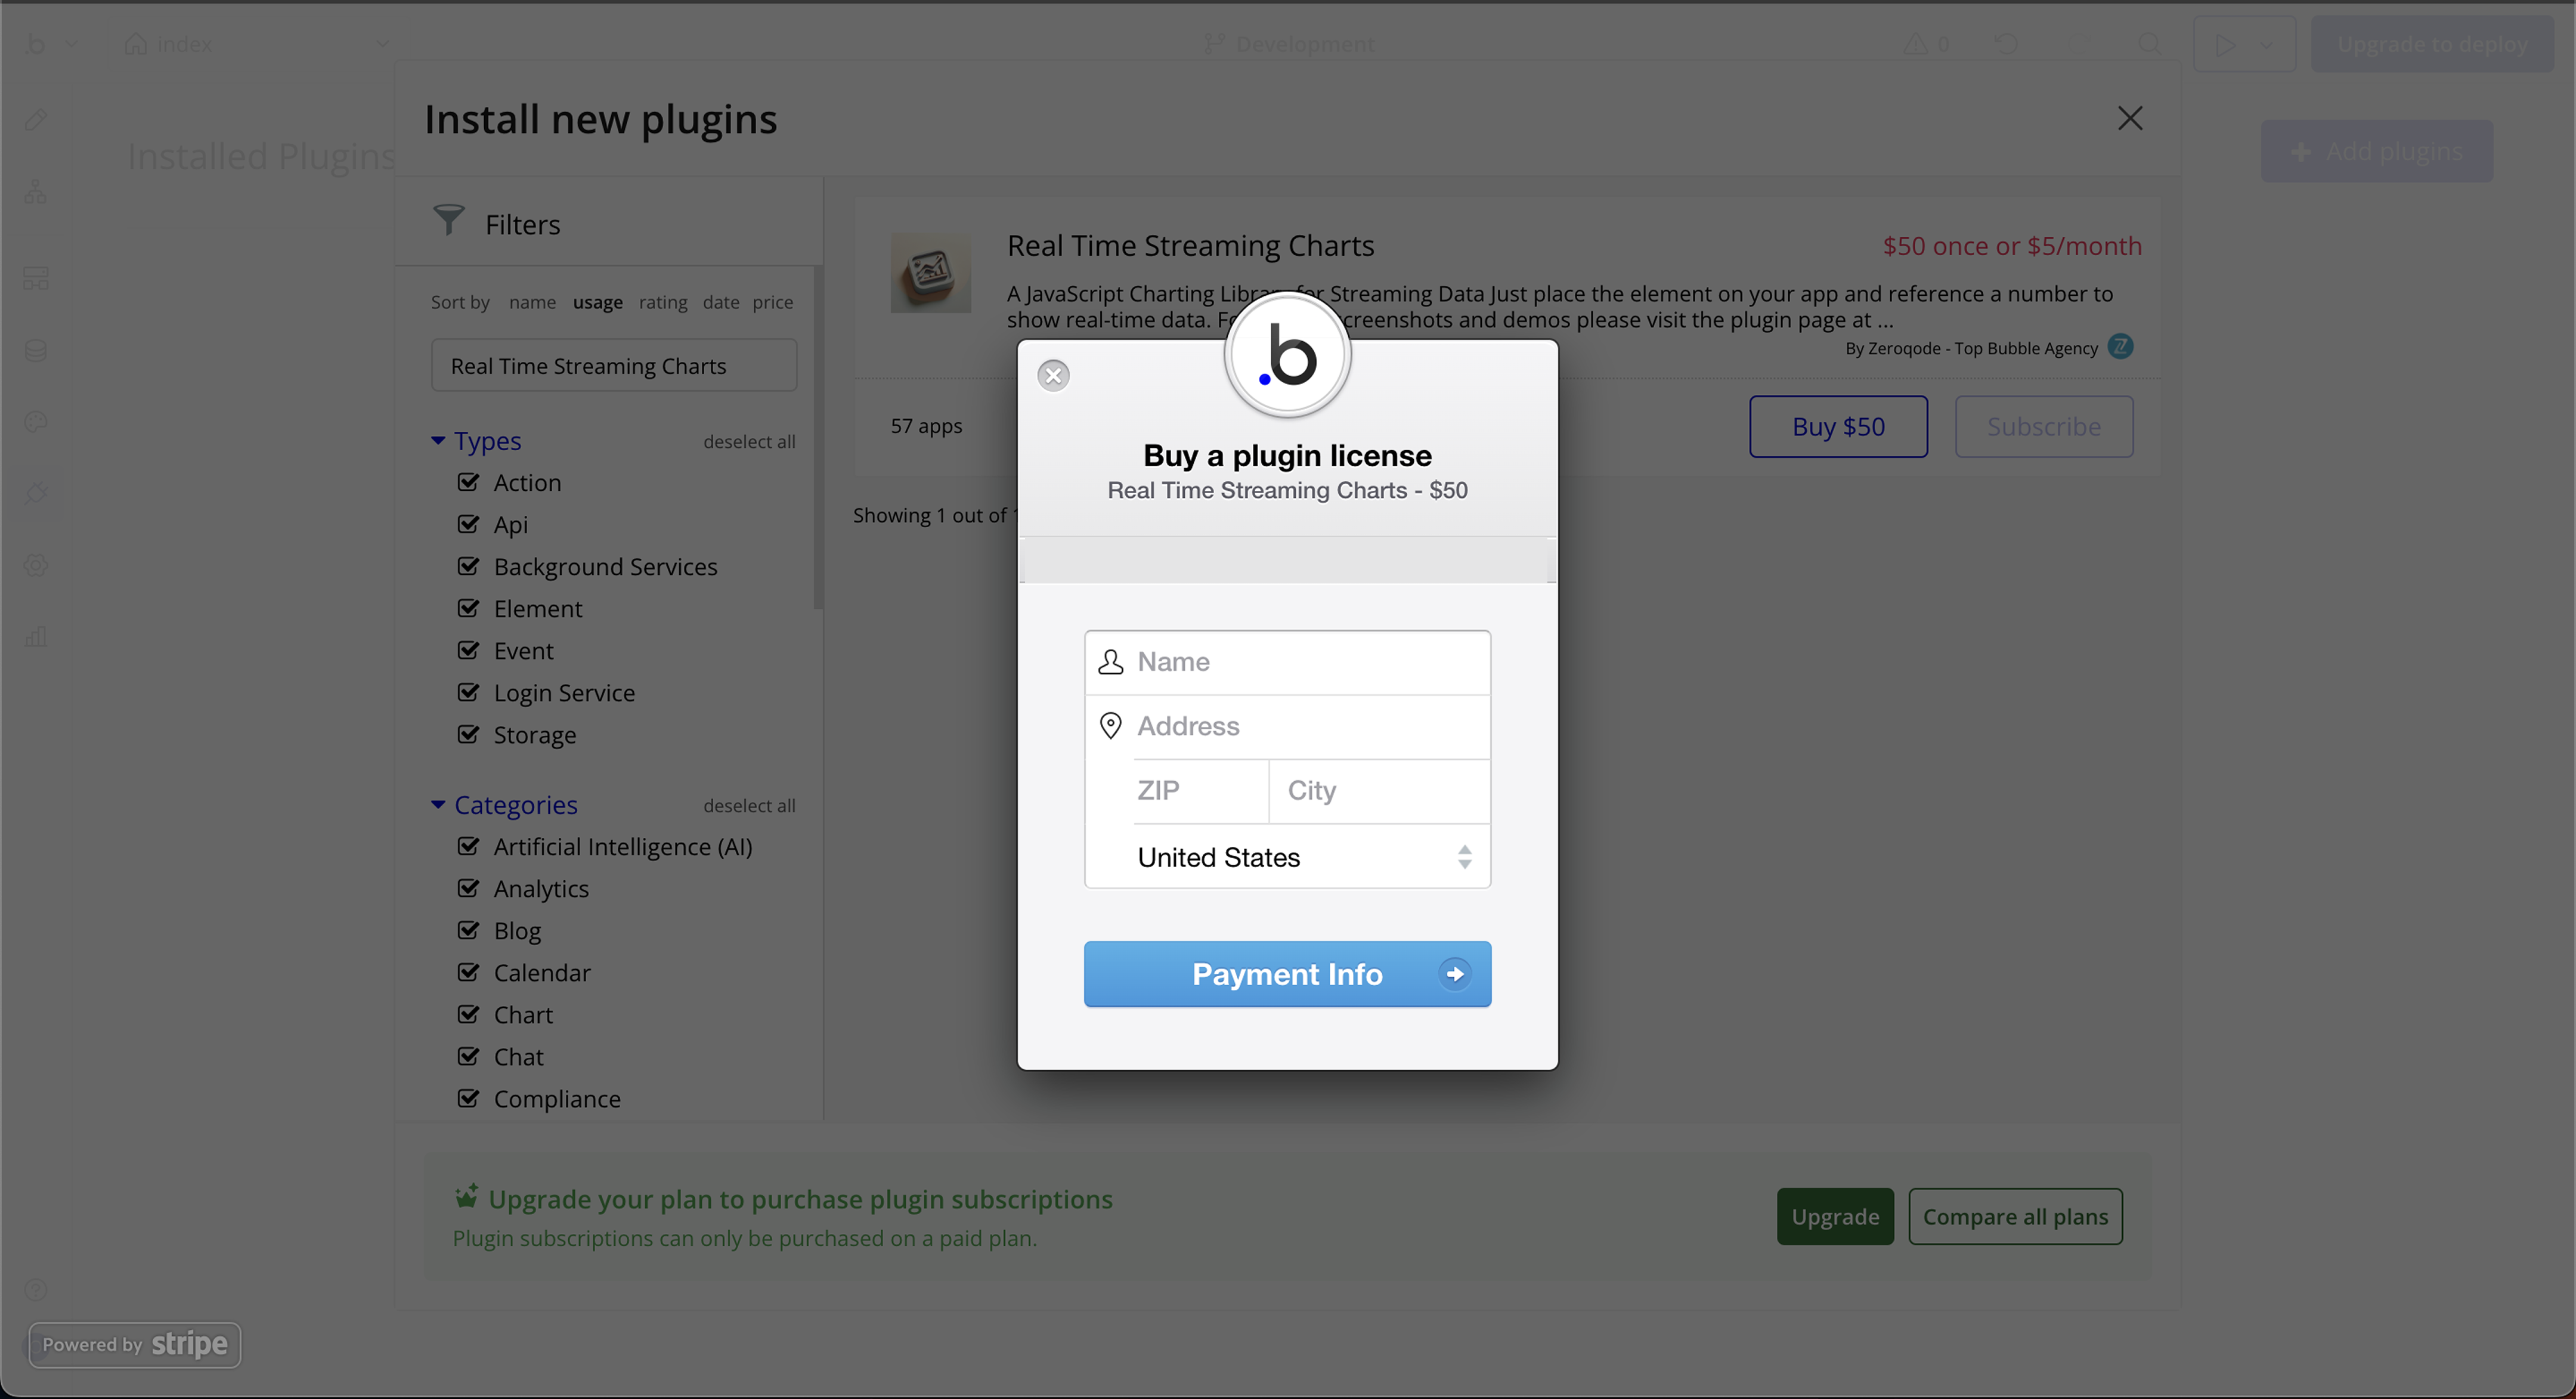
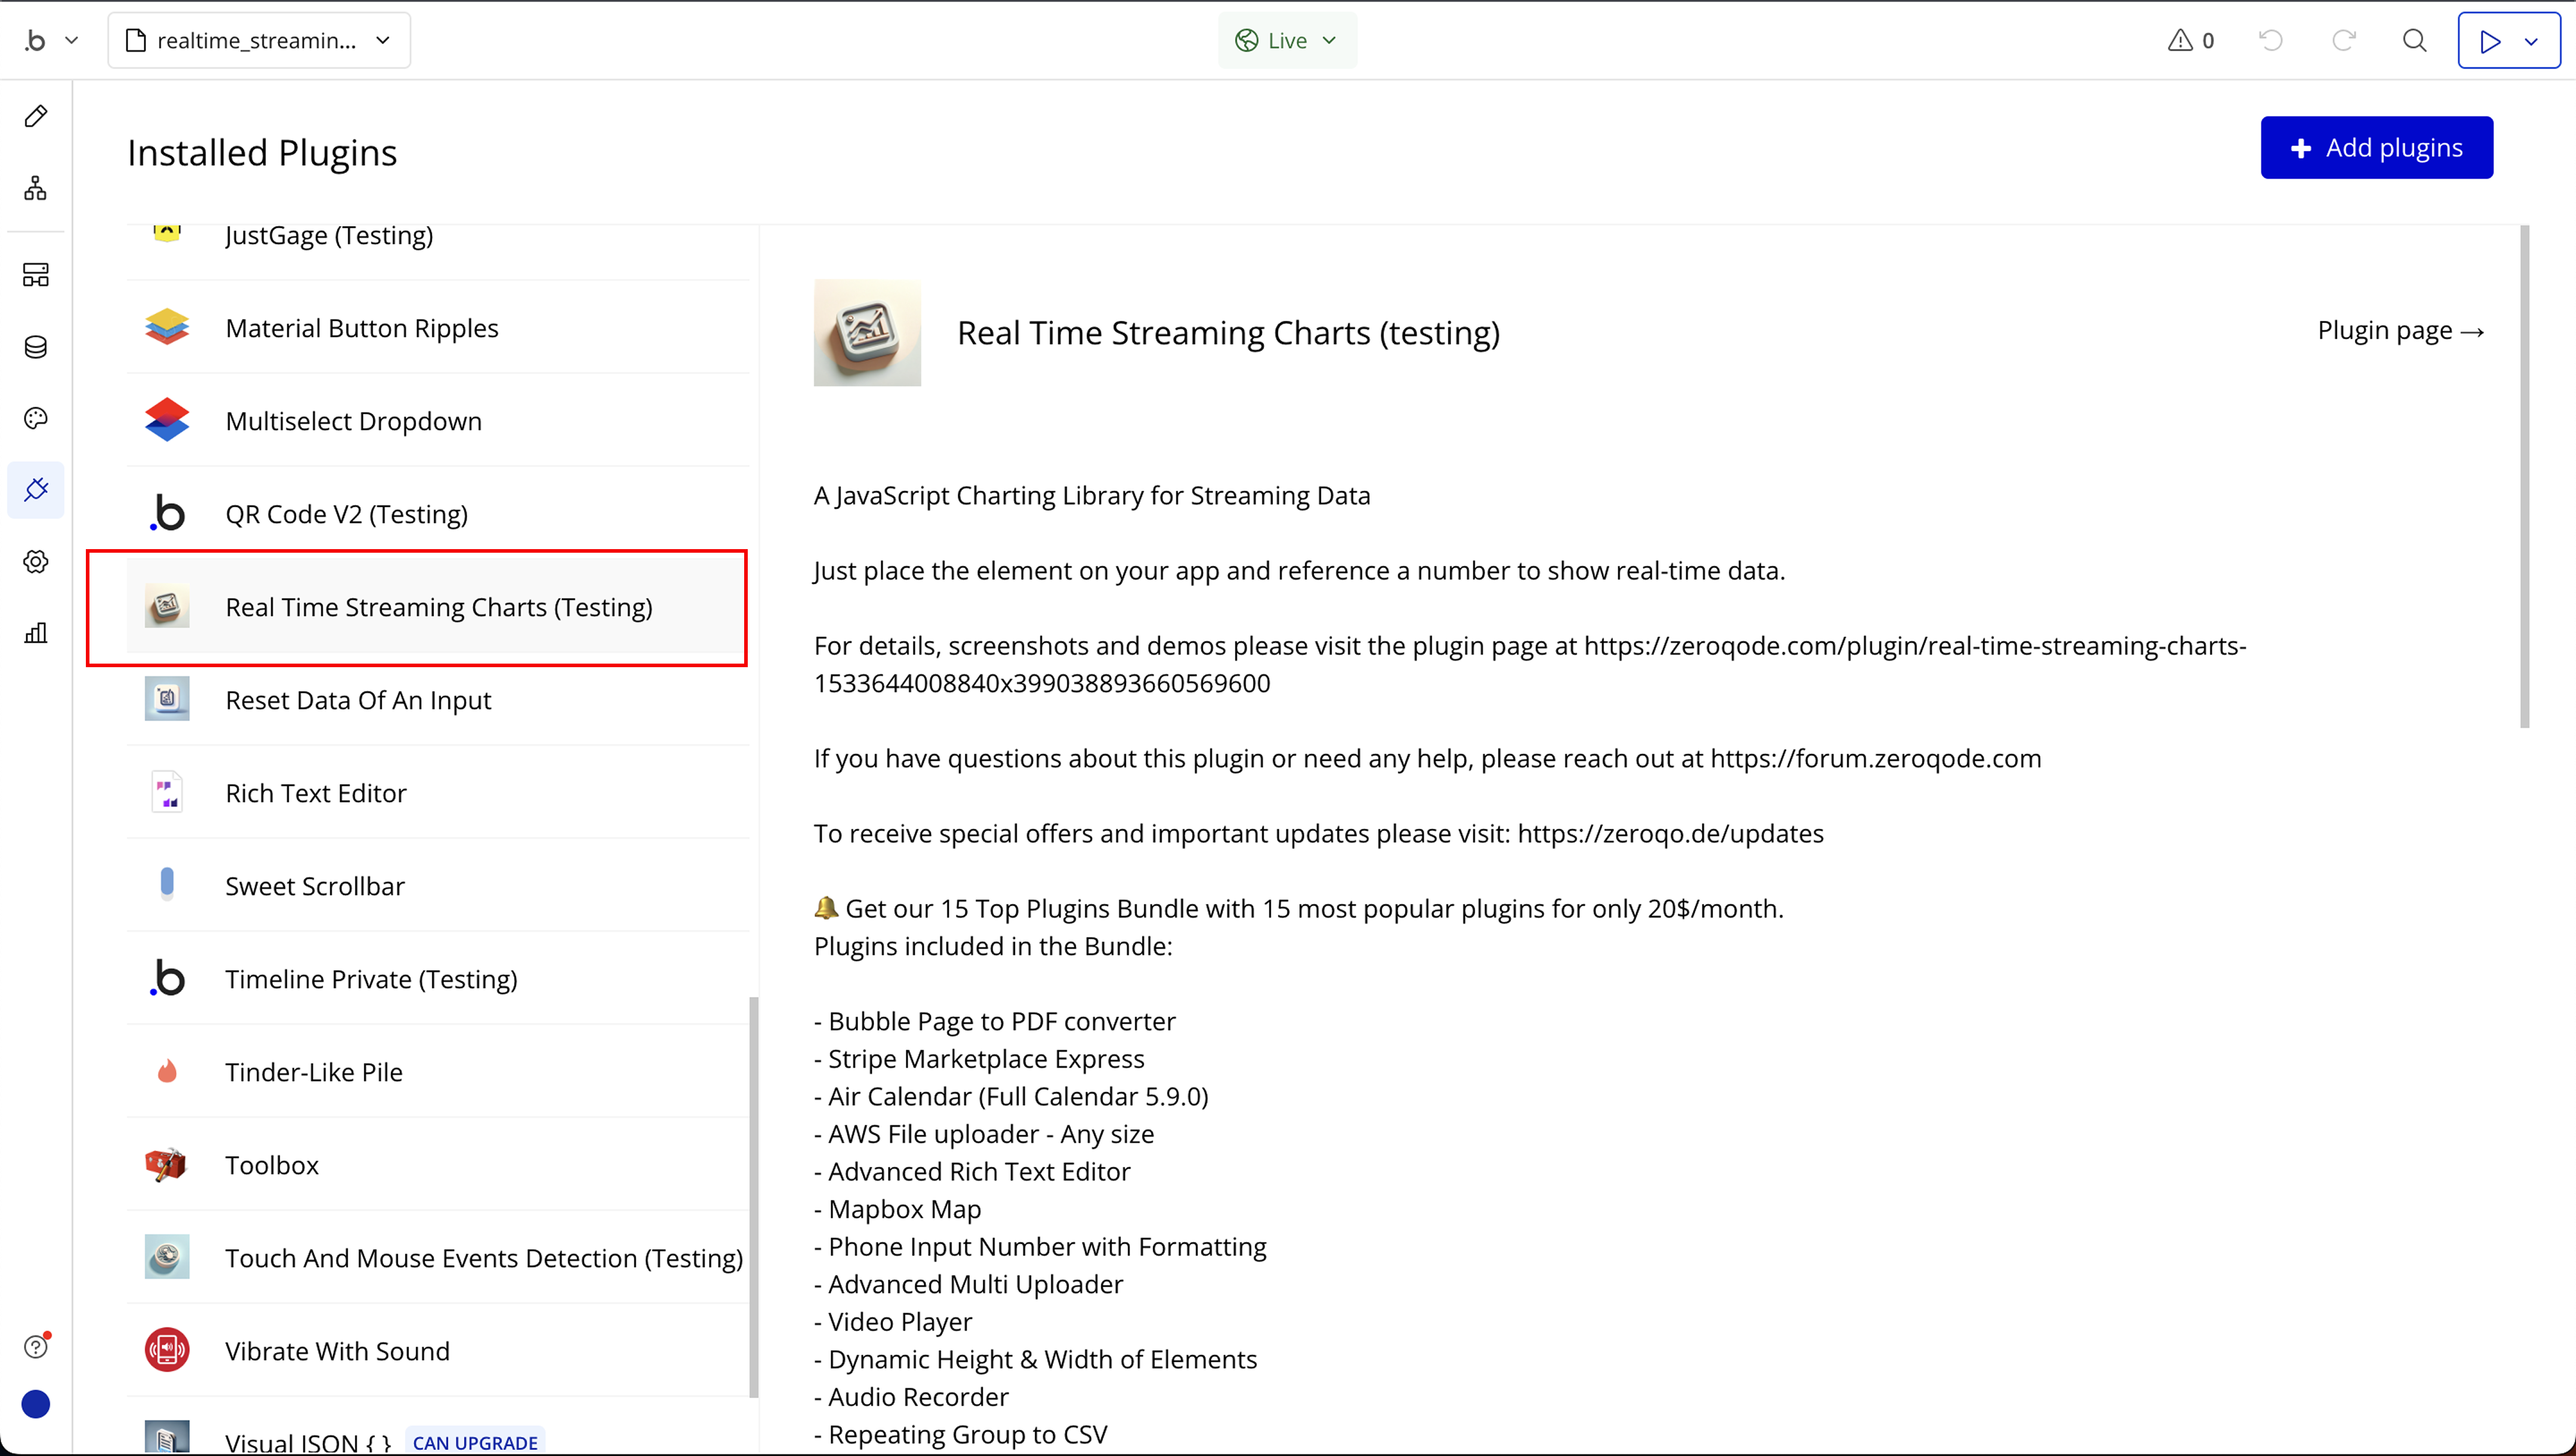
A no-code solution for displaying live-streaming data using sleek, customizable charts. Simply place the element on your app and reference a number to show the real-time data.
Key Features
Prerequisite
- Bubble Account: An active Bubble.io account is required to install and use the plugin.
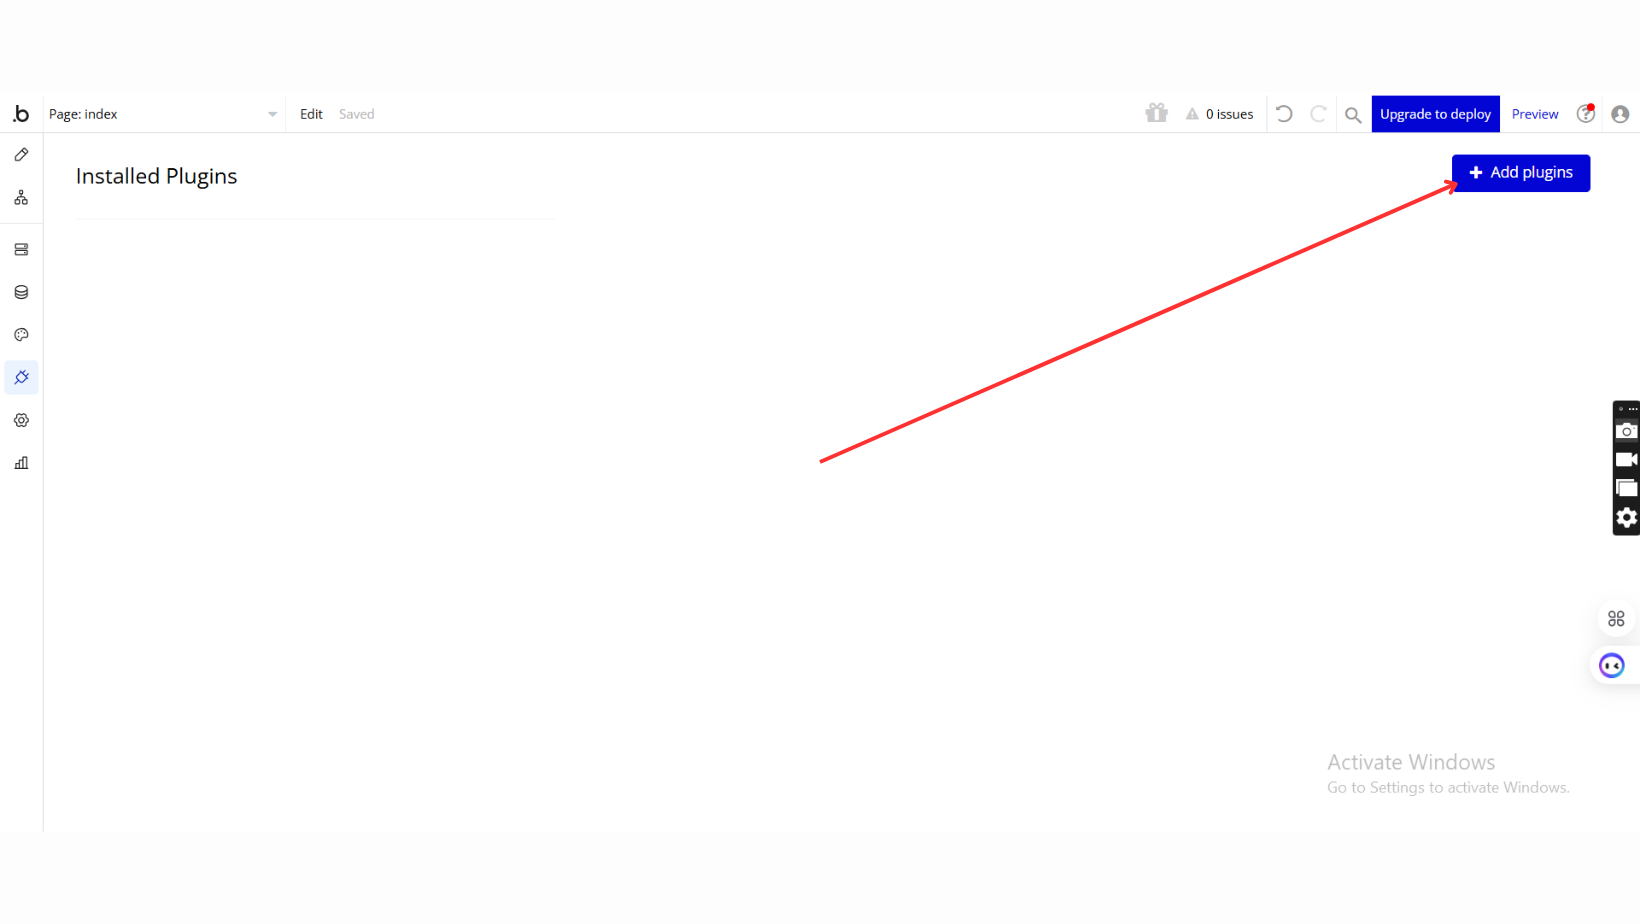
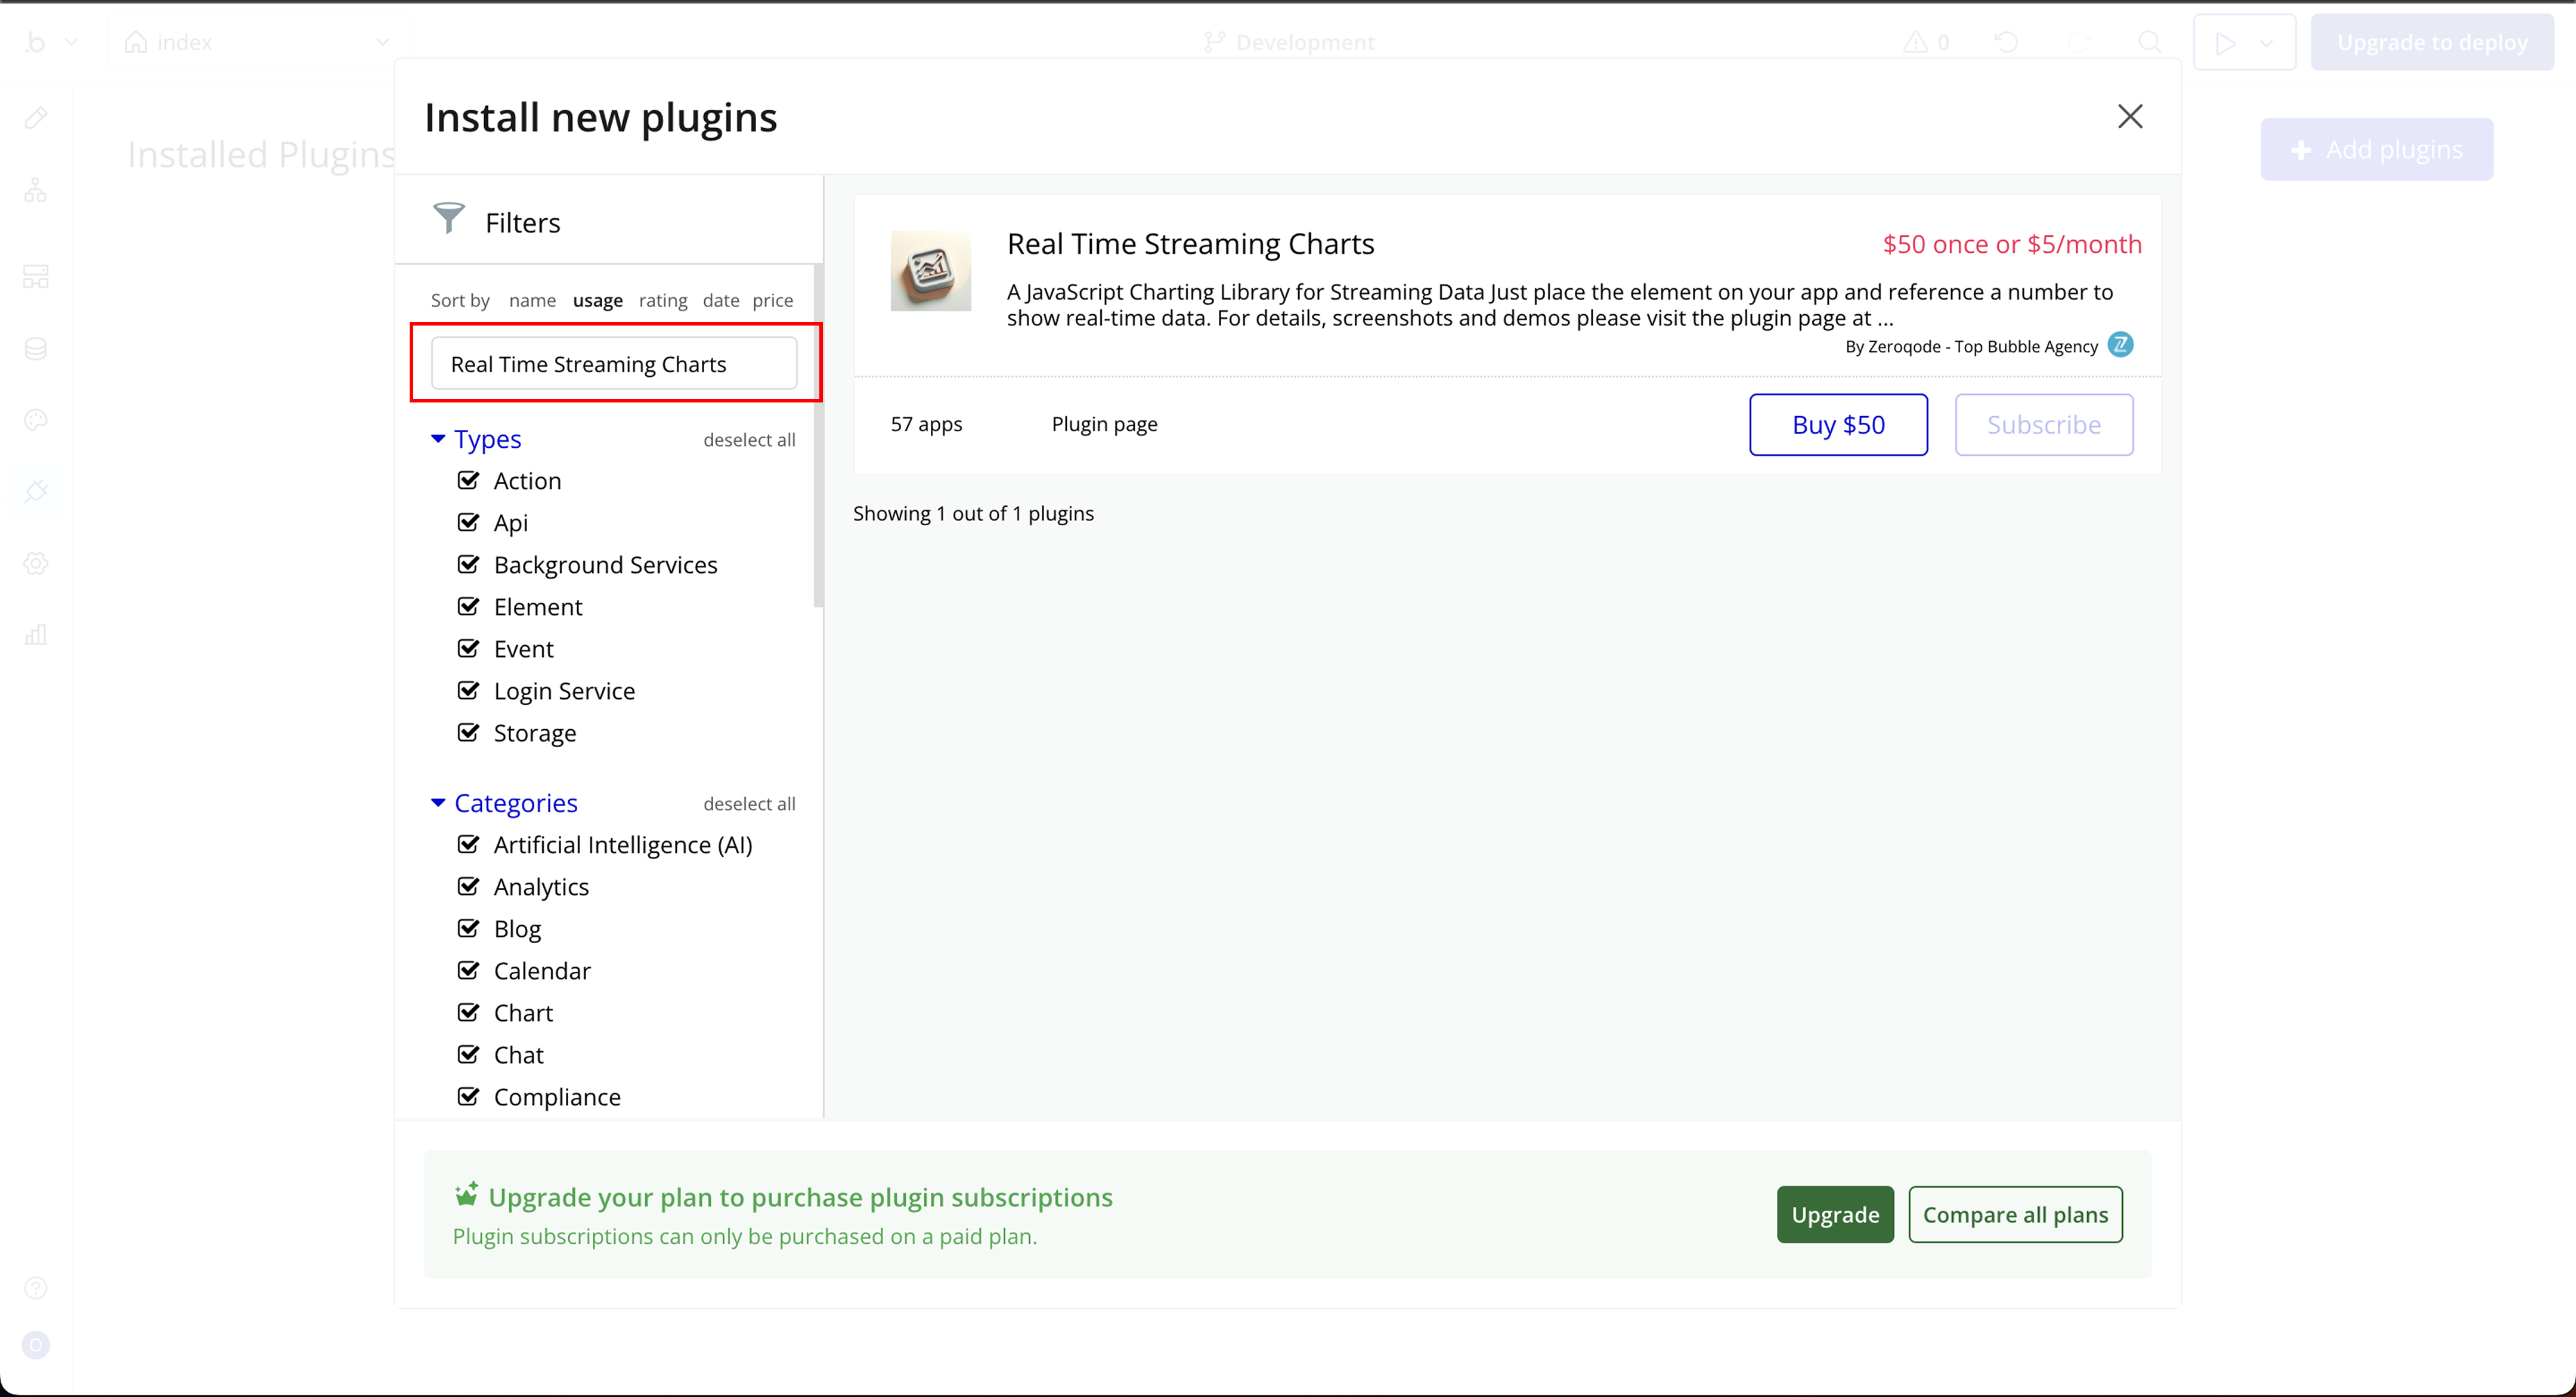
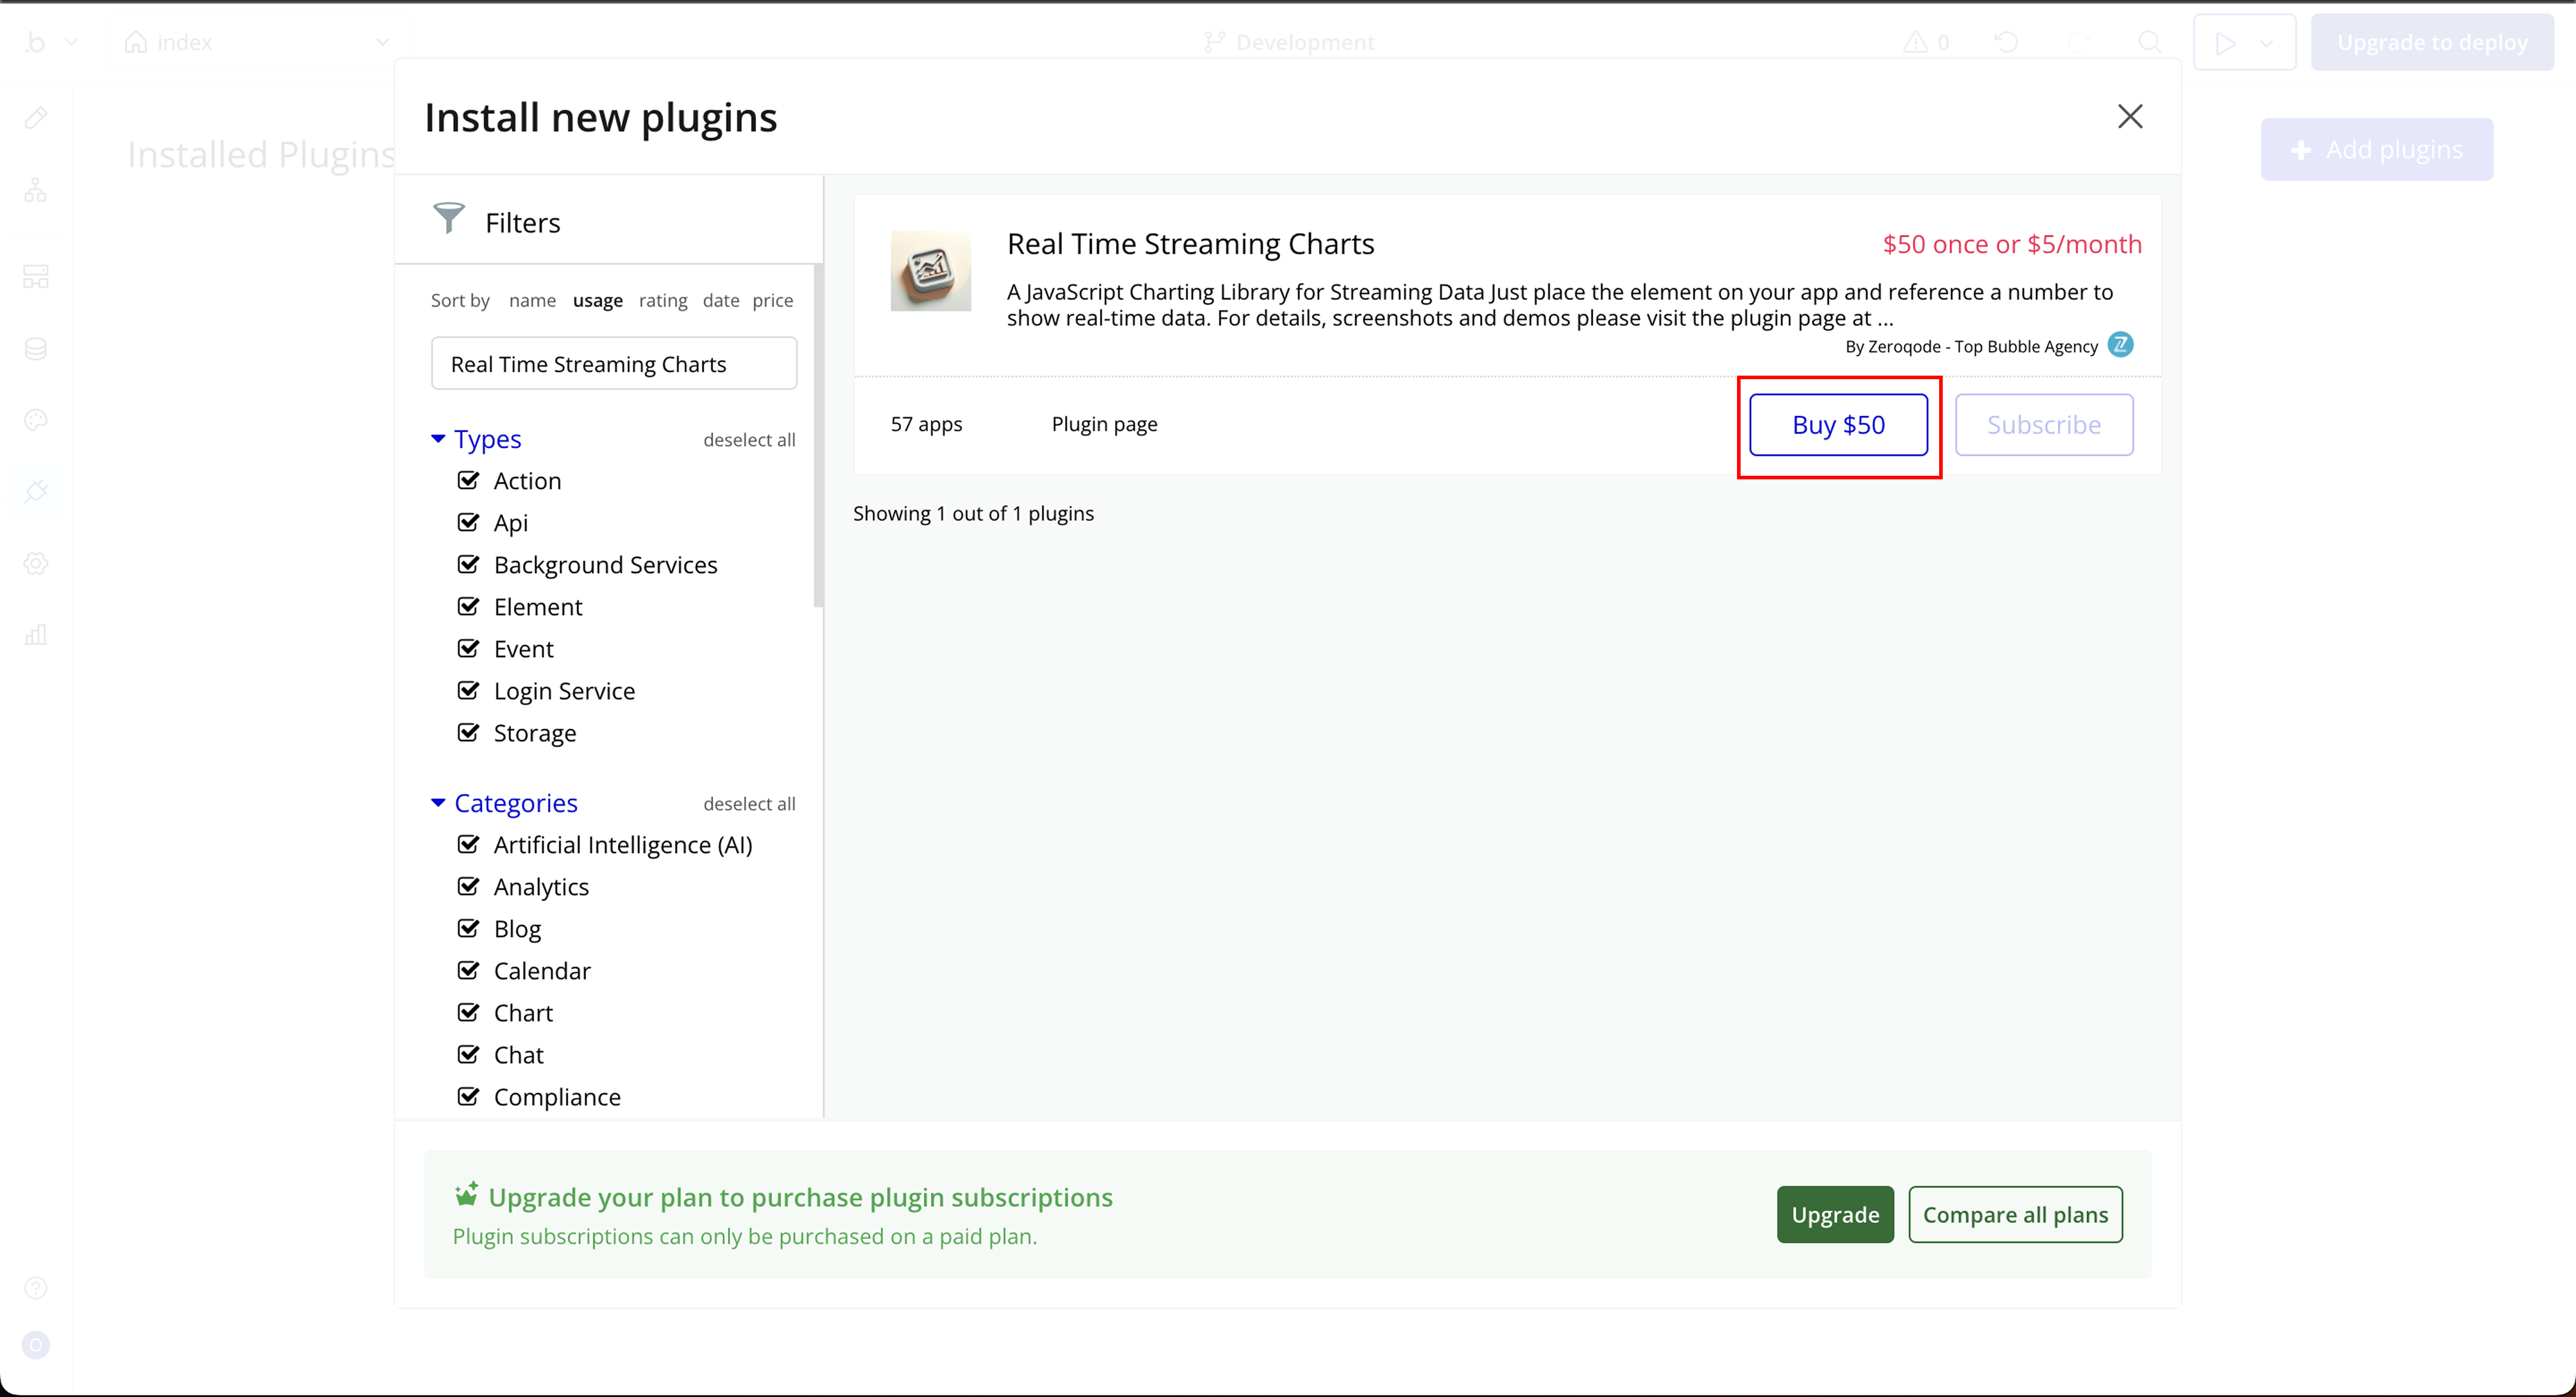
- Plugin Installation: The plugin can be installed directly from the Zeroqode Plugin Store or from the Plugins section of your Bubble Editor.
- Familiarity with Bubble Workflows: Basic knowledge of Bubble workflows is required to dynamically control progress values and actions.

How to setup
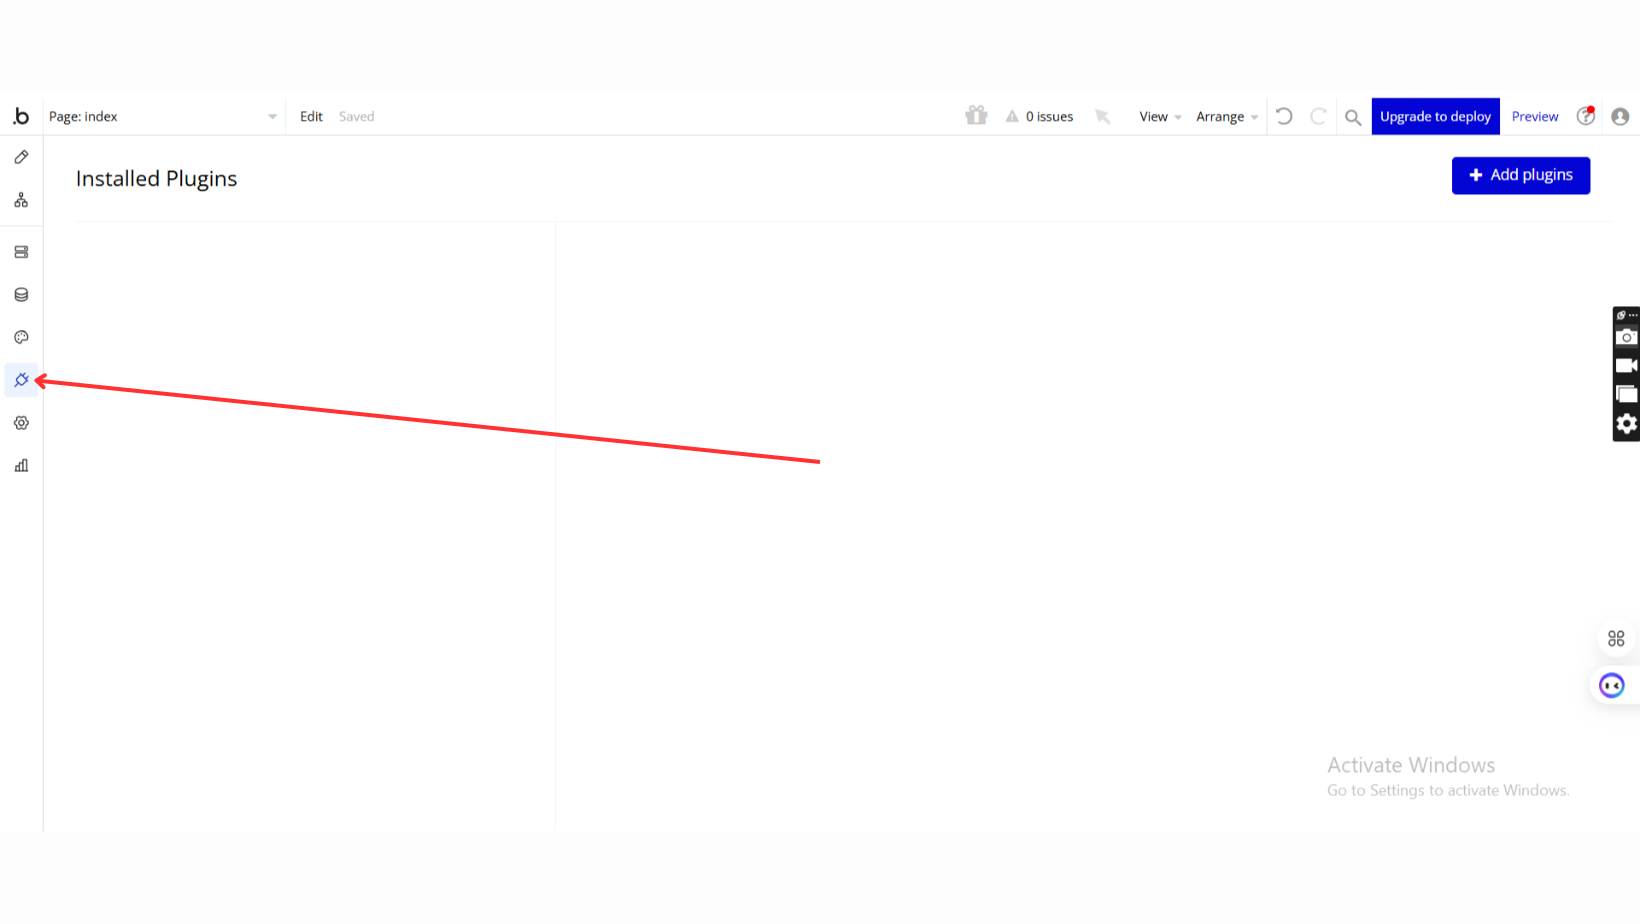
Step 1: Installation
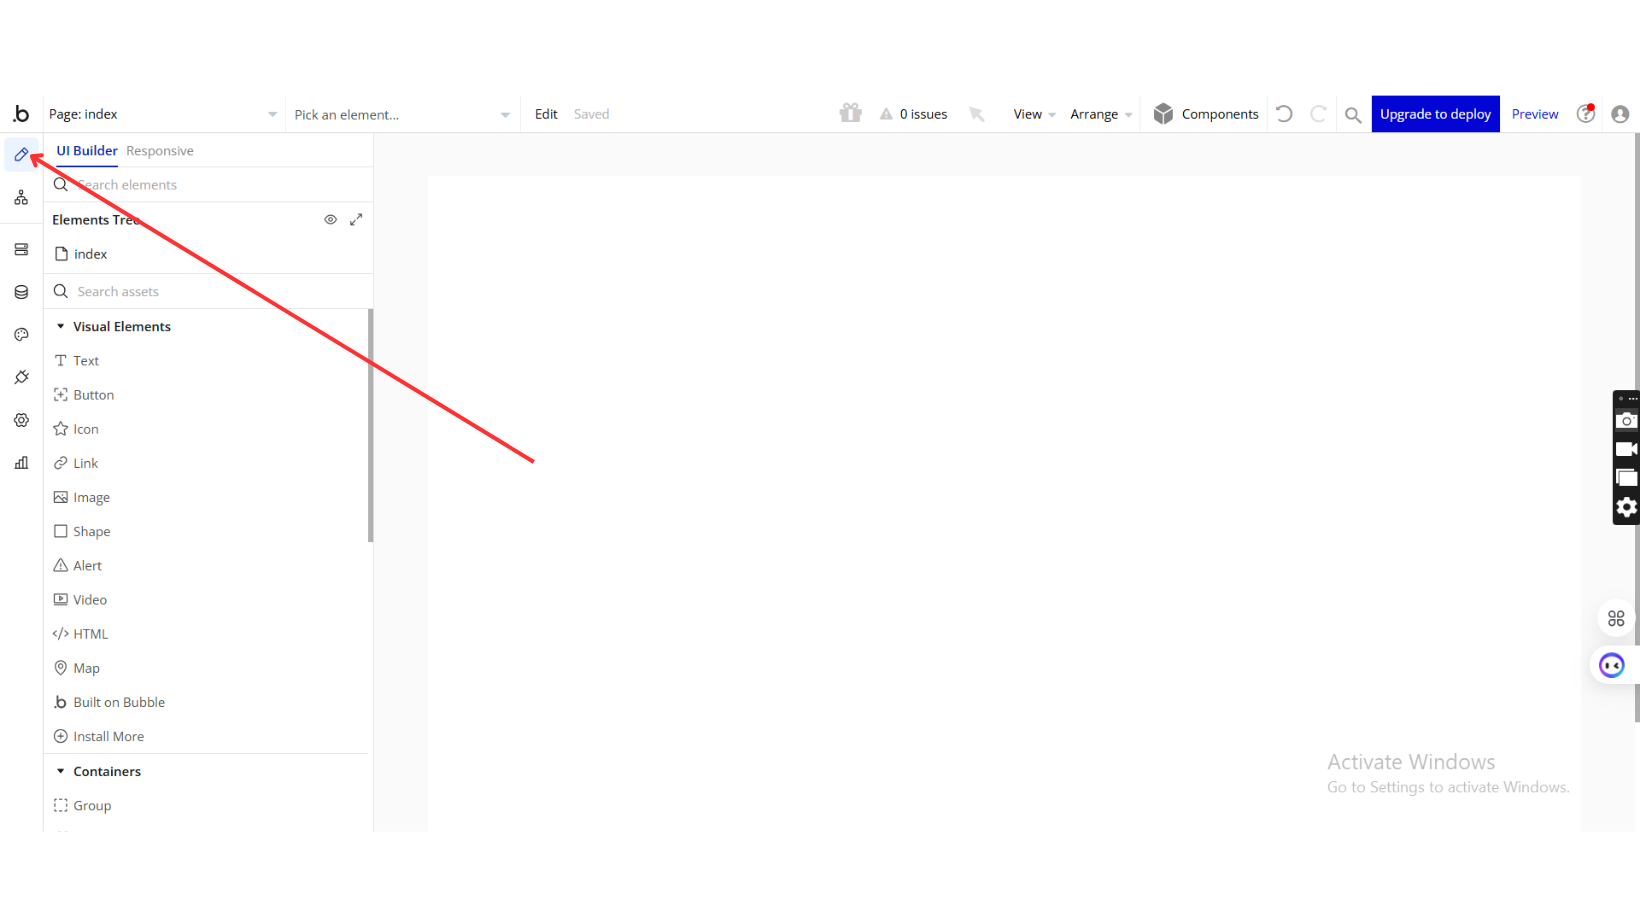
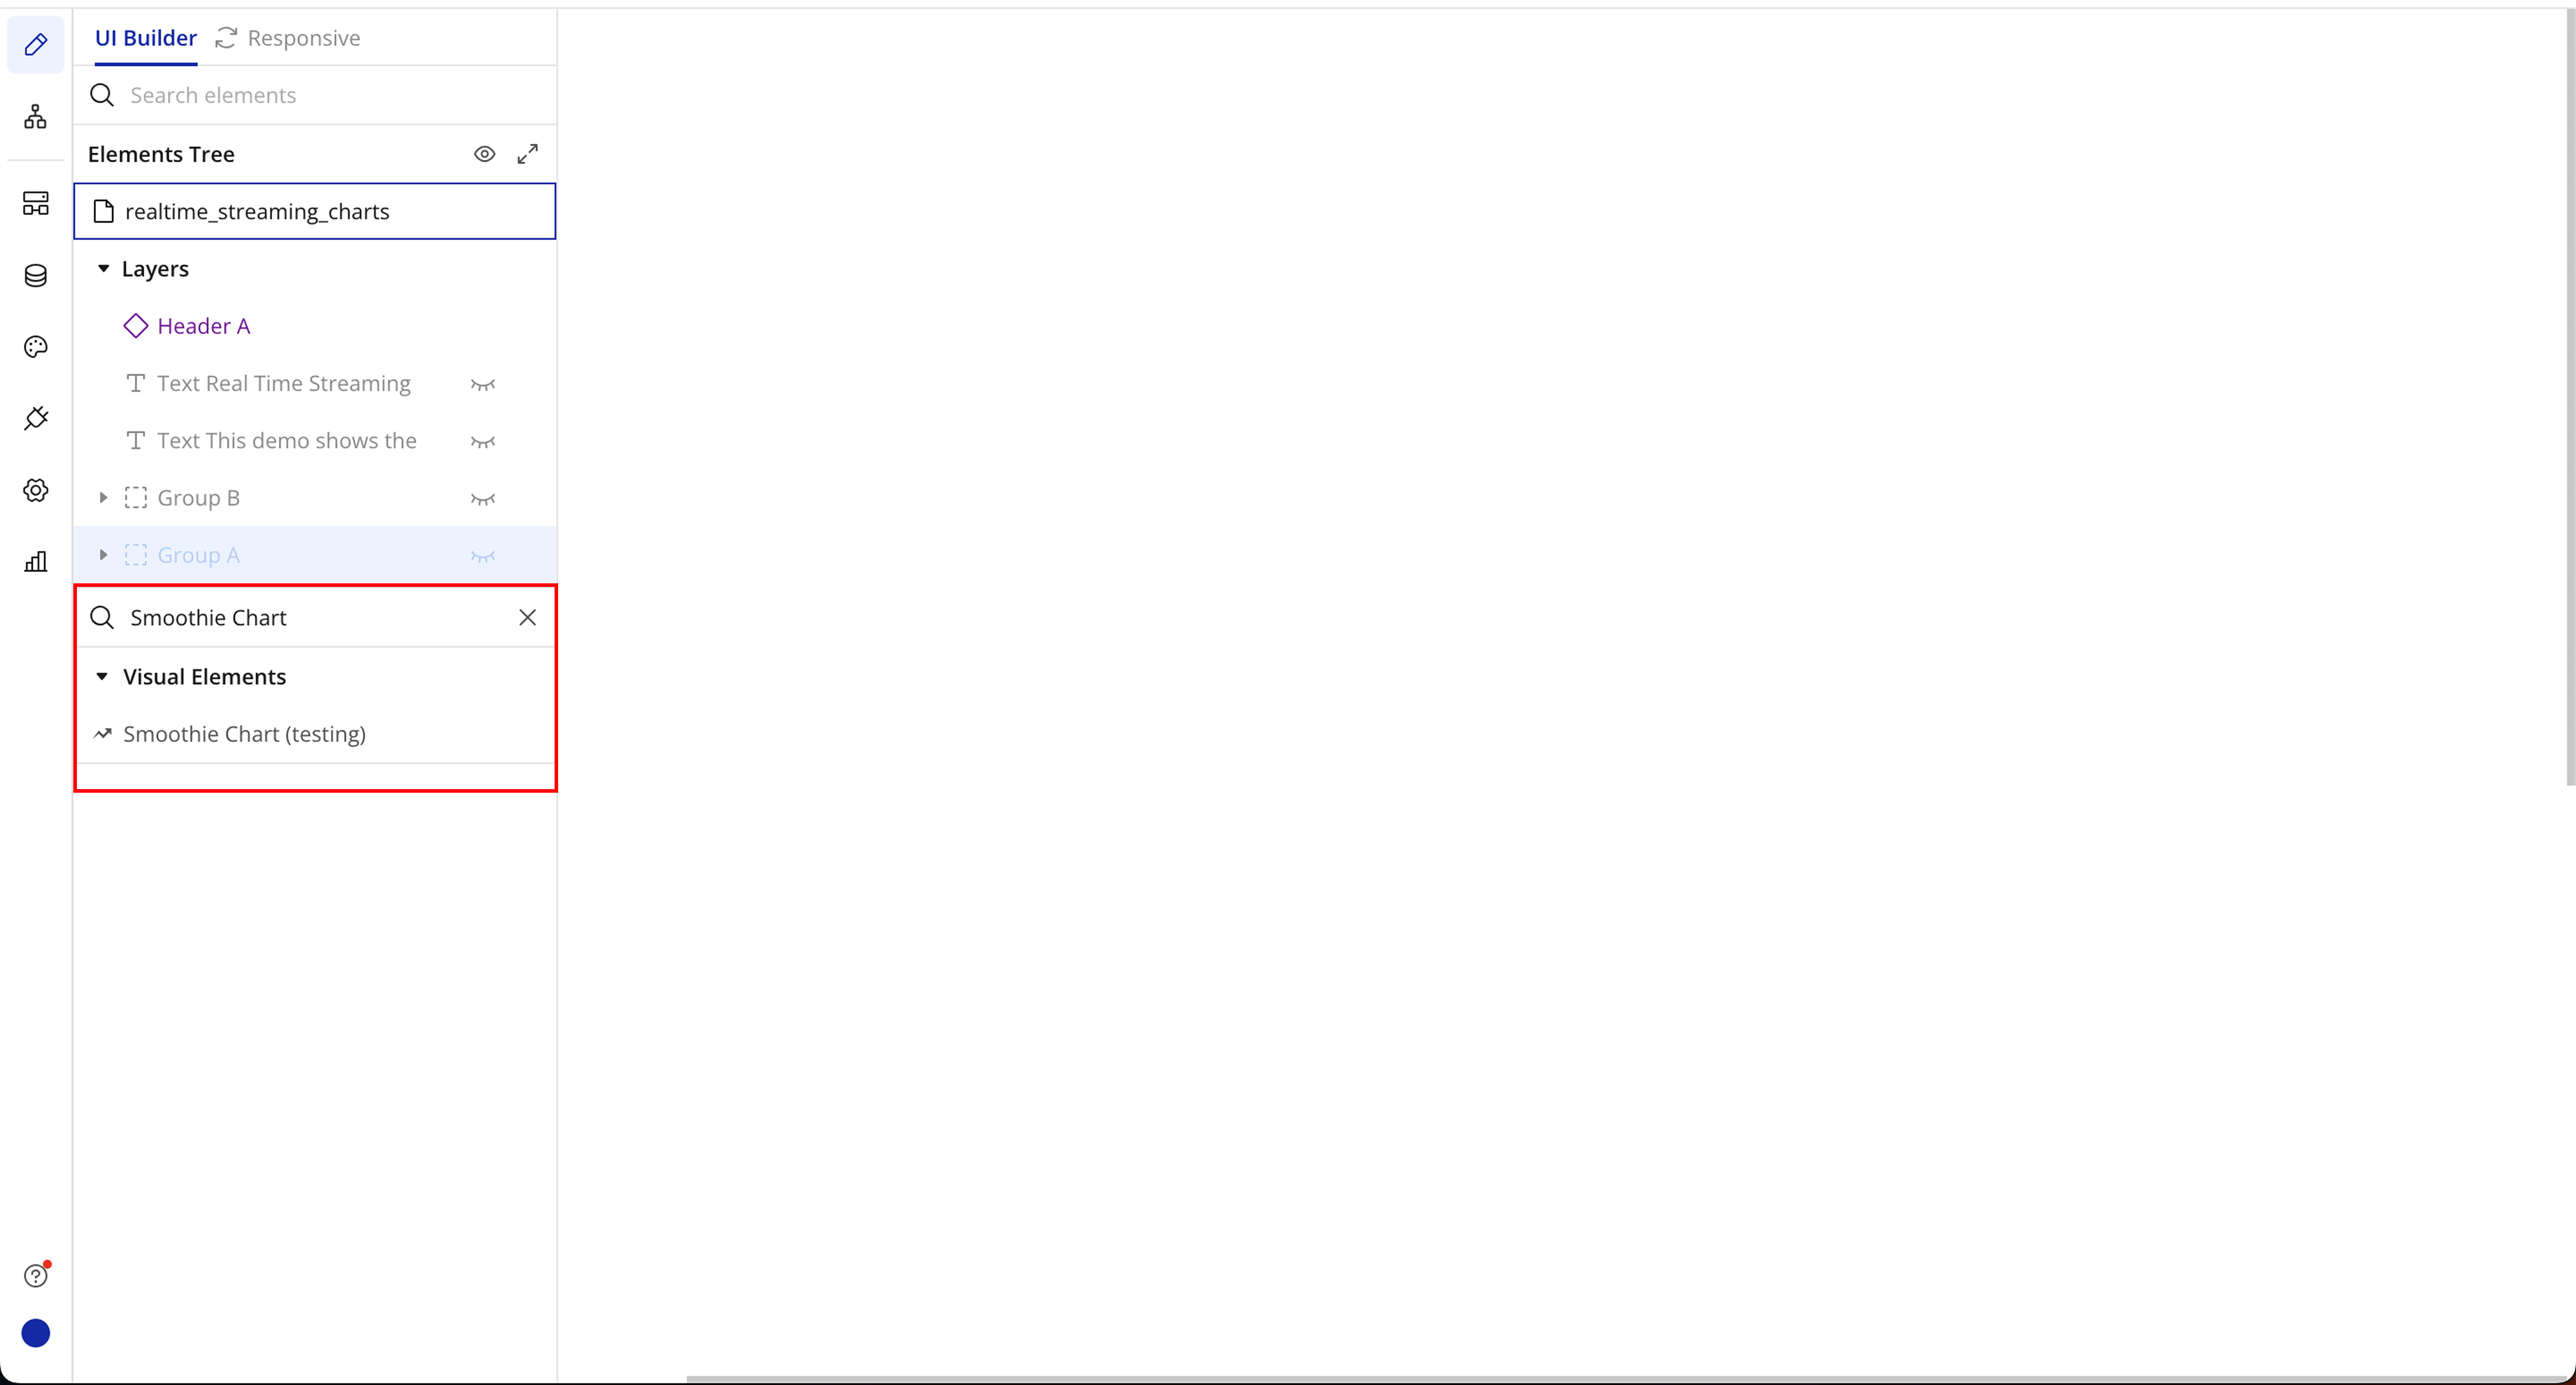
Step 2: Place the Element
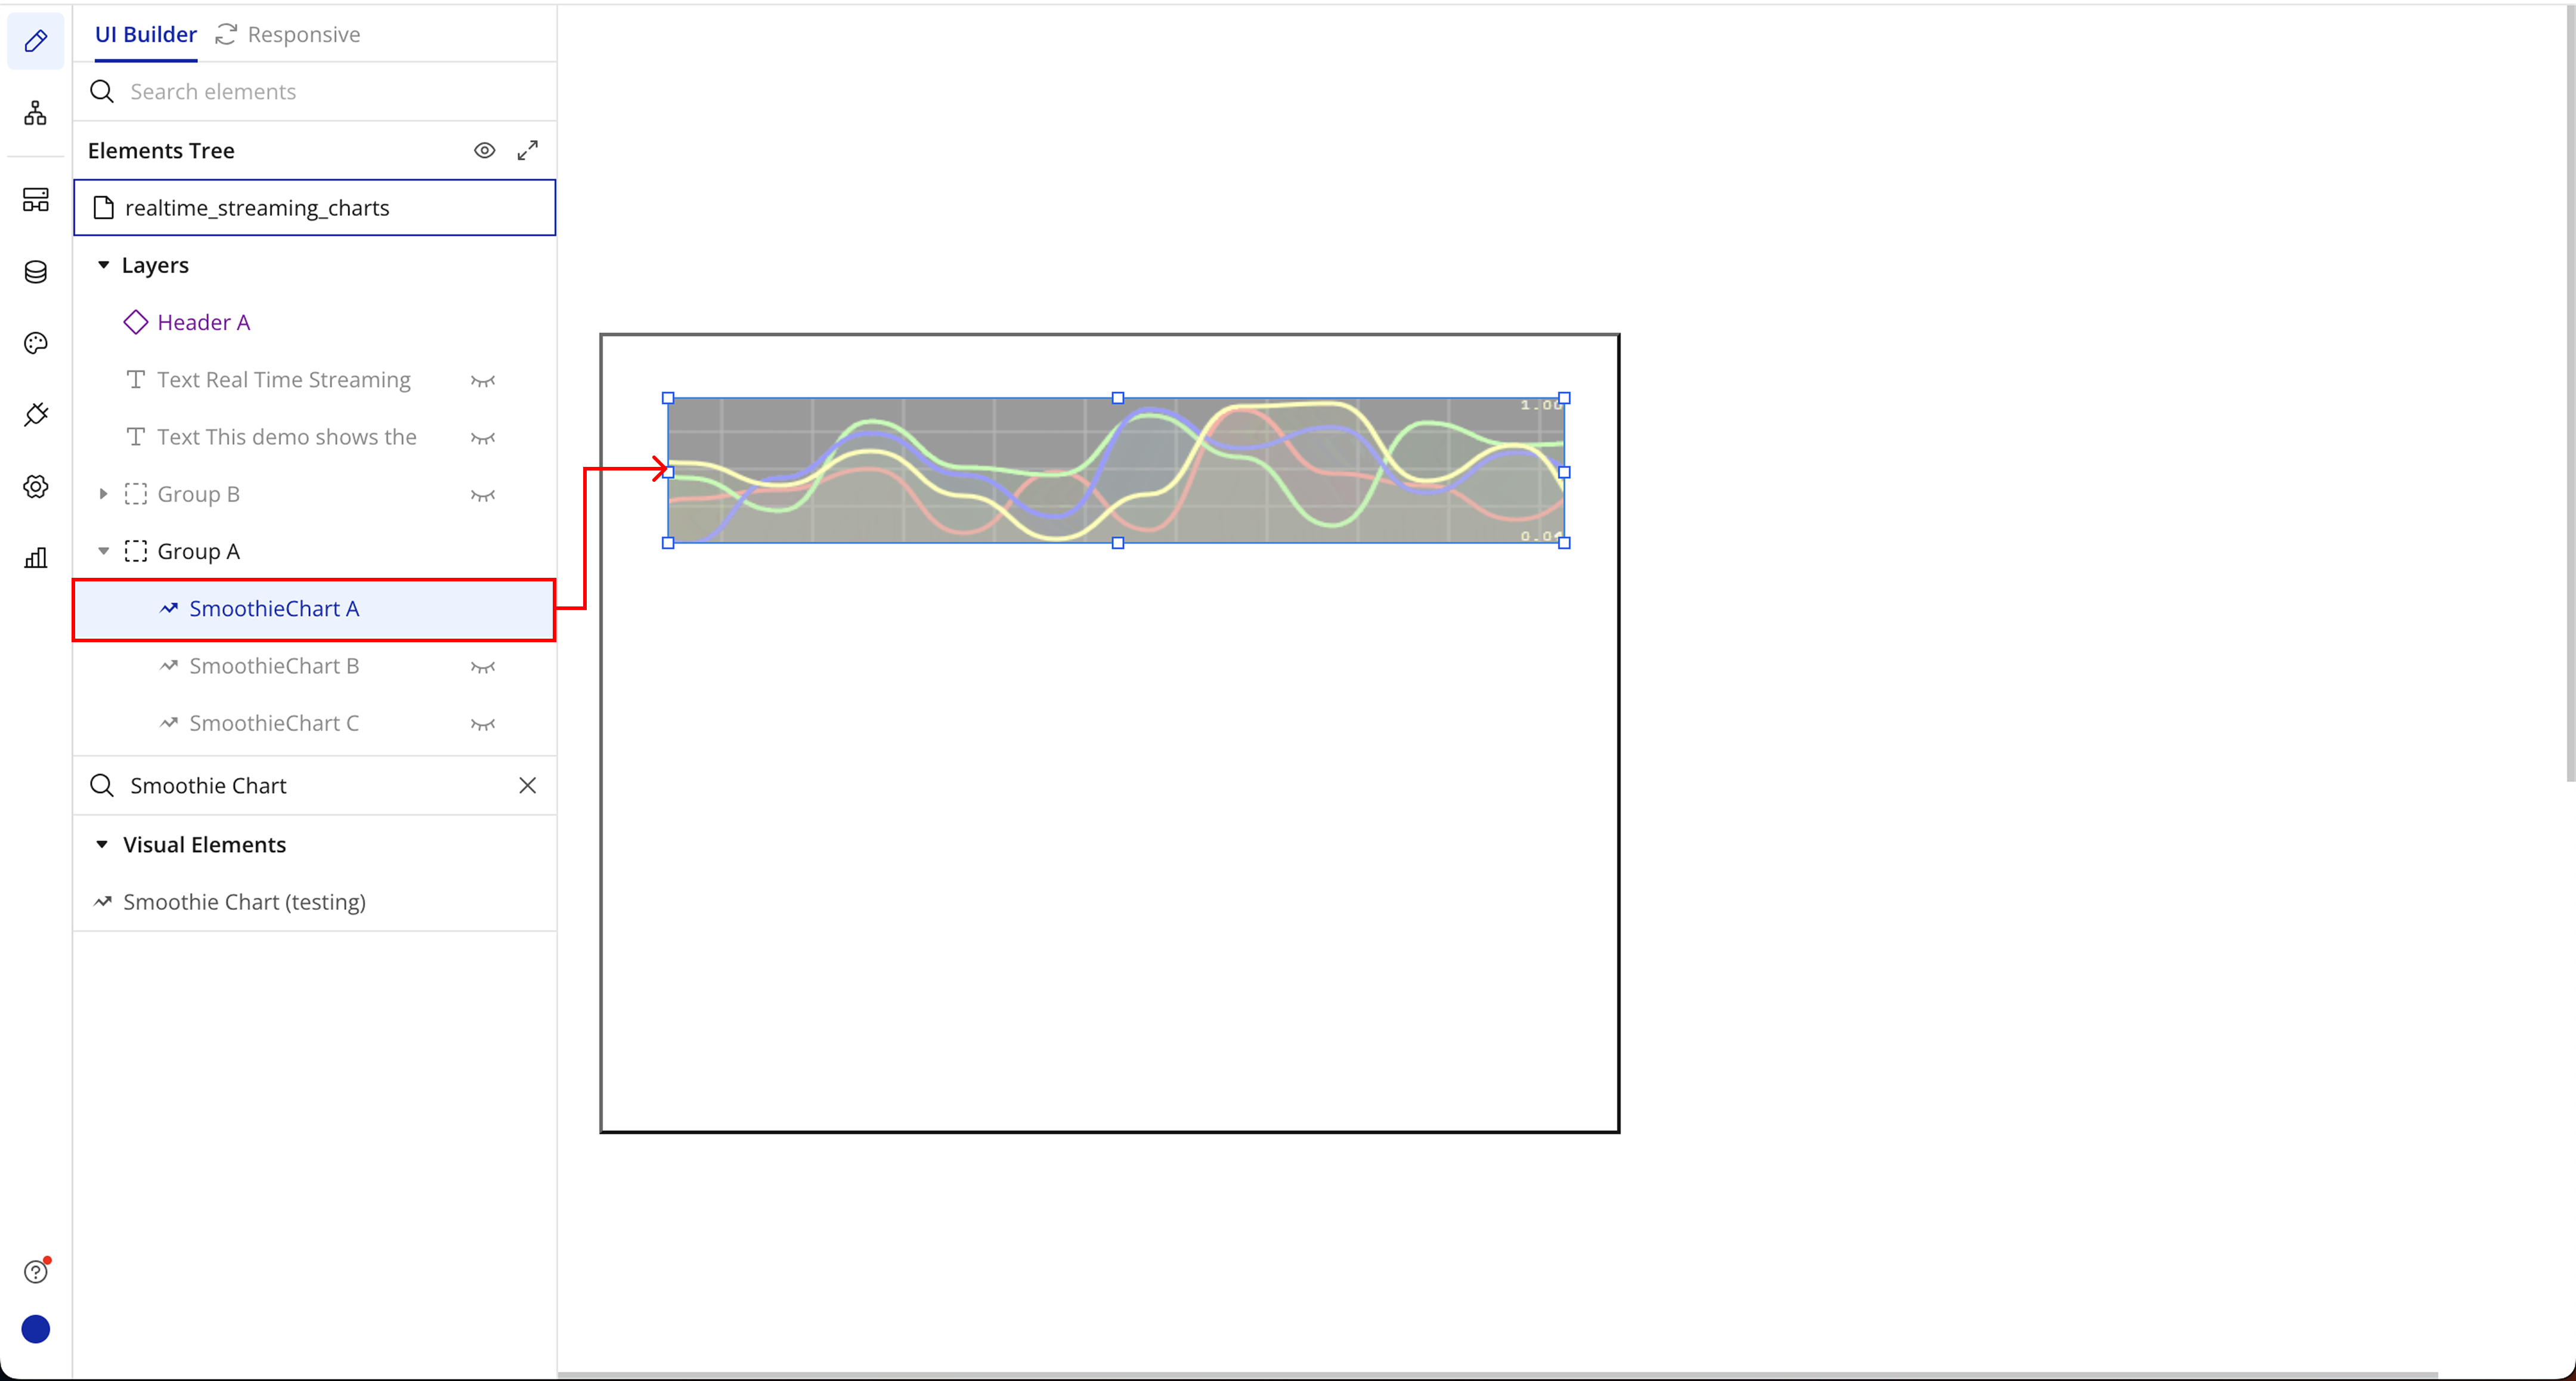
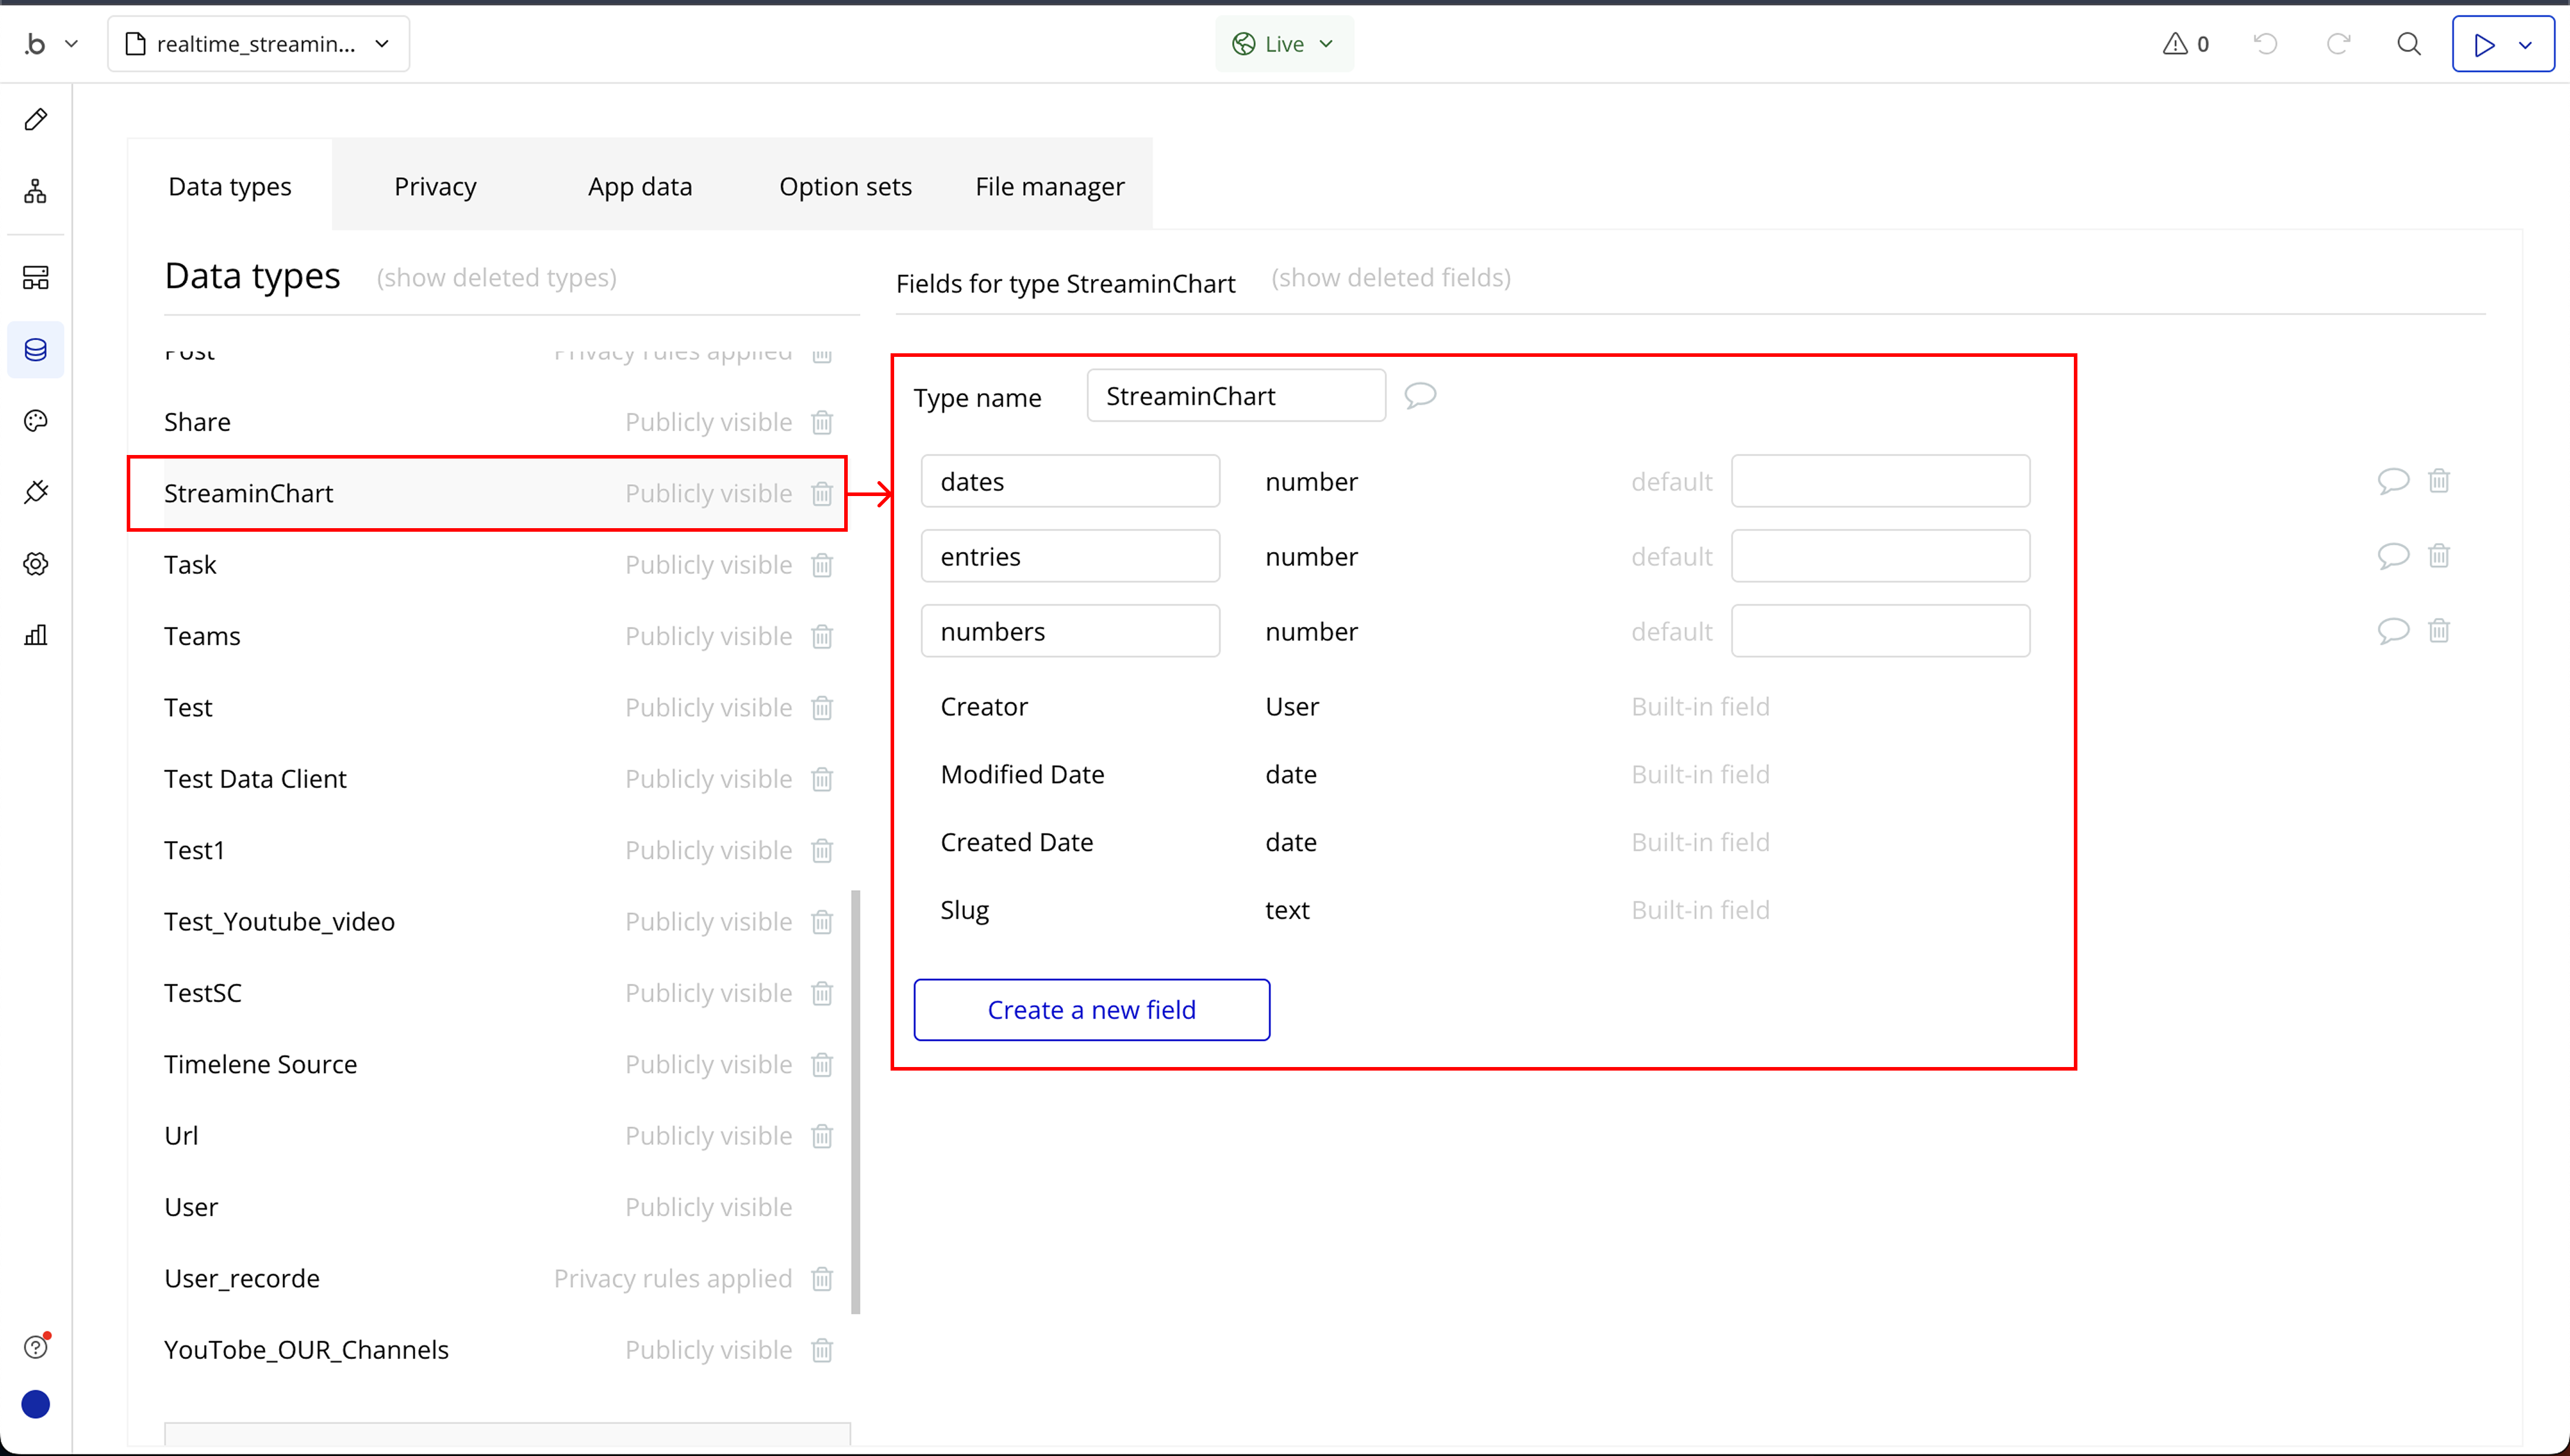
Step 3: Create a Data Type for Streaming Data
Step 4: Element Setup

Step 5: Setup Workflow
Plugin Element Properties
Smoothie Chart
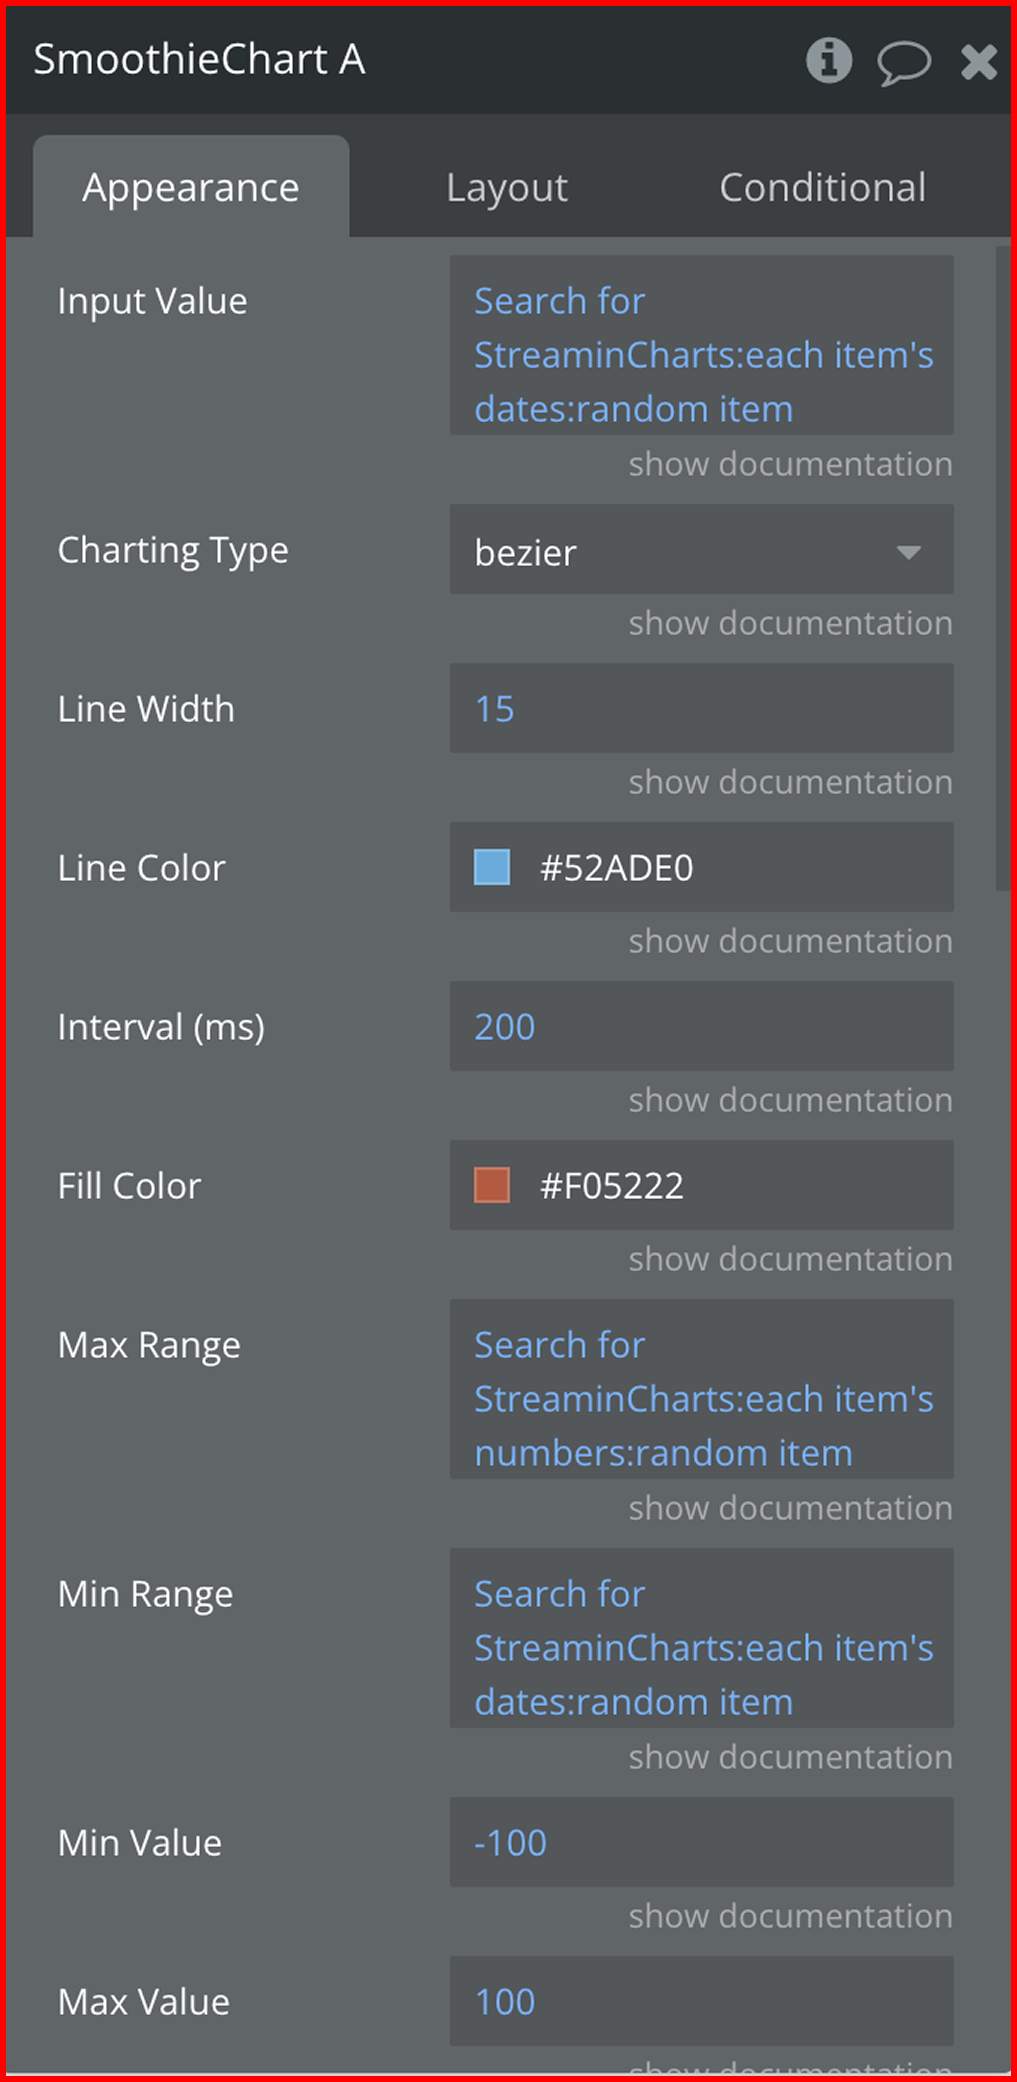
Fields:
Title | Description | Type |
Input Value | Input Value | Number |
Charting Type | Charting Type Available options: bezier, linear, step | Dropdown |
Line Width | Line Width | Number |
Line Color | Line Color | Color |
Interval (ms) | Interval (ms) | Number |
Fill Color | Fill Color | Color |
Max Range | Max Range | Number |
Min Range | Min Range | Number |
Min Value | Min Value | Number |
Max Value | Max Value | Number |
Scroll Speed (1-100) | Scroll Speed (1-100) | Number |
Custom CSS | Custom CSS | Text |
Exposed states
Title | Description | Type |
Element ID | Element ID | Text |

Changelogs