
Link to the plugin page: https://zeroqode.com/plugin/circular-donut-charts-plugin-for-bubble-1739546709257x331185504299086100
Demo to preview the plugin:
Introduction
This plugin allows you to add circular donut charts that display values. You can set the min/max, color, thickness, size and style.

How to setup
- In your Bubble editor, go to the Design tab.
- From the Visual Elements list, drag the Donut Chart element onto your page.
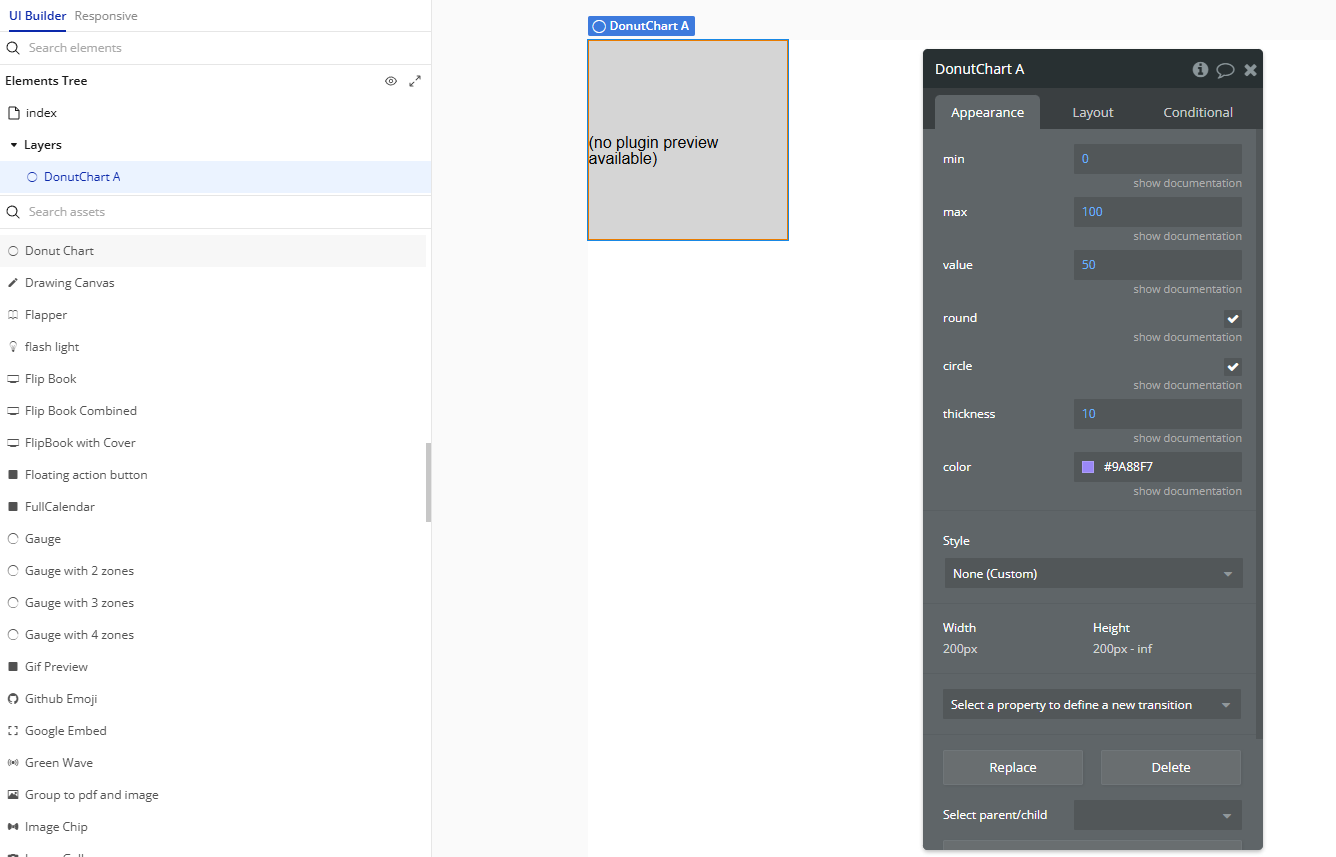
- Adjust the properties to configure your chart appearance.
Plugin Element Properties
Donut Chart
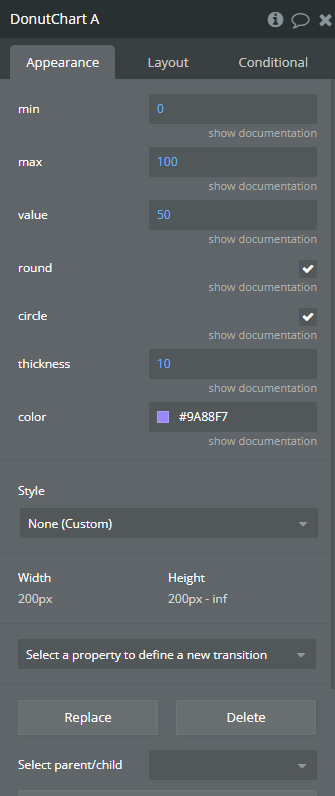
Fields:
Title | Description | Type |
Min | The minimum value of the donut | Number |
Max | The maximum value of the donut | Number |
Value | The actual value of the donut. Between min and max | Number |
Round | Should the donut be round? | Checkbox (yes/no) |
Circle | Should the donut be a circle? | Checkbox (yes/no) |
Thickness | The thickness of the donut in pixels | Number |
Color | The color of the donut | Color |