Link to plugin page: https://zeroqode.com/plugin/google-charts-1512891028097x505474522021888000
Demo to preview the settings
Introduction
Plugin for displaying google charts on Bubble framework.
This plugin has the following list of charts:
- Pie Chart;
- Donut Chart;
- Bar Chart;
- Histogram;
- Table Chart;
- Area Chart;
- Combo Chart;
- Geo Chart;
- Scatter Chart;
- Column Chart;
- Line Chart;
- Scatter;
- Stepped Area Chart.
Portions of this page are modifications based on work created and shared by Google and used according to terms described in the Creative Commons 3.0 Attribution License.

How to setup
- After Plugin is installed in your application
2. Place the Google charts element on the page editor:
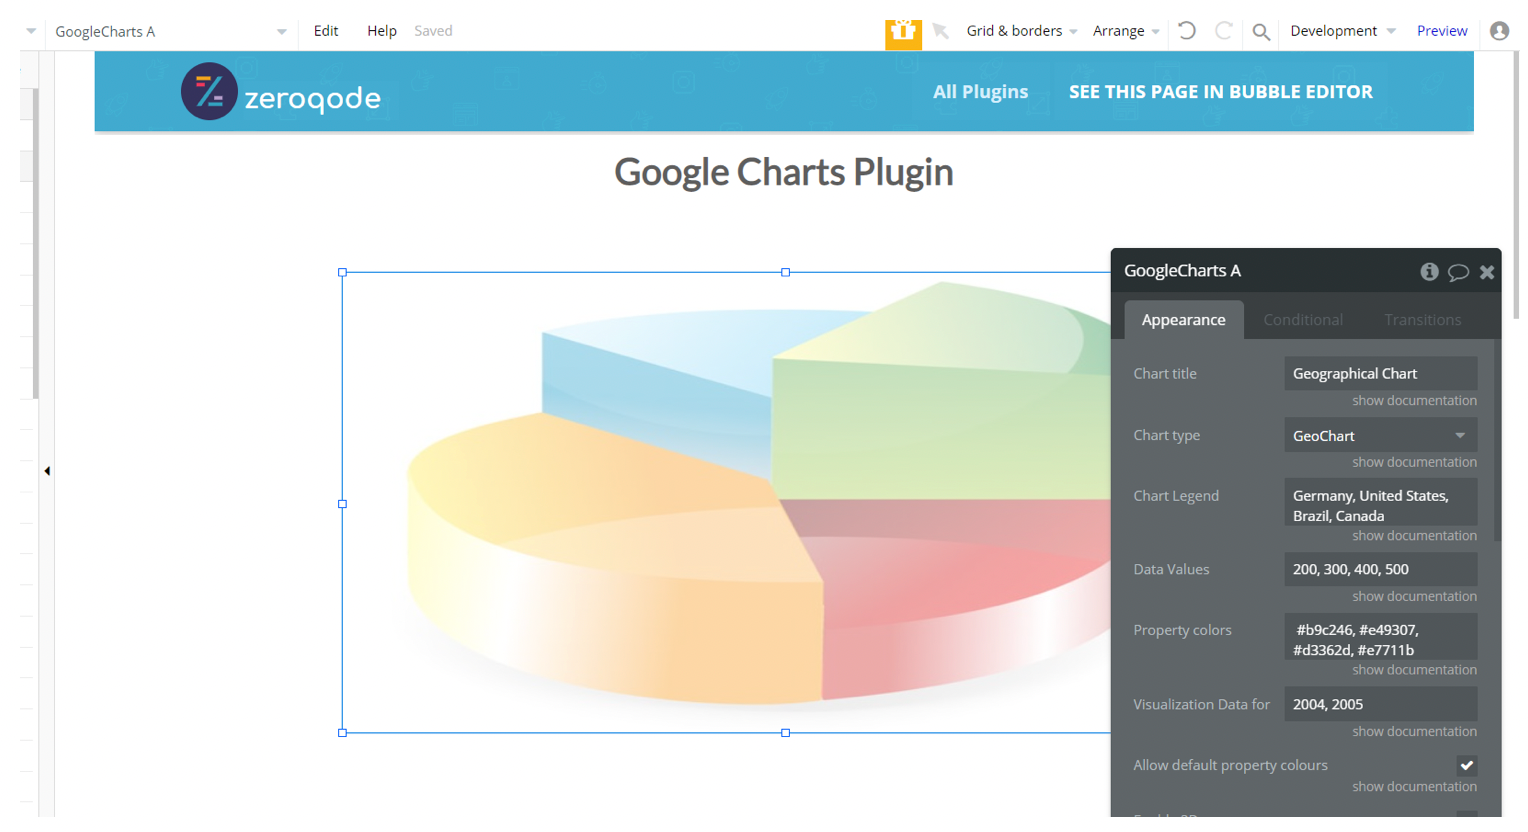
3. Choose Type of chart, add values, provide title and legend.
4. Done. Preview the result.
Plugin Element Proprieties
This plugin has the visual element Google Charts which should be used on a page, a (can be used right after the plugin installation and indicating data source).
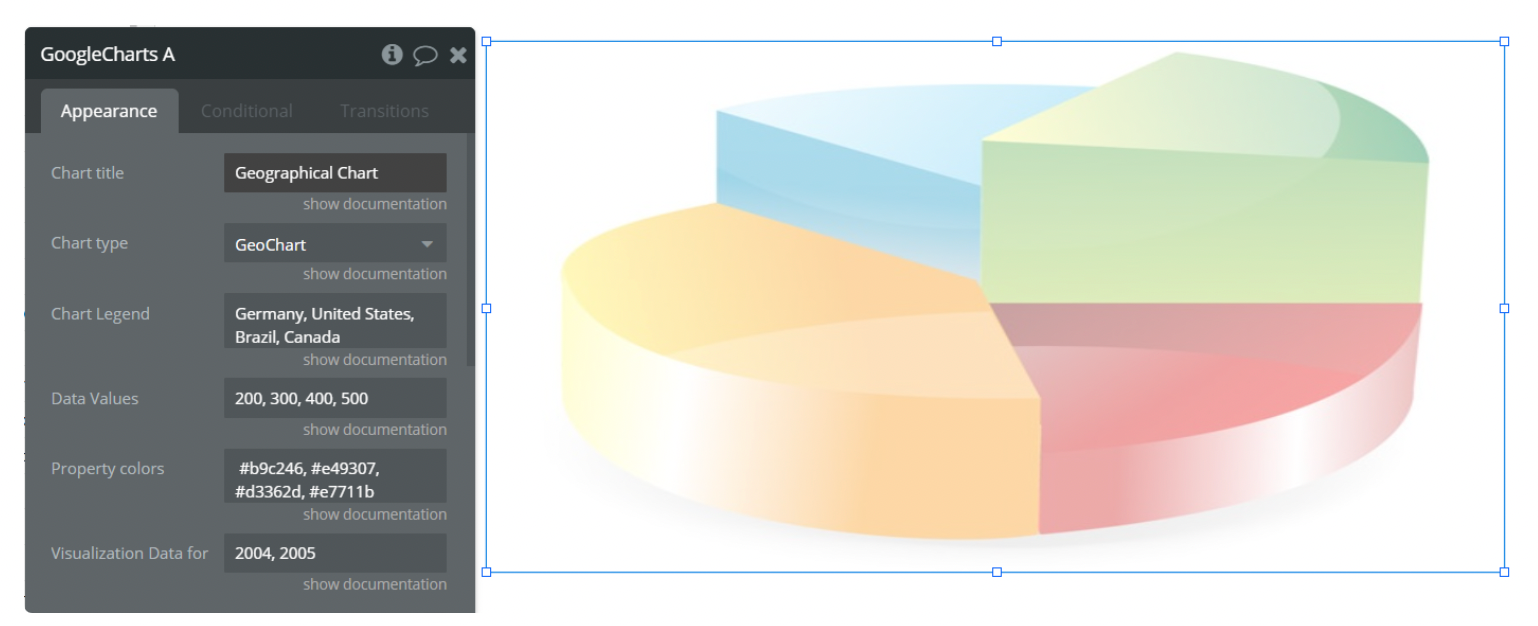
Properties fields
- Chart title: write the name of the diagram in this field
- Chart type: select the desired chart type. Available charts - Pie Chart; Donut Chart; Bar Chart; Histogram; Table Chart; Area Chart; Combo Chart; Geo Chart; Scatter Chart; Column Chart; Line Chart; Scatter; Stepped Area Chart.
- Chart Legend: the name of the type of data that will be drawn to the values that will be drawn
- Data Values: this field represents chart values. It should contain only comma-separated numbers. Past there list of values using which the plugin will build a matrix.

For example:
Two values are given in the Legend field: Sales, Expenses.
Their Data Values will be 1000, 1170, 660, 1030, 400, 460, 1120, 540.
The plugin takes the first four values and sets them to the first element (Sales) and another four to the second one (Expenses).
The schematic example you can see on this matrix:
'Year', 'Sales', 'Expenses',
'2004', 1000, 400,
'2005', 1170, 460,
'2006', 660, 1120,
'2007', 1030, 540
The first column is the x-axis, then the other columns are formed from the values in the legends with the values assigned by the plugin from the field of the data values.
- Property color: this field is setting colors (hex values) for the diagram but for its work is necessary to take the tick "Allow default property colors:

- Allow default property colors: this field is required to use with property colors

- Visualization Data for X-axis: Visualization data for x-axis or data for the first column, if you use Table Chart.

- Enable 3D: Whether you want the chart to be shown in 3d mode (only for PieChart and DonutChart)
- Hide Charts Legend: Hide legend feature
- Pie Slice text: If "none" or nothing selected, the text on the pie slice will be blank.
- Pie Slice offset: Add offset for pie slices. The allowed value is a number between 0 and 1.
- Measuring system: Select a measuring system for area configuration.
- Top: Location on Y-axis
- Left: Location on X-axis
- Width: Chart area width
- Height: Chart area height
- Background color: Change the pie chart/donut char background. Default white. (only for PieChart and DonutChart)
- Opacity: "Opacity" field for opacity level control of Pie and Donut charts. Values from 0 to 1. (only for PieChart and DonutChart)
Formatting number on Y-axis

The dimensions in the data are often displayed on vertical axis, that can be formatted the following way:
You can control the formatting of label numbers with
vAxis.none: displays numbers with no formatting (e.g., 8000000);
decimal: displays numbers with thousands separators (e.g., 8,000,000);
scientific: displays numbers in scientific notation (e.g., 8e6);
currency: displays numbers in the local currency (e.g., $8,000,000.00);
percent: displays numbers as percentages (e.g., 800,000,000%);
short: displays abbreviated numbers (e.g., 8M);
long: displays numbers as full words (e.g., 8 million);
- if you want the formatting to be currency then you will need to set the formatting in the default mode.
Locales
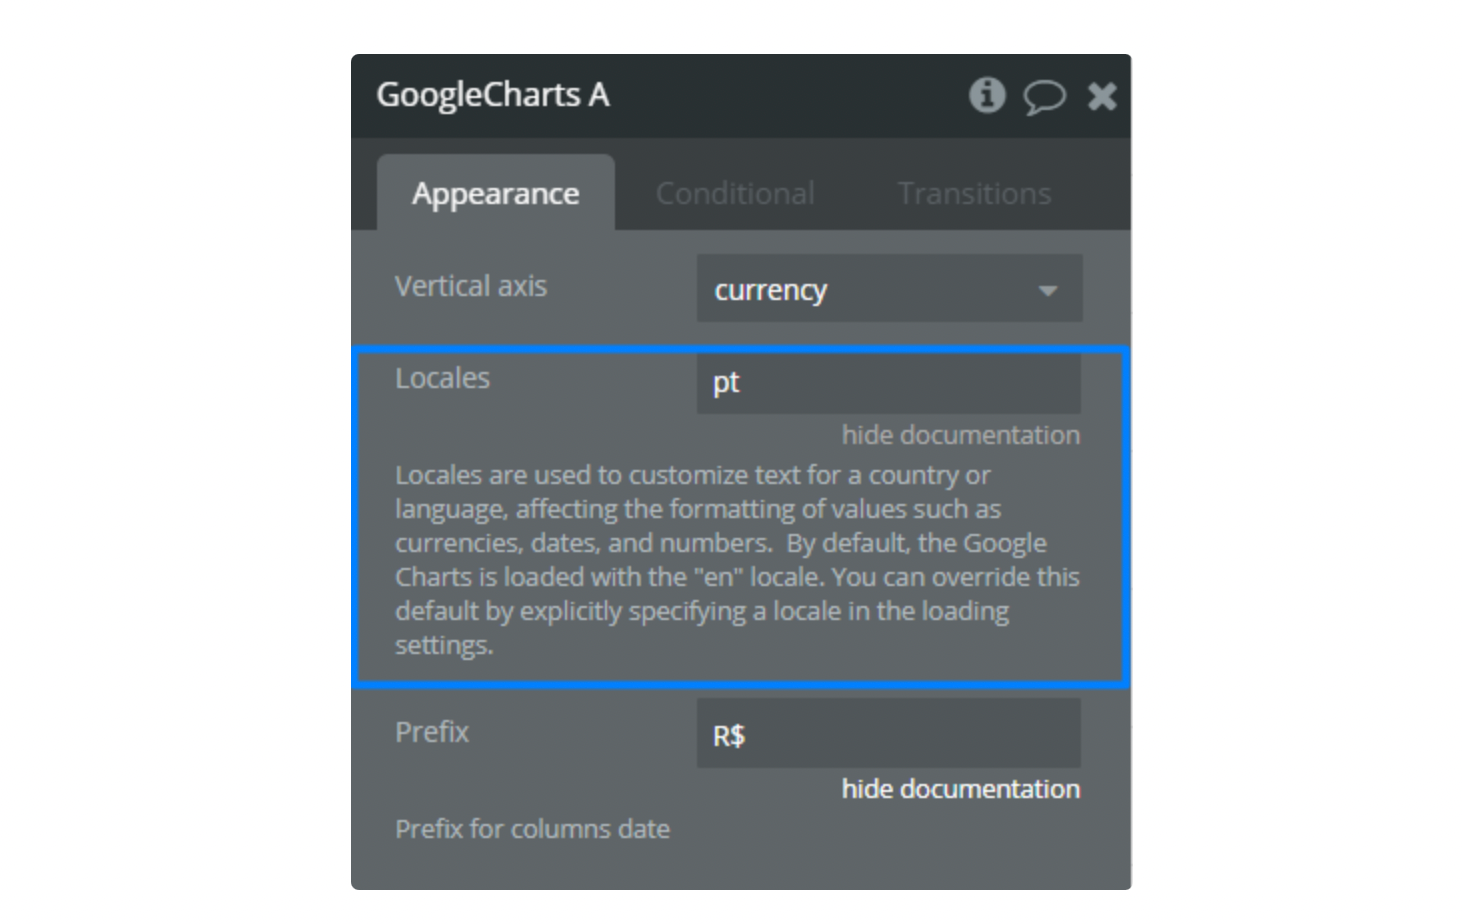
Locales are used to customize the text for a country or language, affecting the formatting of values such as currencies, dates, and numbers.
By default, the Google Charts is loaded with the "en" locale. You can override this default by explicitly specifying a locale in the loading settings.
Currency Patterns locales: https://www.localeplanet.com/icu/currency-pattern.html

Examples:
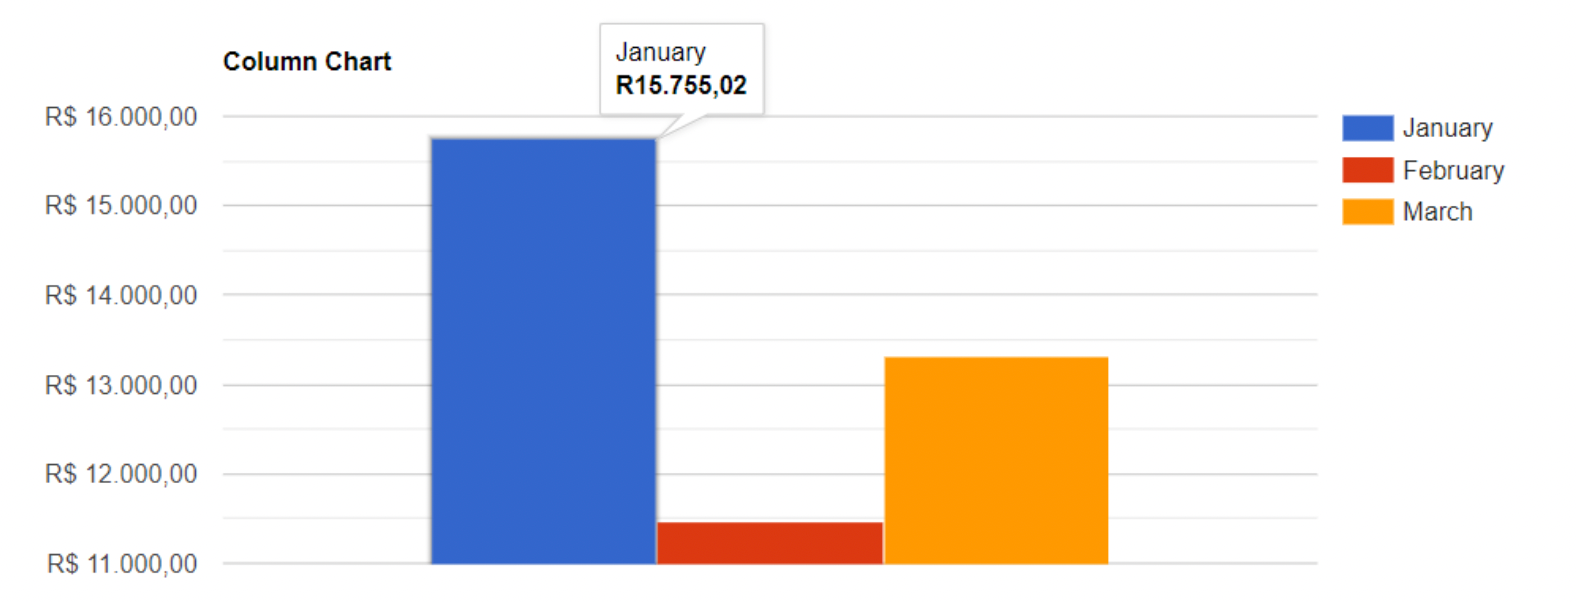
Column Chart
Pie Chart
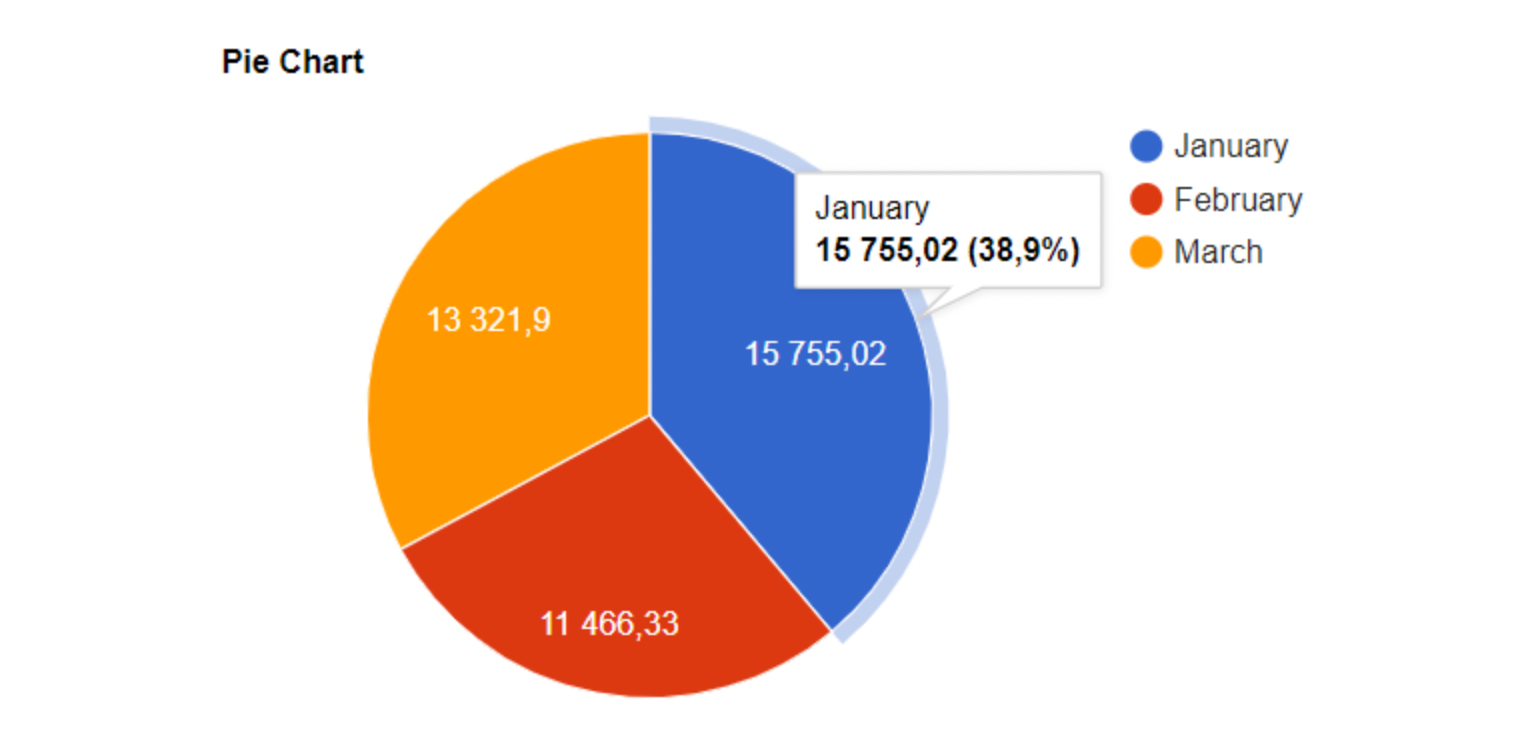
Table Chart


