Link to plugin page: https://zeroqode.com/plugin/air-database-diagram-1617980827551x492384518920591100
Demo to preview the settings
Introduction
This plugin allows you to easily visualize the relationships between your bubble data.

How to setup
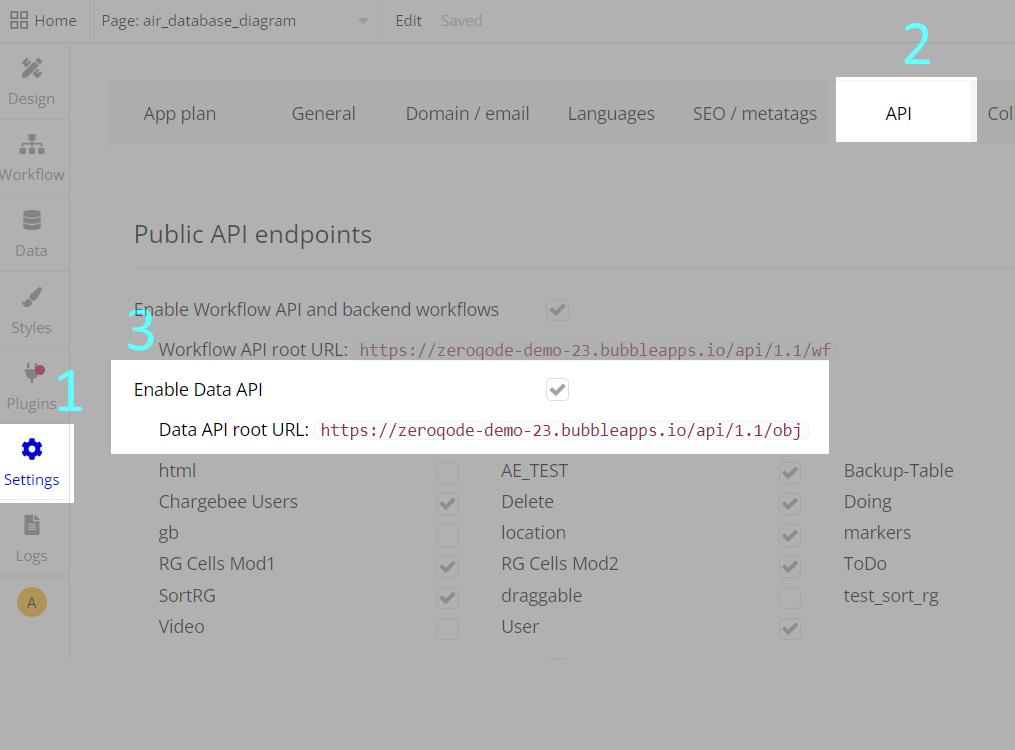
- Go to the Settings page and navigate to the API tab. Check the option: 'Enable Data API.'
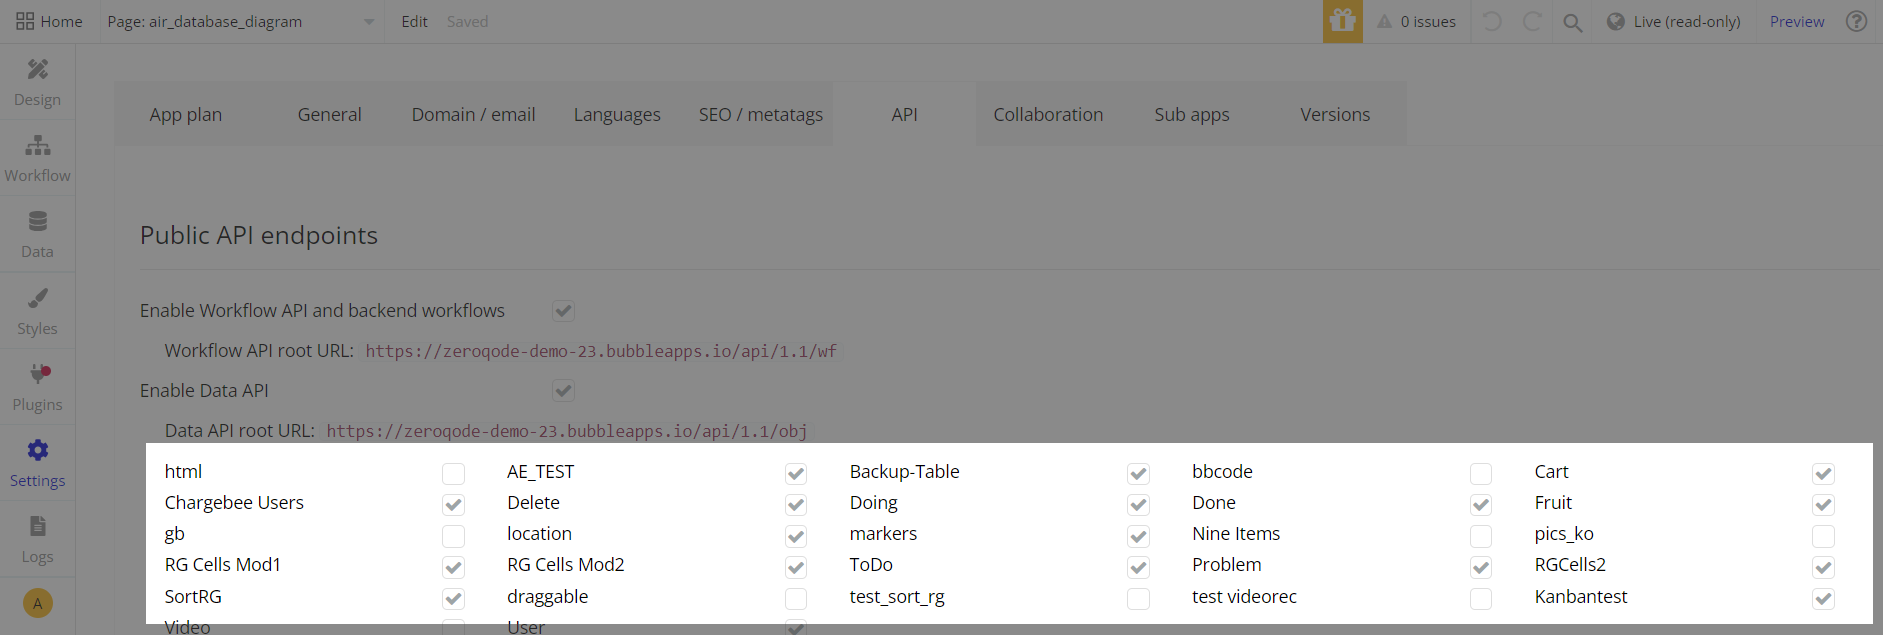
- Select the data types you wish to display in your database diagram.
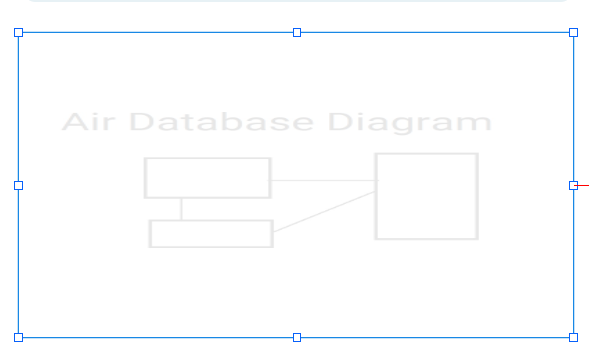
- In your Bubble editor, add the 'Air Database Diagram' element.
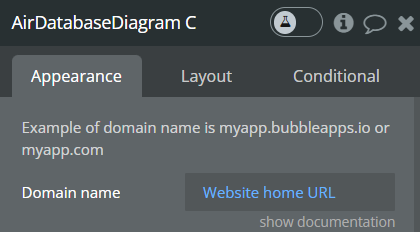
- Enter your application's domain name (dynamic value: Website home URL).
- Customize other options, including the style, color usage, diagram scaling, and direction.
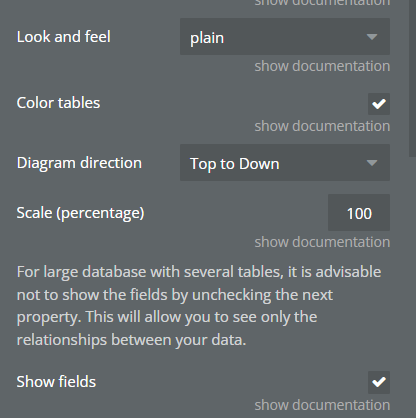
- The generated image can be displayed in two ways:
- In the 'Air Database Diagram' element. Check field ‘Display in viewer’ and choose ‘File format’:
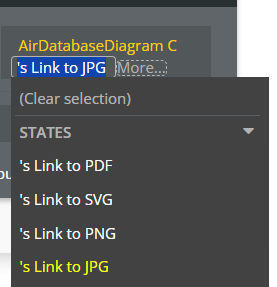
- Use 1 of 4 element’s states. States can be used in an image element or opened in a new tab:

- Preview your page. The generation time may vary depending on the size of your diagram.
Plugin Element Properties
**Title ** | Description |
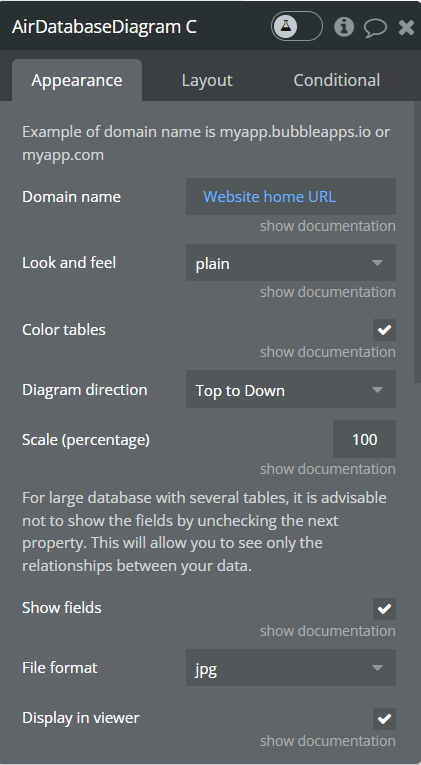
Example of domain name is myapp.bubbleapps.io or myapp.com | |
Domain name | Your application domain. |
Look and feel | Look and feel of tables.
Available options: scruffy, plain and boring. |
Color tables | Check box to use a background color for tables. |
Diagram direction | Direction for drawing table.
Available options: Left to Right, Top to Down and Right to Left. |
Scale (percentage) | For scaling the diagram. Enter percentage value |
For large database with several tables, it is advisable not to show the fields by unchecking the next property. This will allow you to see only the relationships between your data. | |
Show fields | Uncheck to hide fields. |
File format | Format of image for showing table in the ‘Air Database Diagram’ element. |
Display in viewer | Check to show the image an image viewer. |
Exposed states
Name | Type |
Link to PDF | Text |
Link to SVG | Text |
Link to PNG | Text |
Link to JPG | Text |
