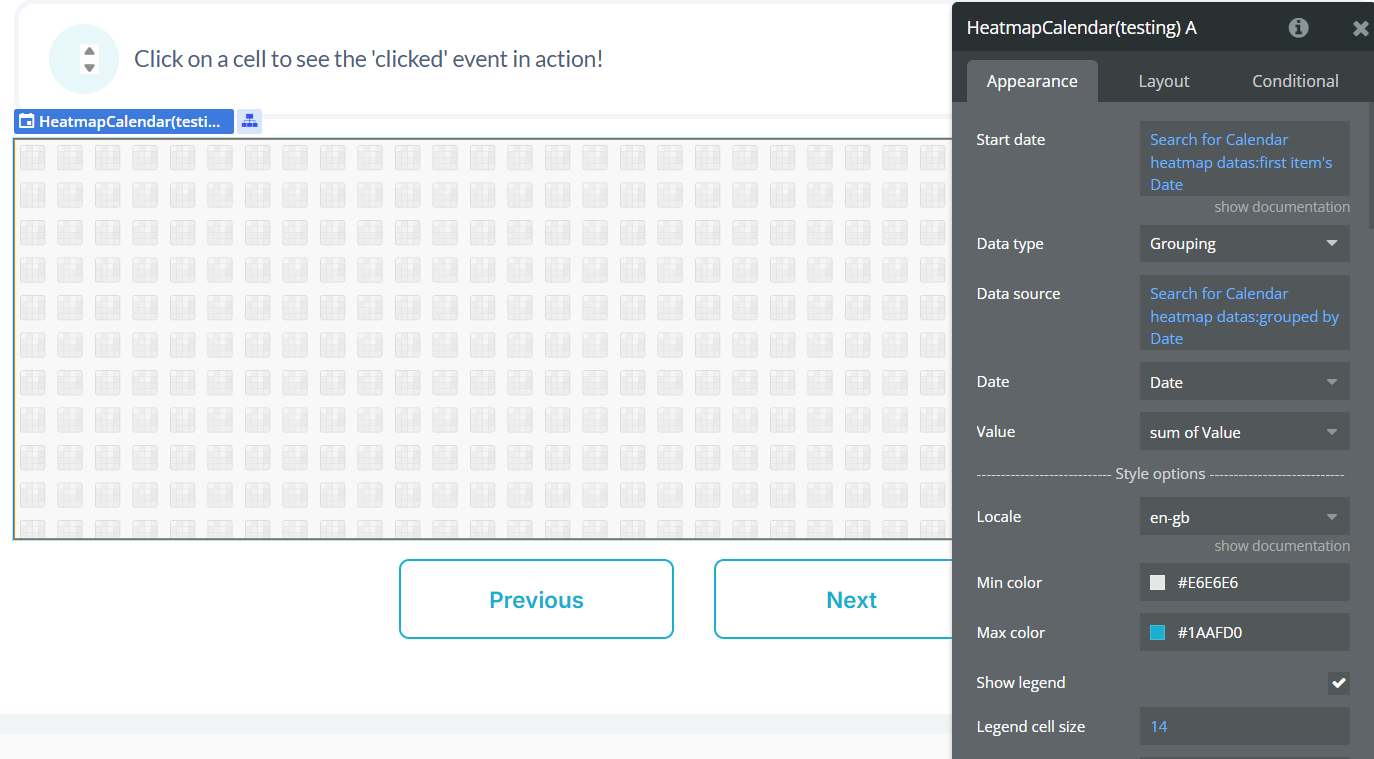
Demo to preview the plugin:
Live Demo: https://calendarheatmap.bubbleapps.io/
Introduction
Calendar Heatmap Visualizer is a powerful Bubble plugin that allows you to add a fully customizable calendar heatmap to your application. Similar to GitHub’s contribution graph, this plugin visualizes data intensity over time using color gradients. It supports multiple languages, customizable styles, and provides “clicked” events with associated states to create interactive visualizations.
The plugin is perfect for displaying activity over time, tracking habits, visualizing user engagement, or any data that benefits from a time-based heatmap visualization.

How to setup
Setting up the Calendar Heatmap Visualizer plugin is straightforward:
- Install the plugin from the Bubble plugin marketplace.
- Add the Heatmap Calendar element to your page.
- Configure the data source by providing:
- A start date
- Data source (list of items)
- Date field (from your data source)
- Value field (from your data source)
- Customize the appearance using the style options provided.
Plugin Element Properties
The plugin contains a visual element called “Heatmap Calendar” that should be placed on your page.
Heatmap Calendar
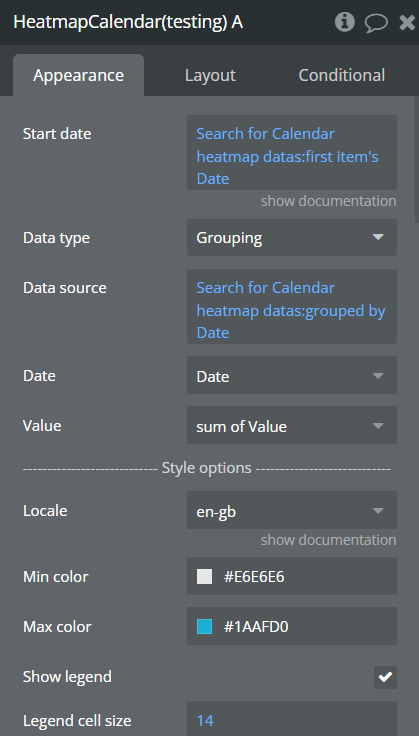
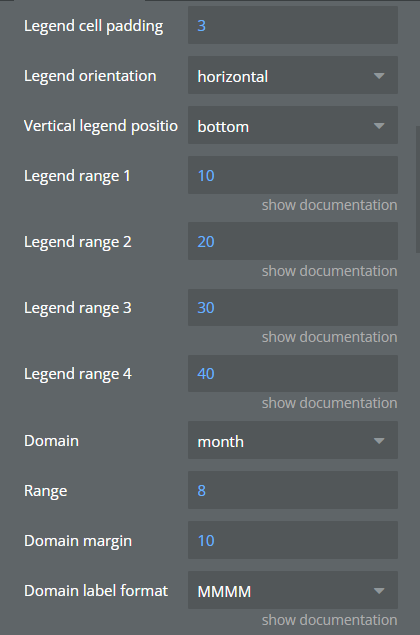
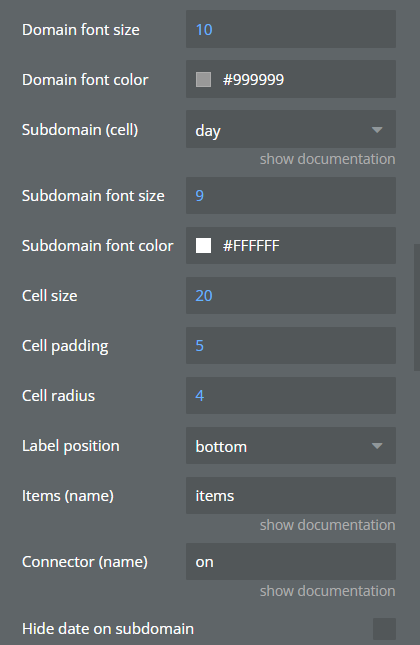
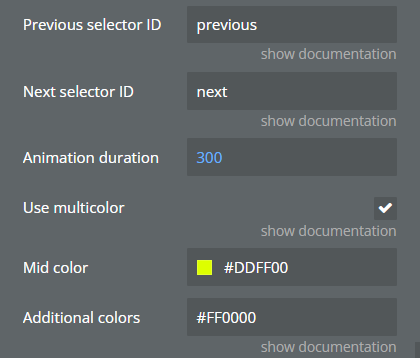
Fields:
Title | Description | Type |
Start date | The first date to show on the calendar | Date |
Data type | The type of data to be displayed | Custom Type |
Data source | The list of items to display on the calendar | List |
Date | The date field from your data source | Date |
Value | The numeric value to determine color intensity | Number |
Min color | The color used for minimum values | Color |
Max color | The color used for maximum values | Color |
Locale | The locale used to translate date names (e.g., en-gb, fr, es) | Text |
Show legend | Whether to display a color legend | Boolean |
Legend cell size | Size of the legend cells | Number |
Legend cell padding | Padding between legend cells | Number |
Legend orientation | Orientation of the legend (horizontal/vertical) | Text |
Vertical legend position | Position of the legend when vertical (top/center/bottom) | Text |
Legend range 1-4 | Threshold values for the legend color ranges | Number |
Domain | The main time division (hour/day/week/month/year) | Text |
Range | Number of domains to display | Number |
Domain margin | Margin between domains | Number |
Domain font size | Font size for domain labels | Number |
Domain font color | Font color for domain labels | Color |
Domain label format | Format for domain labels (MMMM, YYYY, etc.) | Text |
Subdomain (cell) | The time division for cells (must be smaller than domain) | Text |
Subdomain font size | Font size for subdomain labels | Number |
Subdomain font color | Font color for subdomain labels | Color |
Cell size | Size of each cell | Number |
Cell padding | Padding between cells | Number |
Cell radius | Border radius of cells | Number |
Label position | Position of labels (bottom/top/left/right) | Text |
Items (name) | The “item” name for the tooltip: “10 items on date” | Text |
Connector (name) | The “connector” name for the tooltip: “10 items on date” | Text |
Hide date on subdomain | Whether to hide date text on cells | Boolean |
Previous selector ID | ID of the element to use as previous button | Text |
Next selector ID | ID of the element to use as next button | Text |
Animation duration | Duration of animations in milliseconds | Number |
Element Actions
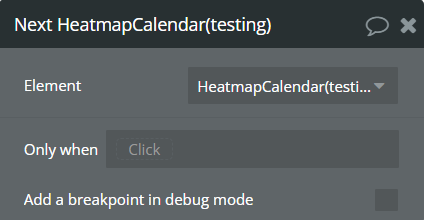
Next
Navigates to the next time period in the calendar.
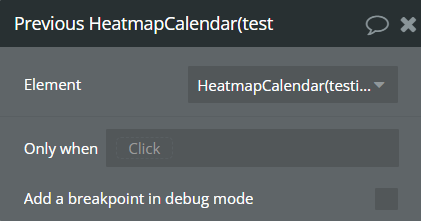
Previous
Navigates to the previous time period in the calendar.
Rewind (Reset)
Resets the calendar view to the initial start date.
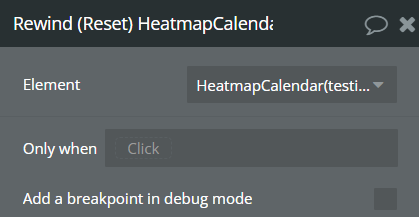
No parameters required for this action.
Exposed states
Name | Description | Type |
Clicked date | The date of the cell that was clicked | Date |
Clicked value | The value of the cell that was clicked | Number |
Is fully loaded? | Whether the calendar has finished loading | Boolean |
Element Events
Name | Description1 |
Cell is clicked | Triggered when a cell in the calendar is clicked |
Workflow example
Here’s a basic workflow example for setting up and using the Cal-Heatmap calendar:
- Add the Heatmap Calendar element to your page.
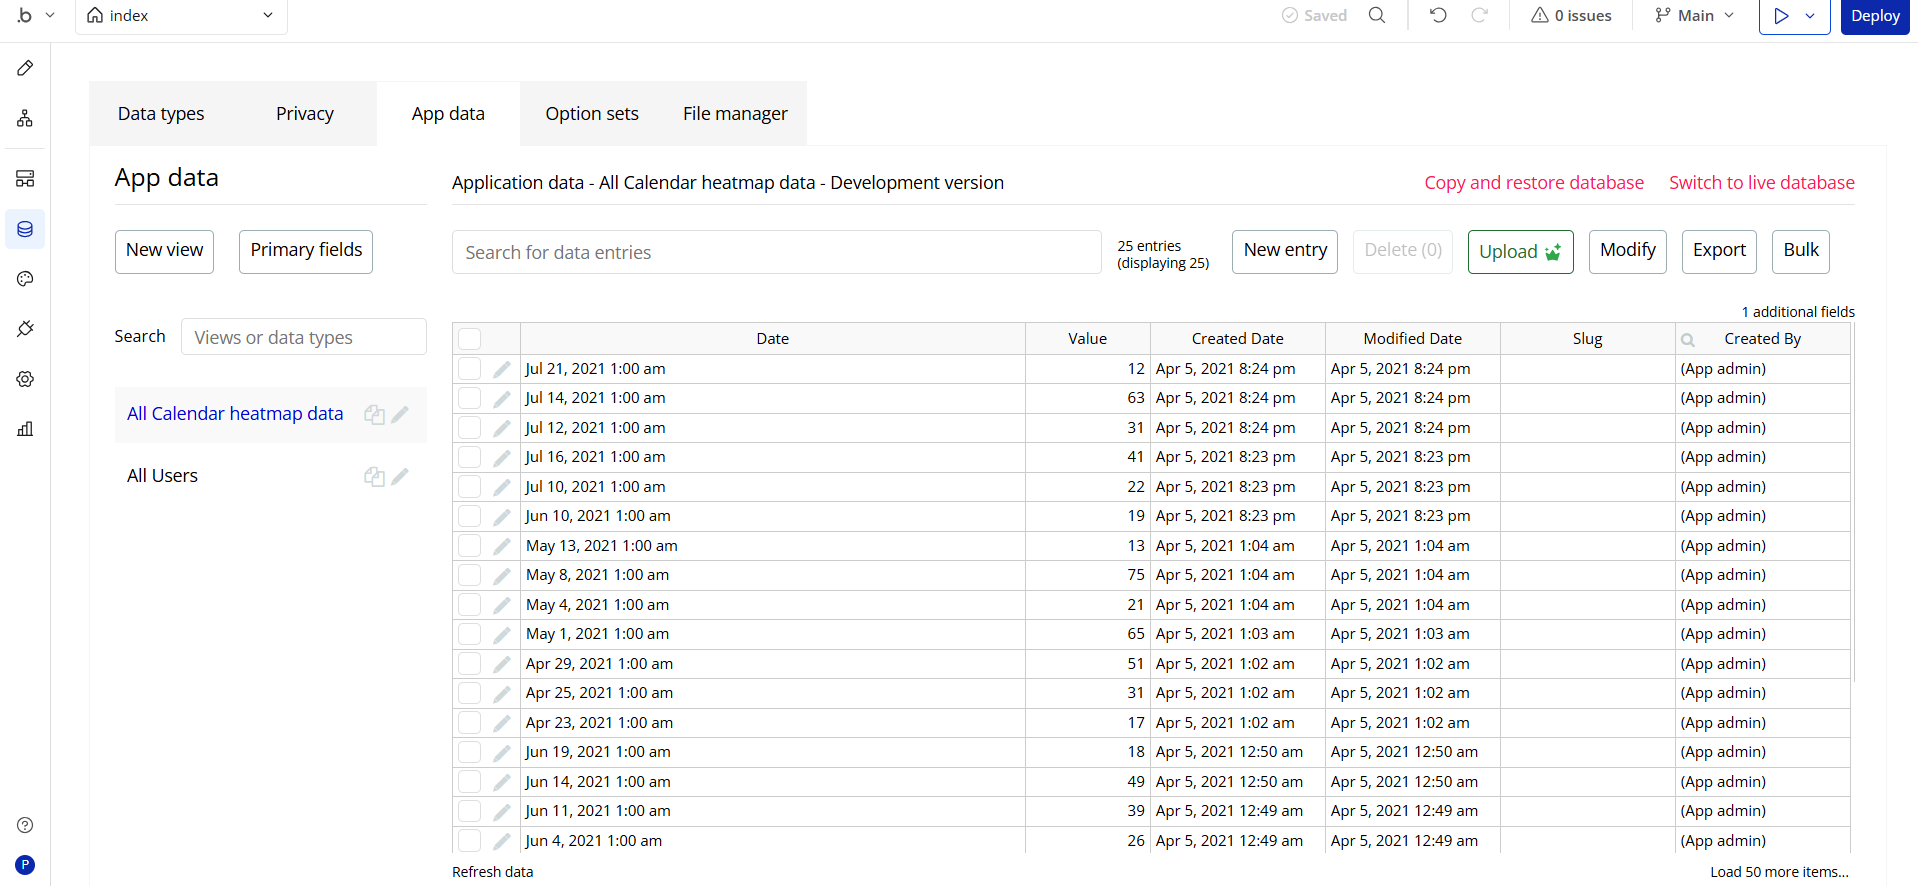
- Set up your data source:
- Create a data type (e.g., “Activity”).
- Add a Date field and a Value field (numeric).
- Create a list of these items to use as your data source.
- Configure the Heatmap Calendar:
- Set the Start date.
- Select your Data type.
- Connect your Data source.
- Map the Date and Value fields.
- Add interactivity:
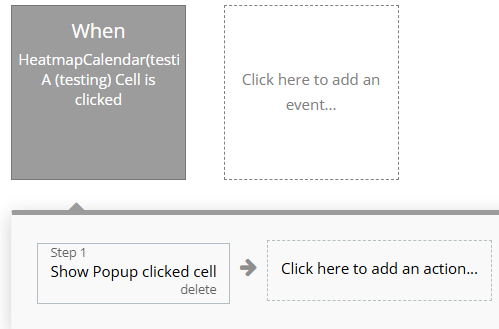
- Create a workflow that triggers on “Cell is clicked”.
- Use the “Clicked date” and “Clicked value” states to show more details.
- Add buttons with “Previous”, “Next”, and “Rewind” actions to navigate the calendar.
- Advanced implementation: Add custom navigation buttons.
- Add two buttons to your page for Previous and Next.
- Set their IDs in the element properties (Previous selector ID and Next selector ID).
- The calendar will automatically use these buttons for navigation.