Link to the plugin page: https://zeroqode.com/plugin/apex-heatmap-plugin-for-bubble-1728516220702x113751038649887000
Demo to preview the plugin:
Live Demo: https://pluginpreview.bubbleapps.io/heatmap
Introduction
APEX Heatmap is a powerful visualization plugin for Bubble that allows you to create interactive heatmap charts. Built on the ApexCharts library, this plugin enables you to represent data density through color variations in a grid format, making it ideal for visualizing complex datasets, identifying patterns, and spotting correlations in your data.
The plugin supports customizable color palettes, dynamic data binding, interactive features like data point selection, and various formatting options to make your heatmaps both visually appealing and informative.

How to setup
The APEX Heatmap plugin is ready to use as soon as you install it in your Bubble application. Follow these simple steps to get started:
- Install the plugin from the Bubble plugin marketplace.
- Add the APEX Heatmap element to your page.
- Configure the data source and customize visual settings as needed.
Plugin Element Properties
The APEX Heatmap plugin provides a visual element that displays your data in a heatmap format.
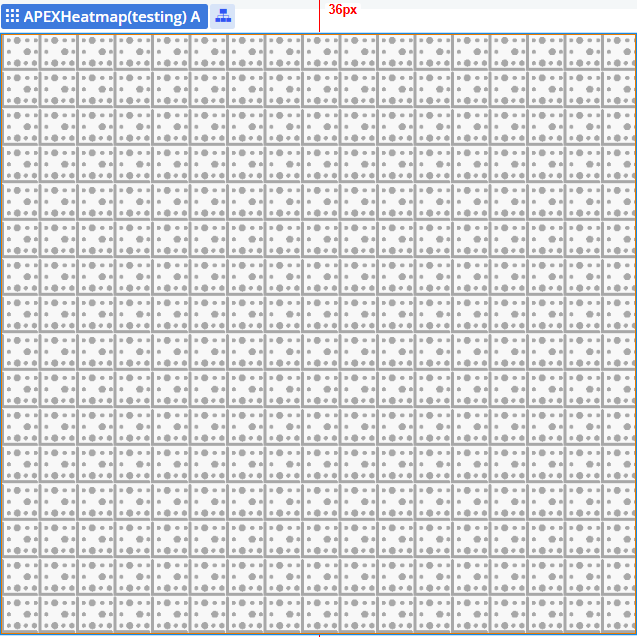
APEX Heatmap
Fields:
Title | Description | Type |
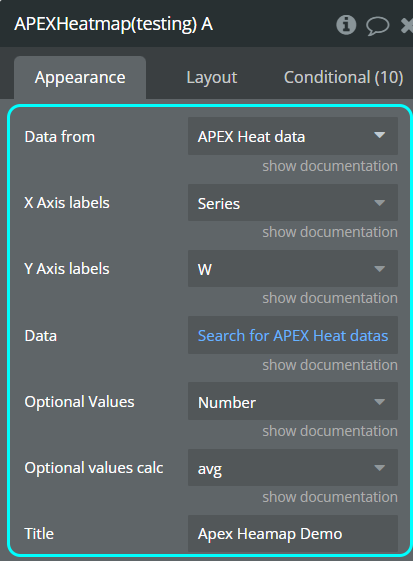
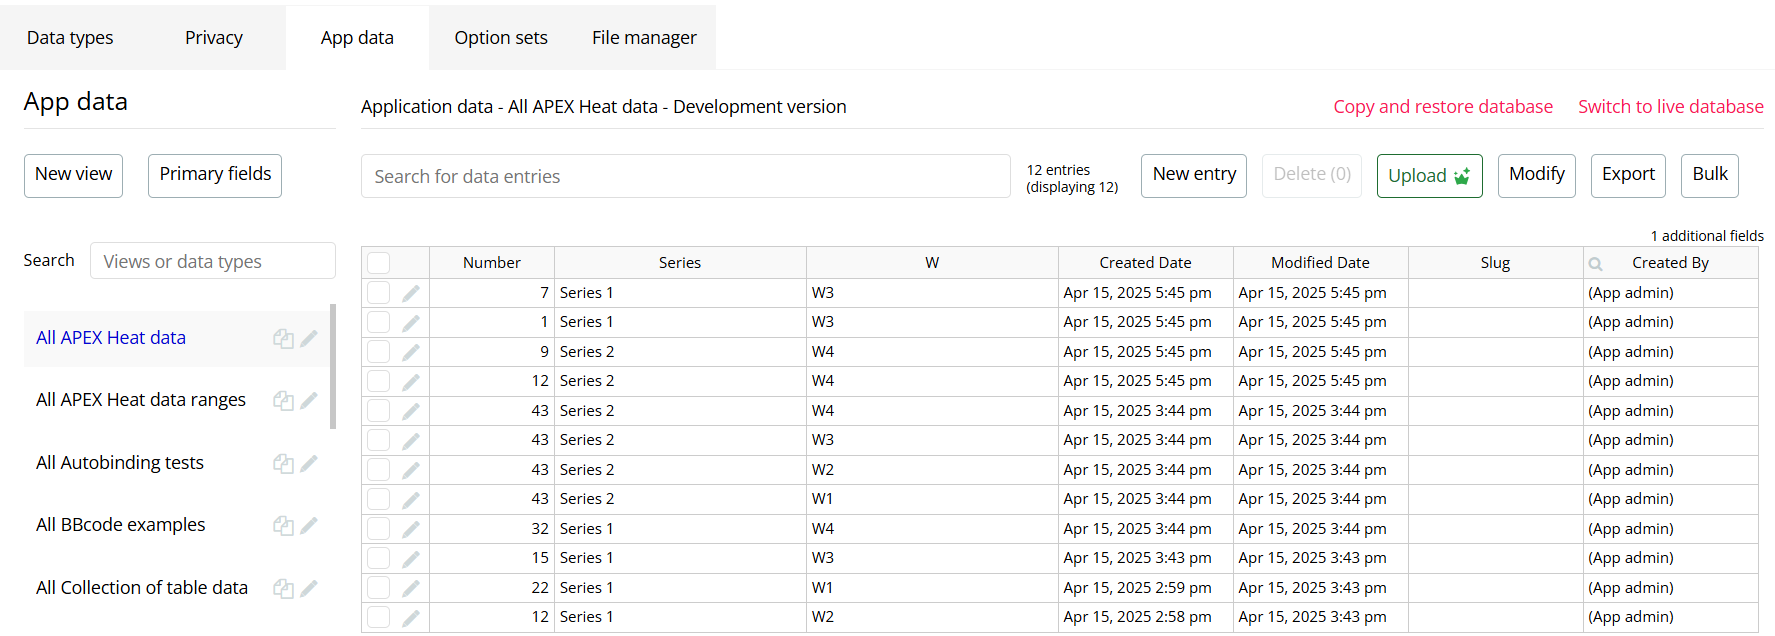
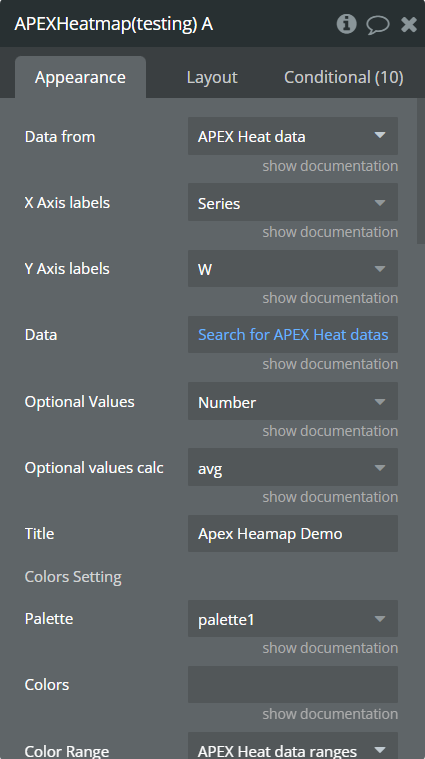
Data from | The data source for your heatmap | Custom Type |
X Axis labels | The field from your data source to use for X-axis labels | Text |
Y Axis labels | The field from your data source to use for Y-axis labels | Text |
Data | The list of data to be displayed in the heatmap | List |
Optional Values | A number field to sum or average instead of counting occurrences | Number |
Optional values calc | Choose how to calculate optional values: sum or average | Dropdown |
Title | The title of the heatmap chart | Text |
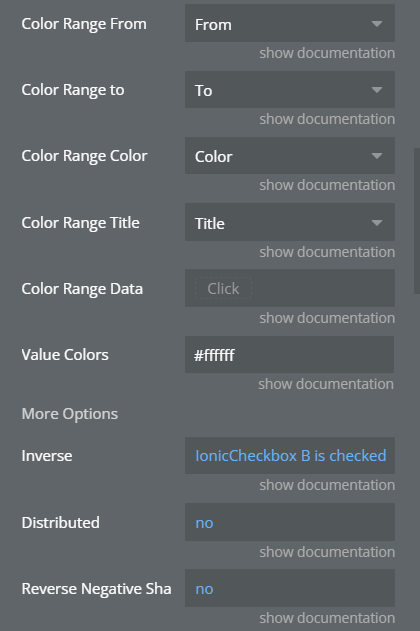
Colors Setting | Section label for color configuration | Label |
Palette | Choose from predefined color palettes (palette1 through palette10) | Dropdown |
Colors | Custom comma-separated list of hex color codes to override the palette | Text |
Color Range | Custom data source for defining specific color ranges | Custom Type |
Color Range From | The lower bound value for a color range | Number |
Color Range to | The upper bound value for a color range | Number |
Color Range Color | The hex color code for a color range | Text |
Color Range Title | The title for a color range | Text |
Color Range Data | List of color range data from your data source | List |
Value Colors | Color of the text values shown in the heatmap cells | Text |
More Options | Section label for additional options | Label |
Inverse | Inverts the color scale from rows to columns in multi-series heatmaps | Boolean |
Distributed | When enabled, each row has its own lowest and highest range | Boolean |
Reverse Negative Shade | Makes negative values darker for higher values | Boolean |
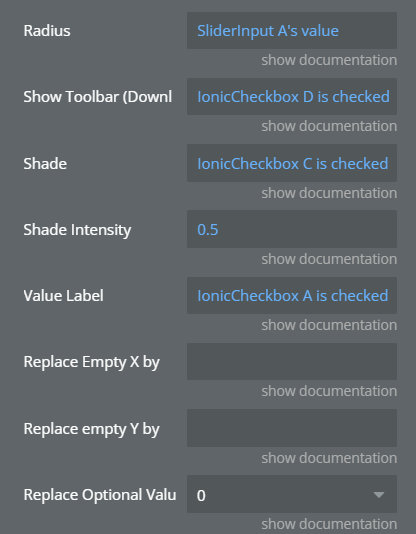
Radius | Border radius for heatmap cells | Number |
Show Toolbar (Download) | Shows download options toolbar | Boolean |
Shade | Enables or disables color shading | Boolean |
Shade Intensity | Intensity of the shading effect (0 to 1) | Number |
Value Label | Show or hide data values in cells | Boolean |
Replace Empty X by | Text to show when X-axis labels are empty (defaults to “Unassigned”) | Text |
Replace empty Y by | Text to show when Y-axis labels are empty (defaults to “Unassigned”) | Text |
Replace Optional Values by | How to handle empty optional values (0, avg, or median) | Dropdown |
Element Actions
Refresh data
Updates the heatmap with new data without reloading the page.
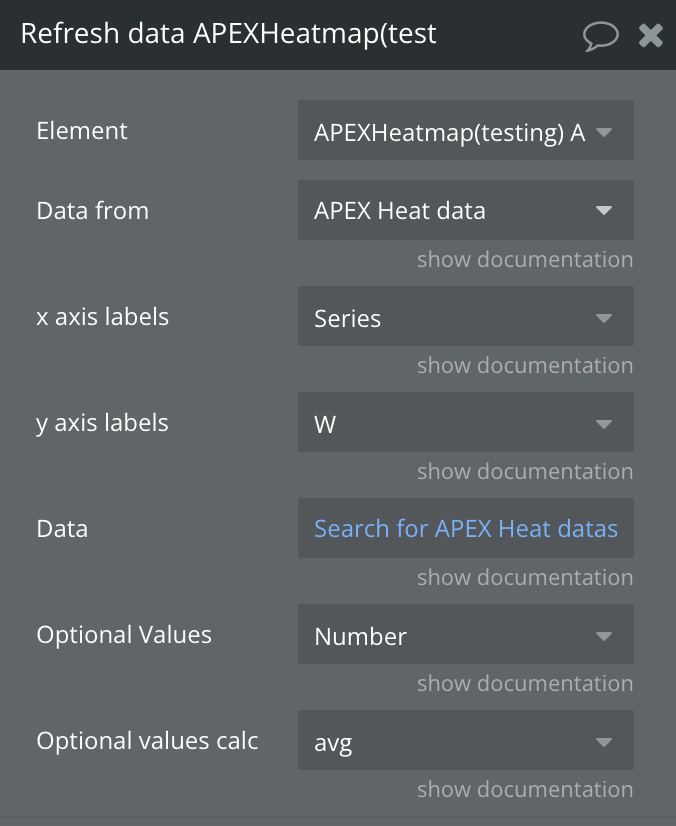
Fields:
Title | Description | Type |
data fromD | The data source for your heatmap | Custom Type |
X axis labels | The field from your data source to use for X-axis labels | Text |
Y axis labels | The field from your data source to use for Y-axis labels | Text |
Data | The list of data to be displayed in the heatmap | List |
Optional values | A number field to sum or average instead of counting occurrences | Number |
Value calc | Choose how to calculate optional values: sum or average | Dropdown |
Exposed states
Name | Description | Type |
Selected label | The label of the currently selected data point | Text |
Selected Serie | The series name of the currently selected data point | Text |
Selected Value | The value of the currently selected data point | Number |
Element Events
Name | Description |
Data Point Clicked | Triggered when a data point in the heatmap is clicked. You can access the selected point’s label, series, and value through the element’s states. |