
✅
Demo to preview the plugin:
✅
Introduction
The Advanced Textual Flowcharts plugin allows you to create beautiful, dynamic, and interactive flowcharts directly inside your Bubble application using Mermaid.js syntax. This means you can design flowcharts using simple plain-text instructions — ideal for automation, AI-driven content generation, and developer workflows.
With full support for zooming, panning, color customization, dark mode, font controls, and SVG export, this plugin makes it easy to render professional flowcharts that adapt to your app's design and user experience.
This plugin is perfect for:
- Process diagrams
- Onboarding flows
- Organizational charts
- Data pipelines
- System architecture diagrams
- Flowcharts generated via AI models (ChatGPT, Claude, etc.)
Key Features
- Mermaid.js Syntax Support
Build flowcharts from clean text-based definitions, ideal for automated or AI-generated diagrams.
- Interactive Zoom & Pan
Users can zoom in/out and navigate through large flowcharts effortlessly.
- Adjustable Sensitivity
Customize zoom sensitivity and panning speed.
- Save Flowcharts as SVG
Export rendered flowcharts as SVG files that can be saved in Bubble’s storage or downloaded by users.
- Dark Mode & Color Customization
Fine-tune primary, secondary, tertiary, background, border, and text colors.
- Font Styling Controls
Adjust font family, font size, and note styling within the flowchart.
- Reset Zoom Button
Provide users with a one-click way to return the diagram to its default view.
- Dynamic Rendering
Generate or update flowcharts in real time, including charts created via AI prompts.

How to Set Up
Step 1. Install the Plugin
- Open your Bubble Editor.
- From the left panel, go to the Plugins tab.
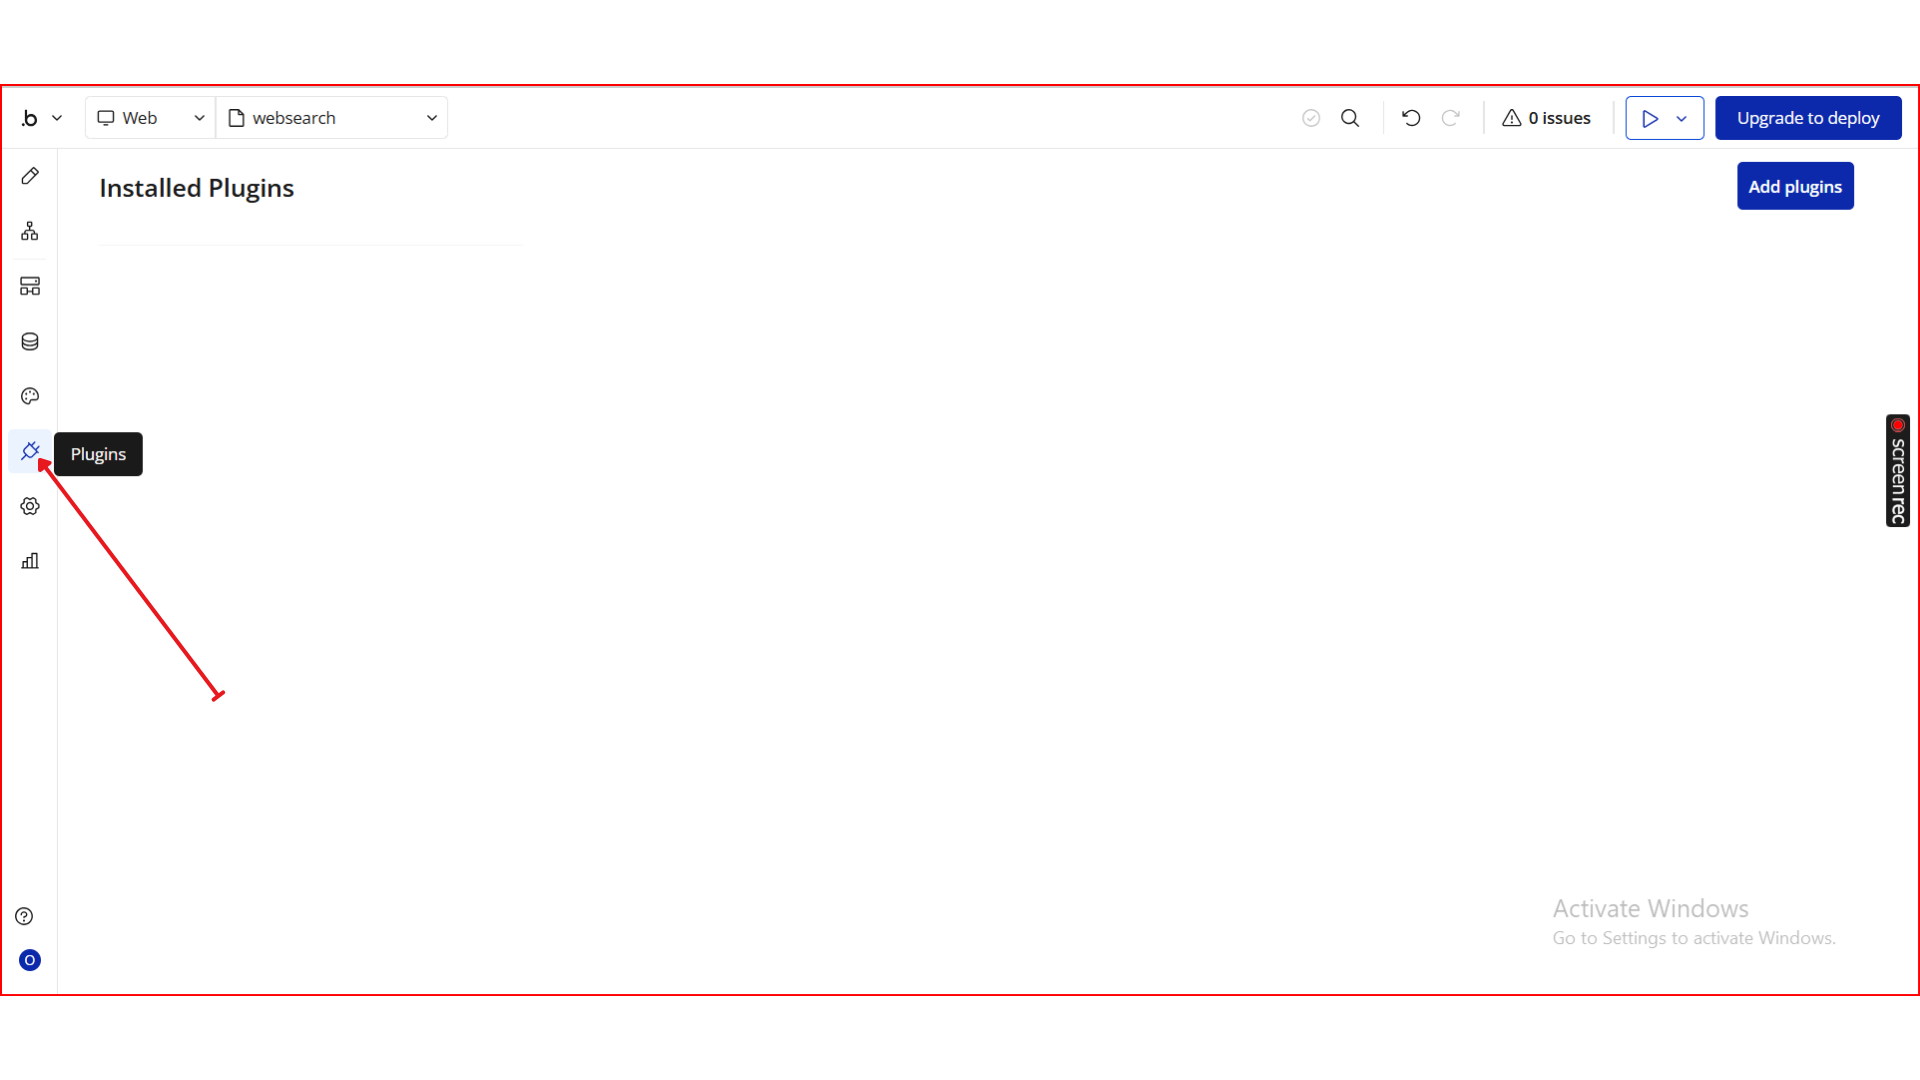
- Click the Add Plugins button.
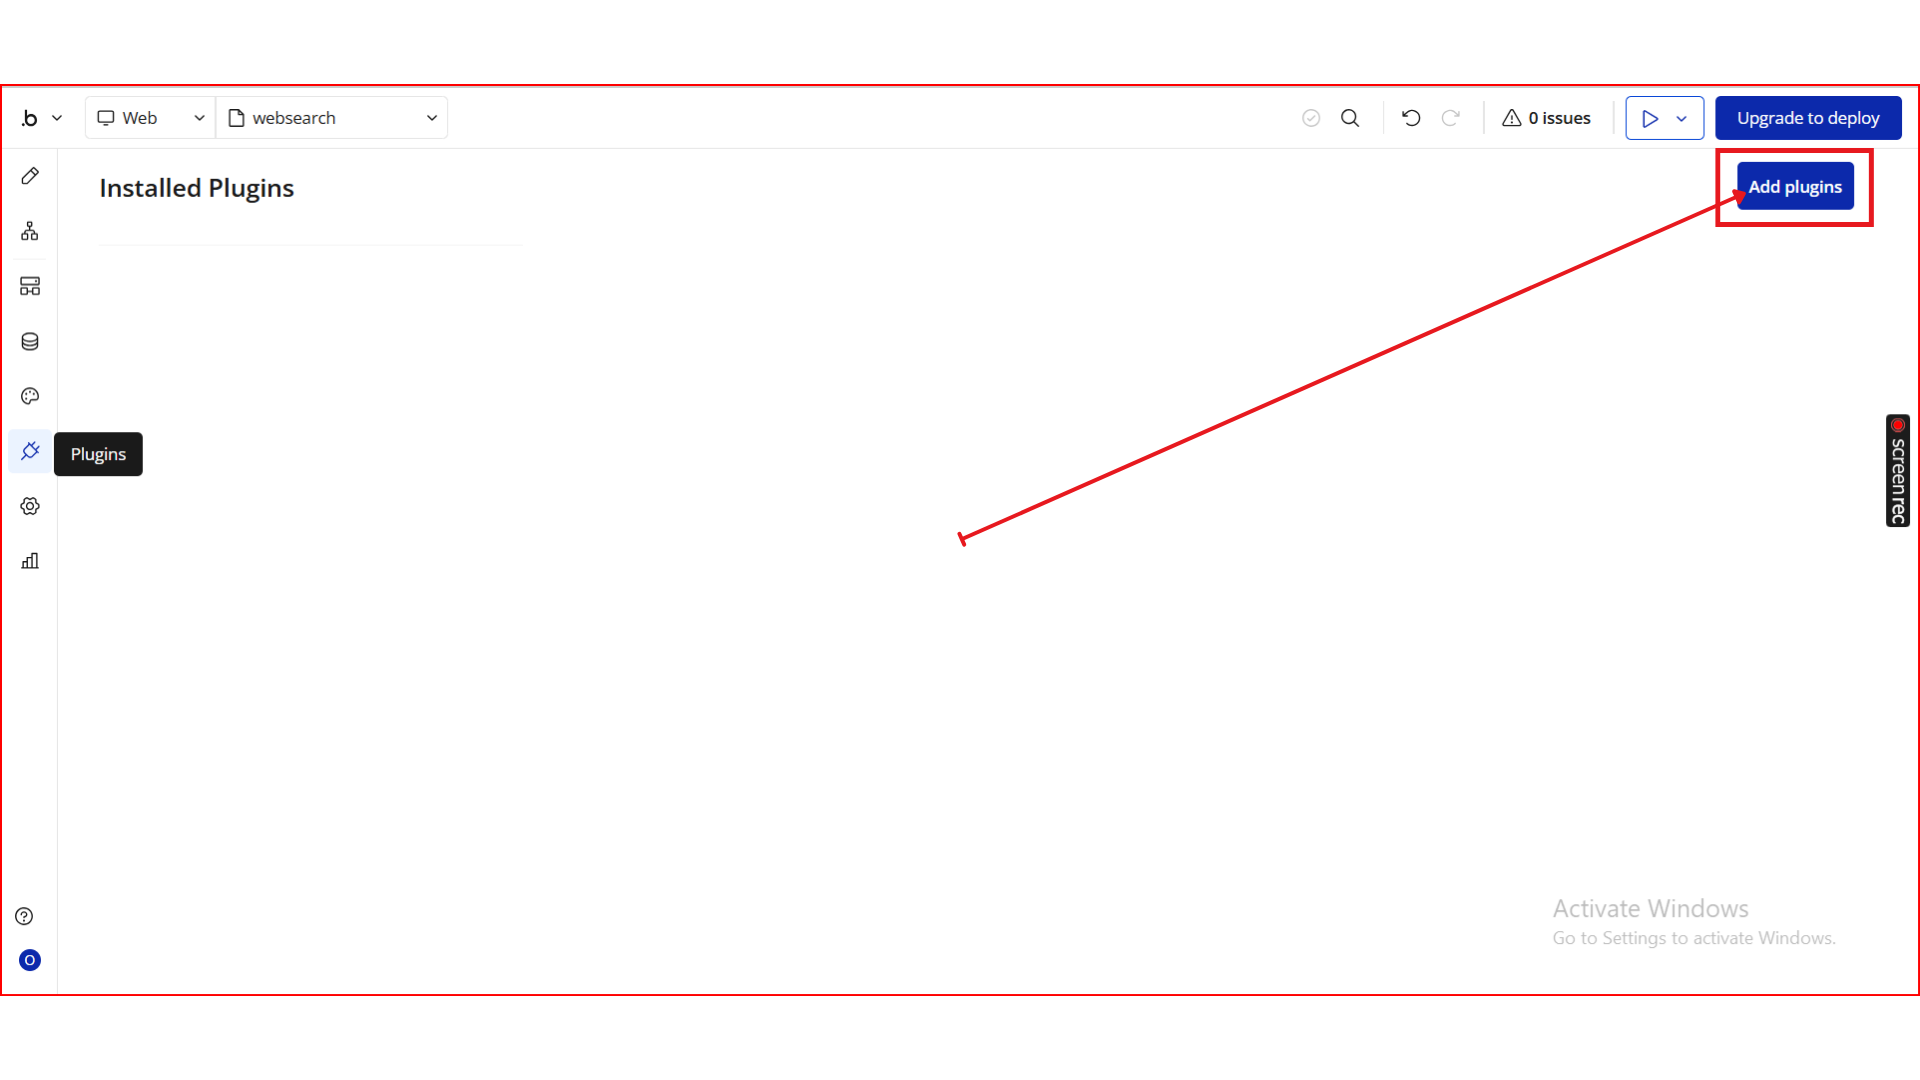
- In the search bar, type Advanced Textual Flowcharts.
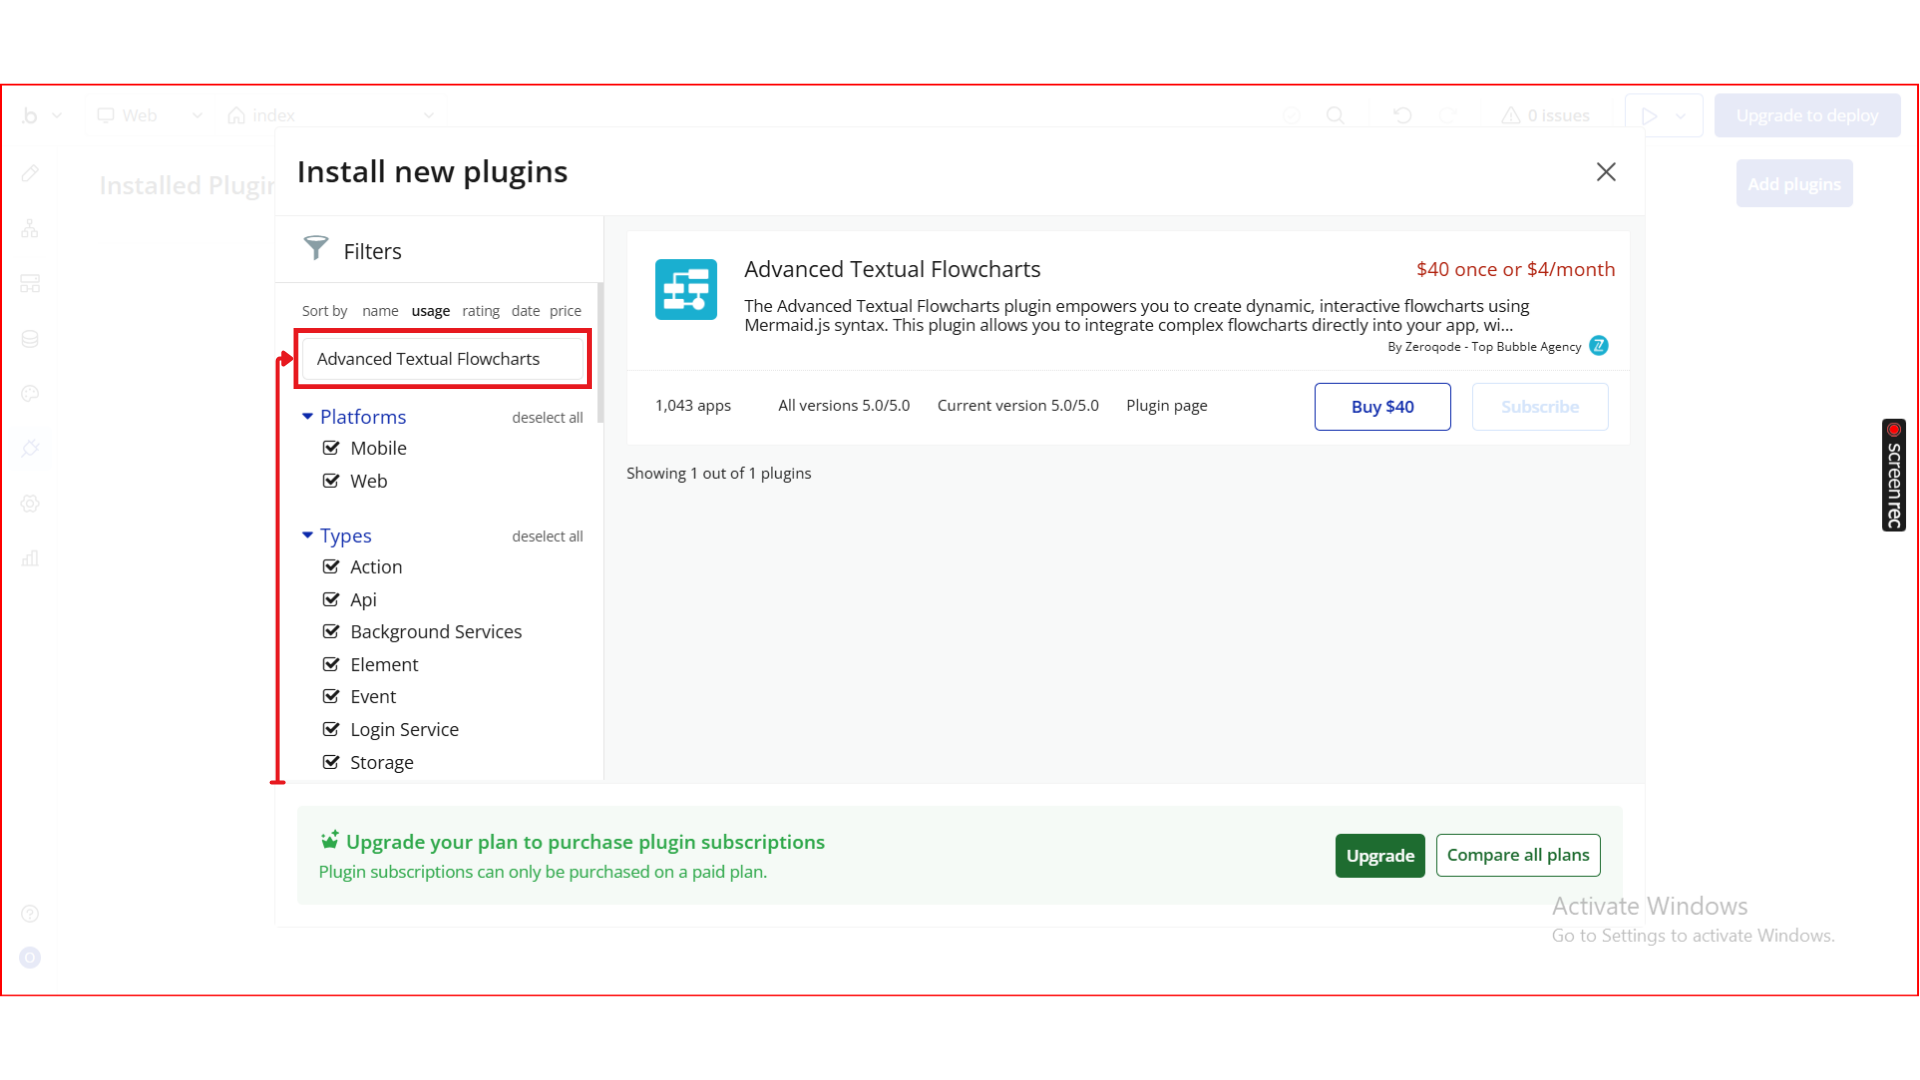
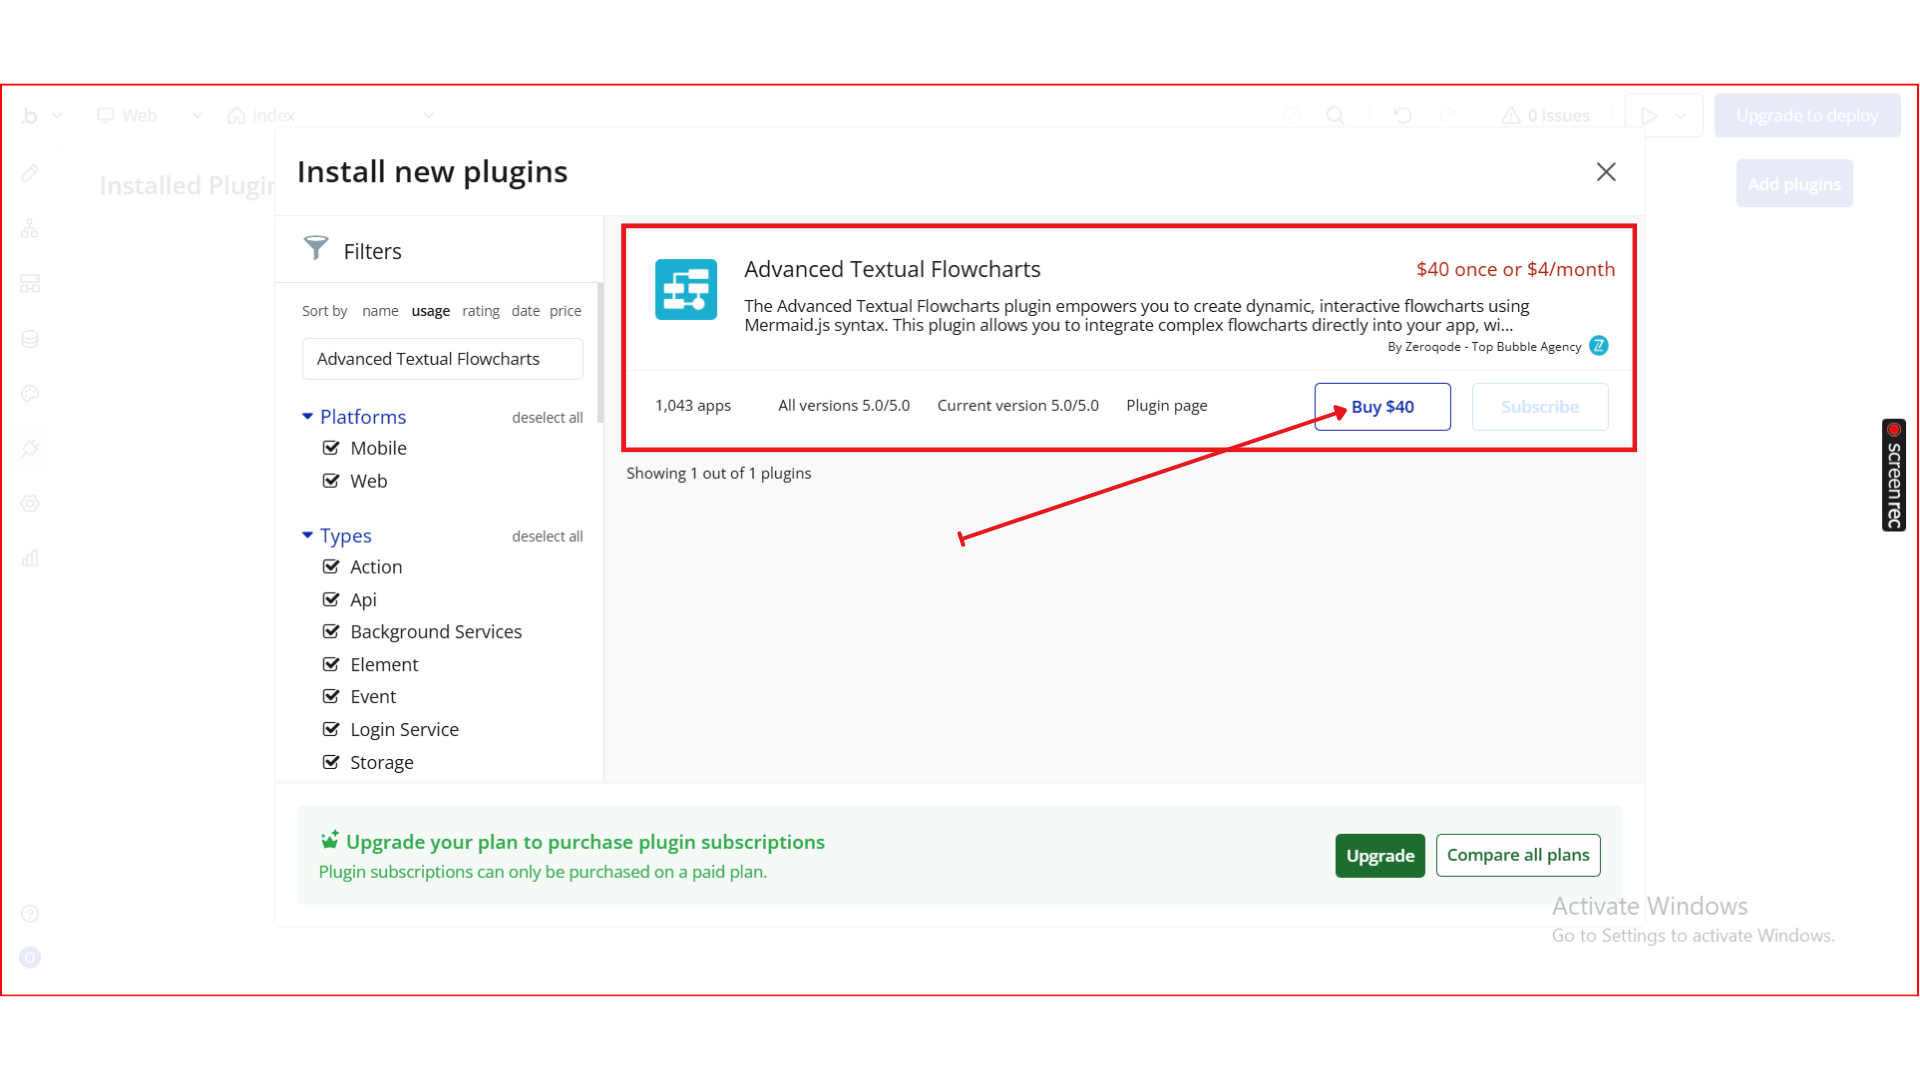
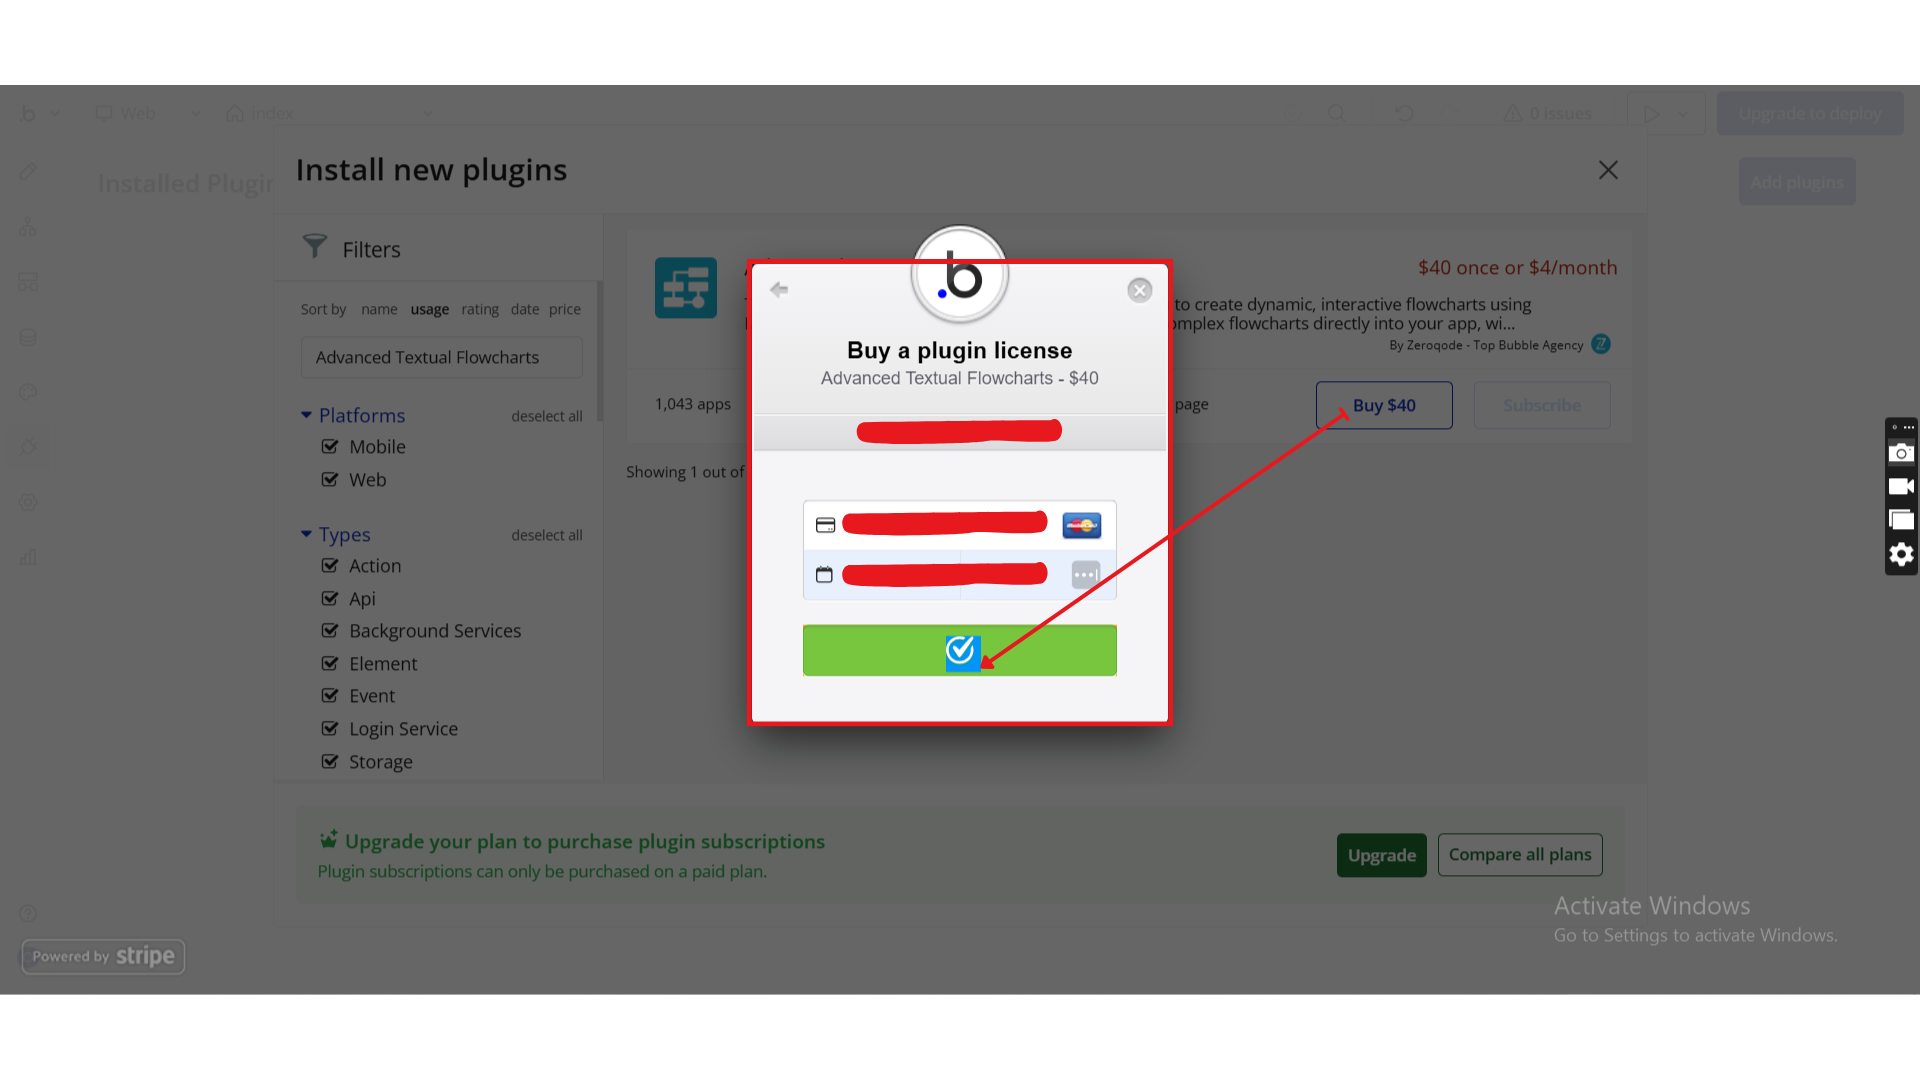
- Locate the Advanced Textual Flowcharts plugin by Zeroqode and click Install (or Buy if it’s a paid plan).
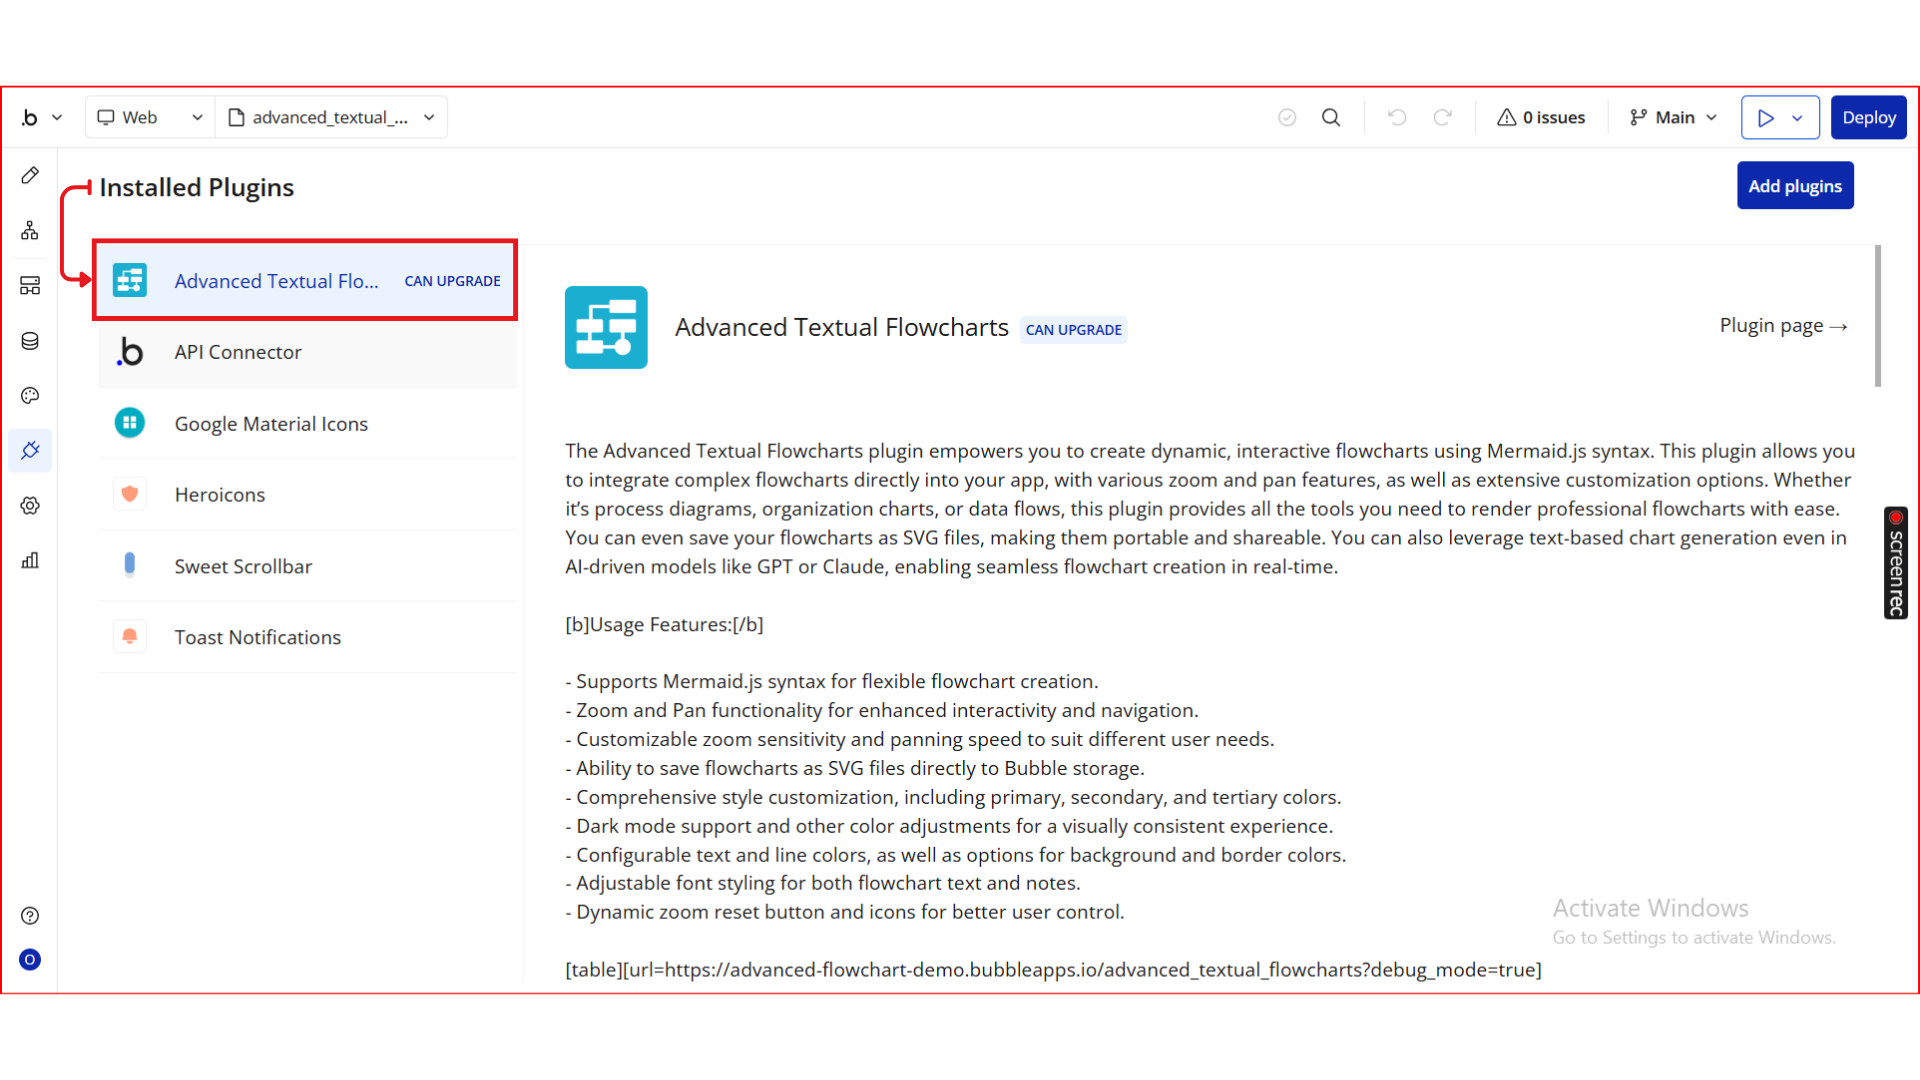
- After installation, it will appear under Installed plugins.
Step 2. Add the Element to Your Page
- Go to the Design tab.
- From the Visual Elements/Plugins section, locate the Textual Flowcharts element.
- Drag and drop the Textual Flowcharts element onto your page.
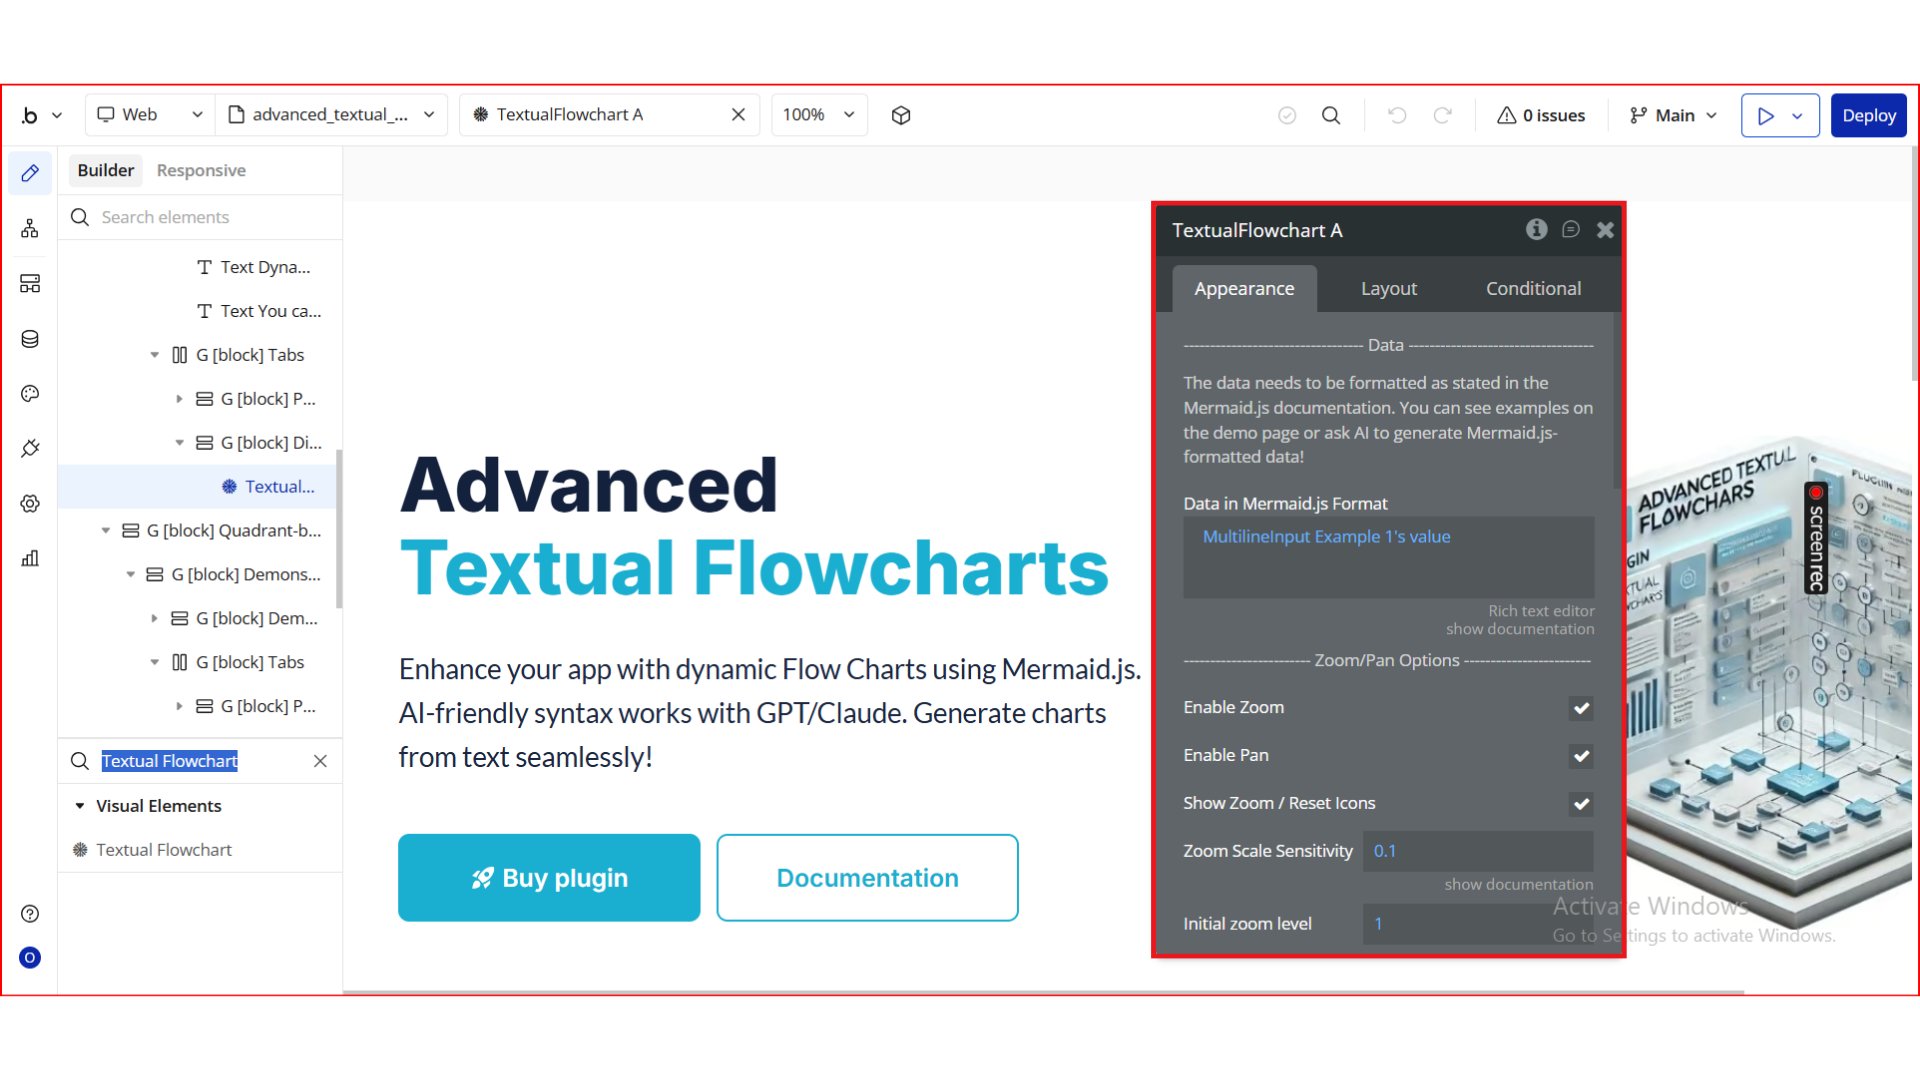
Step 3. Configure the Element Properties
Below is a complete list of the Textual Flowcharts element properties.
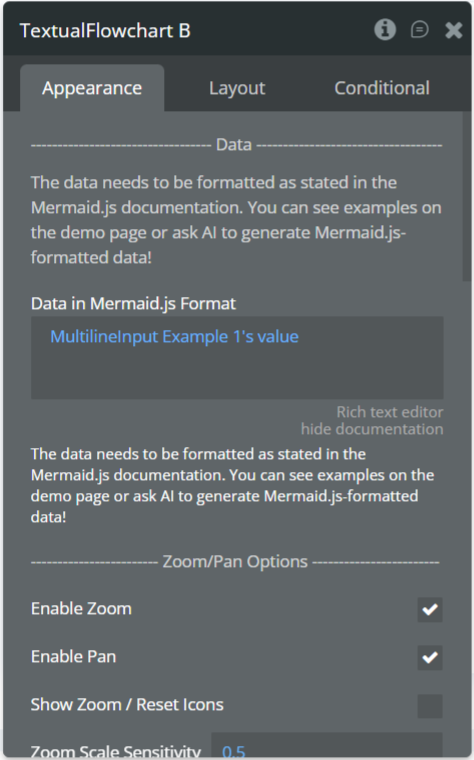
Data
Title | Description | Type |
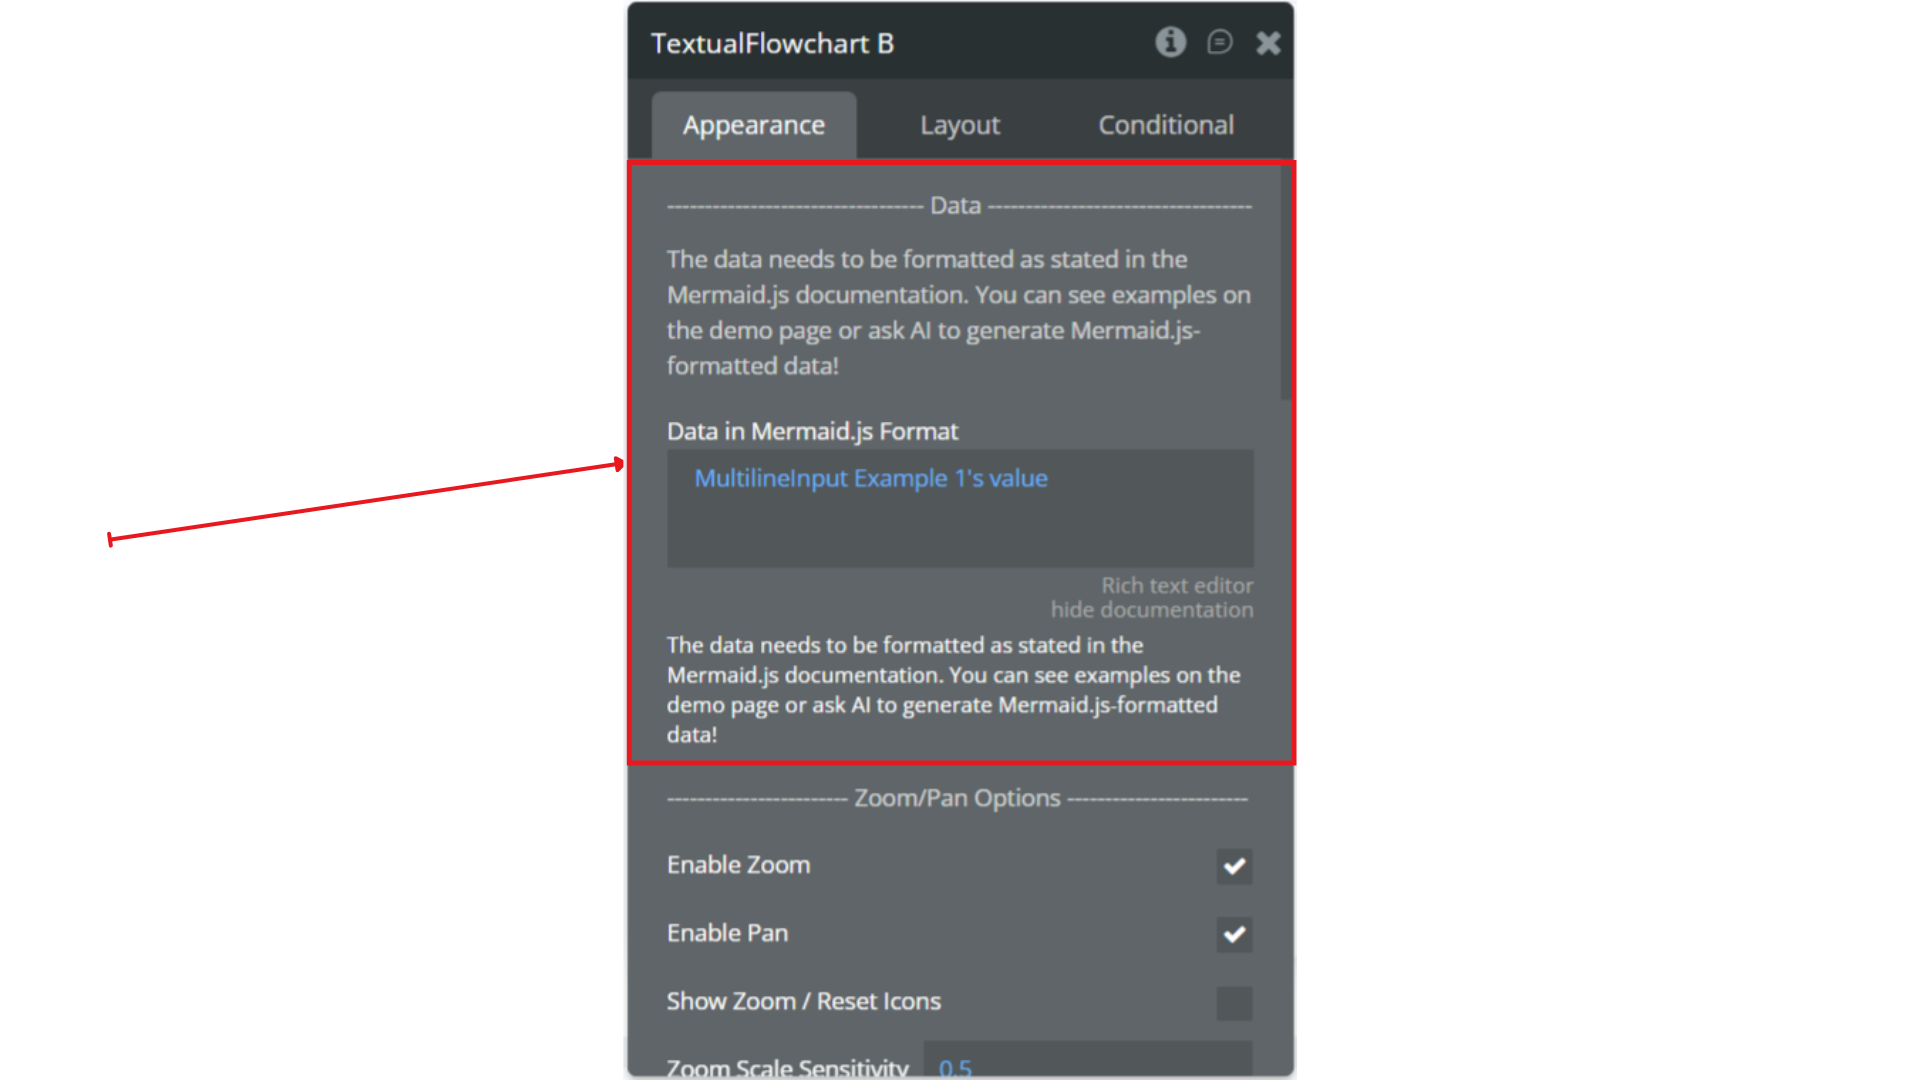
Data in Mermaid.js Format | The Mermaid.js script used to render the flowchart. You can generate this manually or via AI. | Text |
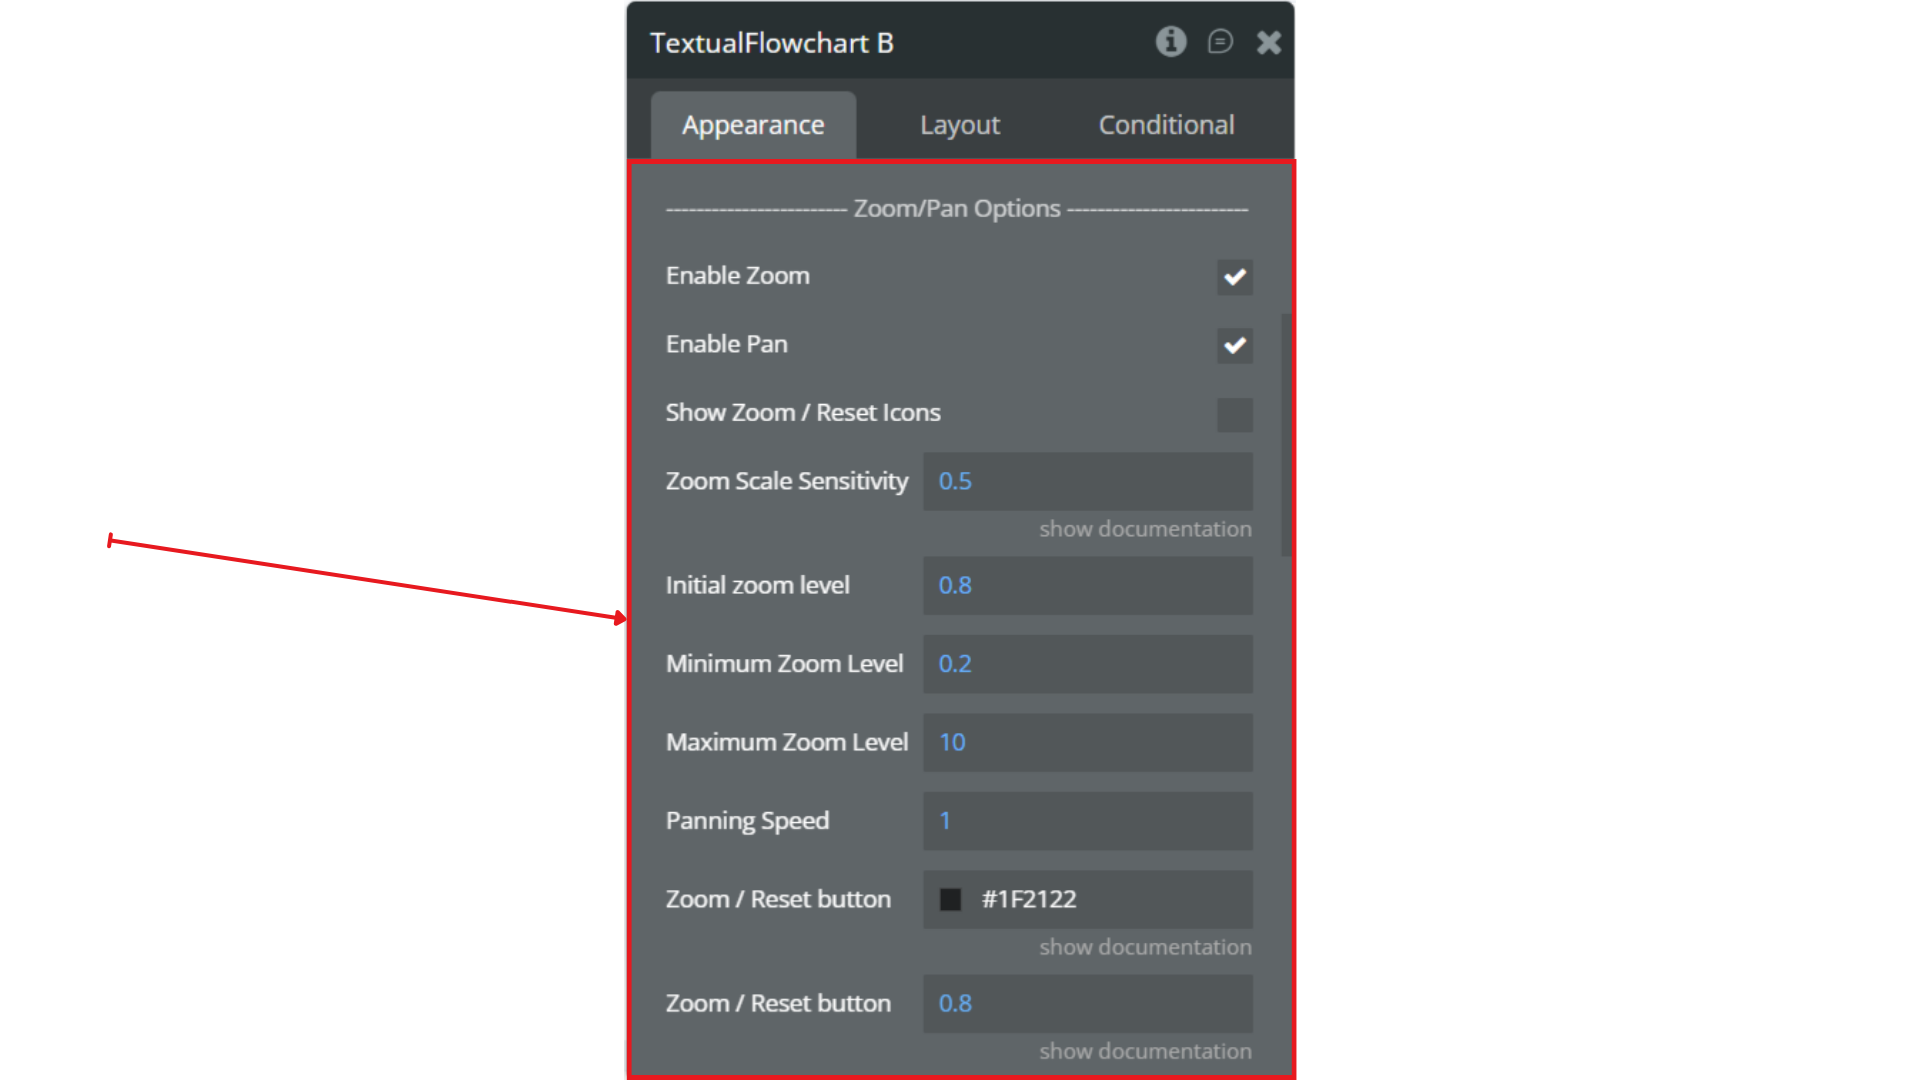
Zoom / Pan Options
Title | Description | Type |
Enable Zoom | Allows users to zoom in/out of the flowchart. | Checkbox |
Enable Pan | Allows dragging/panning across the flowchart. | Checkbox |
Show Zoom / Reset Icons | Displays zoom-in, zoom-out, and reset buttons. | Checkbox |
Zoom Scale Sensitivity | Controls how much zoom occurs per scroll or button press. | Number |
Initial Zoom Level | Base zoom level when the chart loads. | Number |
Minimum Zoom Level | Prevents zooming out beyond this value. | Number |
Maximum Zoom Level | Prevents zooming in beyond this value. | Number |
Panning Speed | Controls how fast the chart moves while panning. | Number |
Zoom / Reset Button Color | UI color for zoom/reset icons. | Color |
Zoom / Reset Button Opacity | Transparency level for control buttons. | Number |
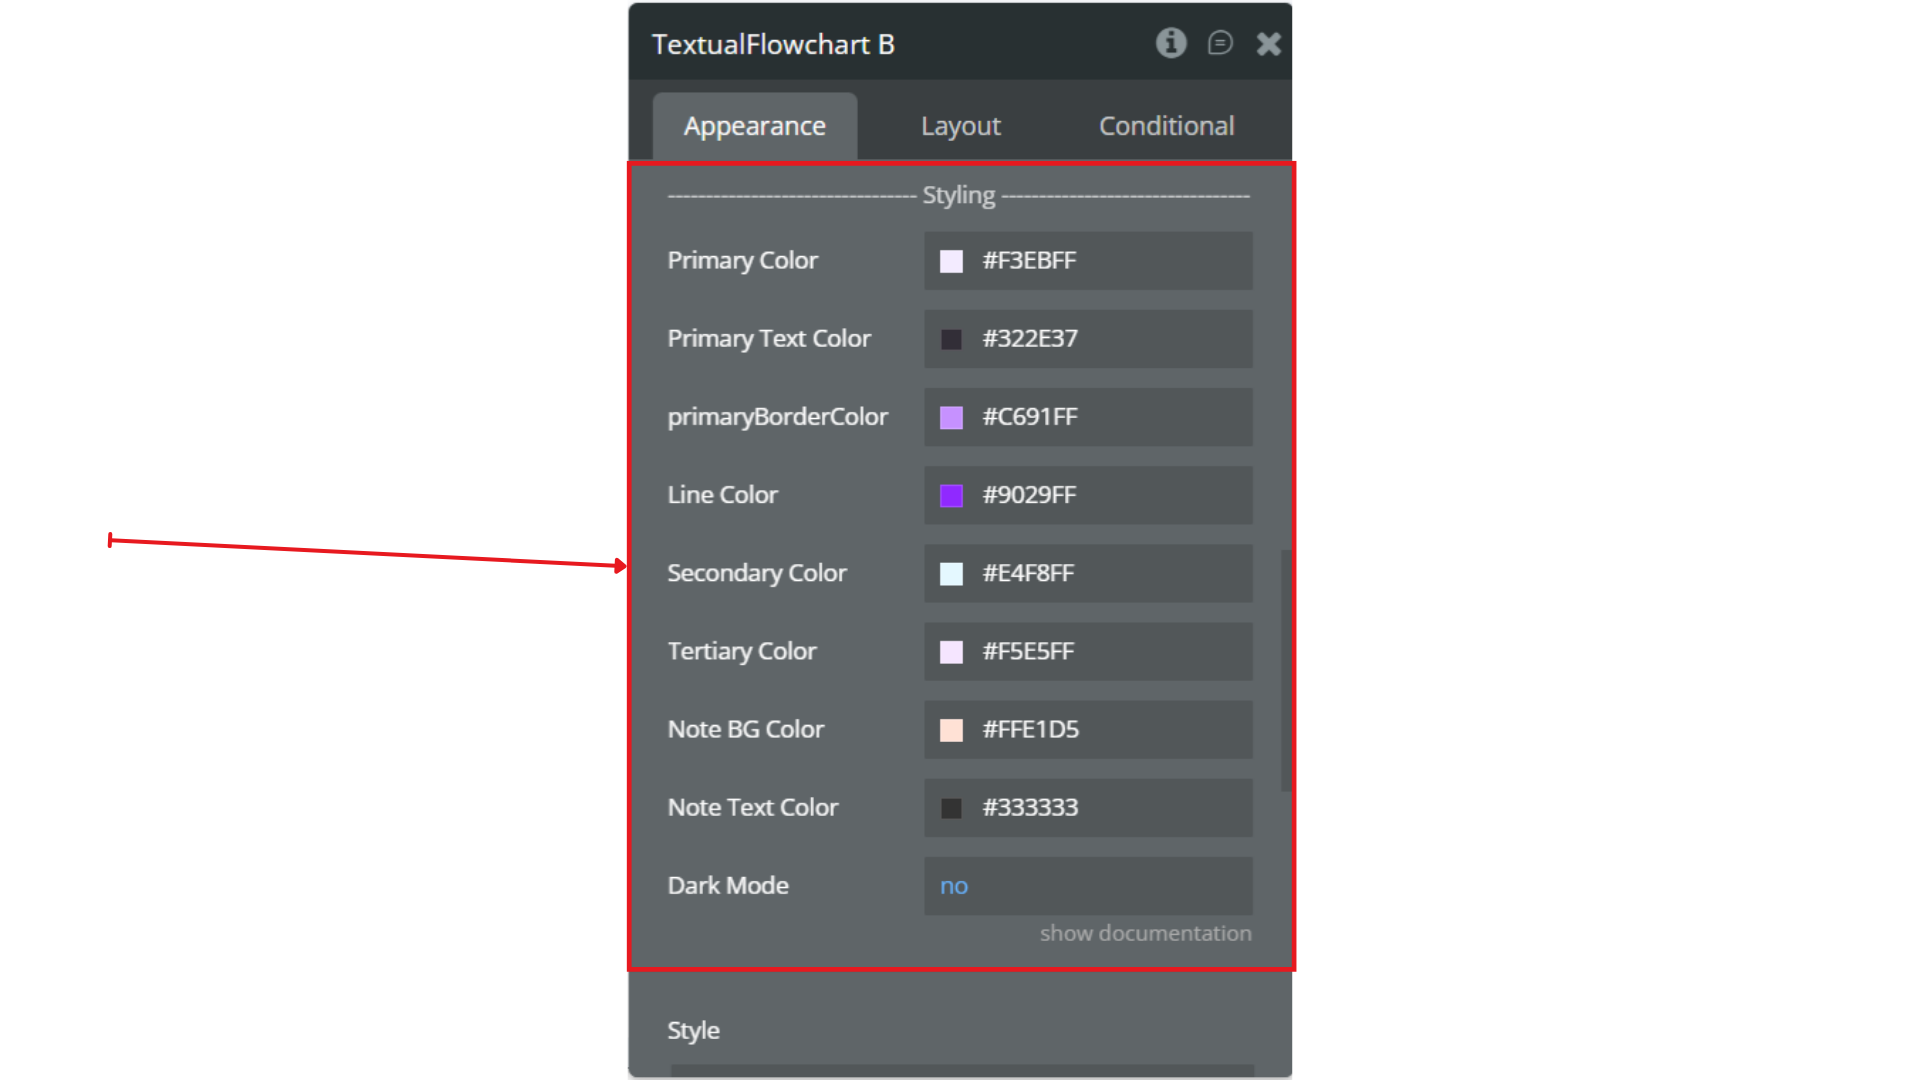
Styling
Title | Description | Type |
Primary Color | Main element color inside the flowchart. | Color |
Primary Text Color | Text color for primary nodes. | Color |
Primary Border Color | Border color for primary nodes. | Color |
Line Color | Color of arrows and connecting lines. | Color |
Secondary Color | Secondary node background color. | Color |
Tertiary Color | Secondary supporting UI color. | Color |
Note BG Color | Background color for note/annotation blocks. | Color |
Note Text Color | Text color for note blocks. | Color |
Dark Mode | Enables dark-mode color rendering. | Checkbox |
Step 4. Use the Plugin in Workflows & Dynamic Expressions
Below are the key ways to use the plugin in your workflows.
4.1 Dynamically Generate & Render Charts
You can render any Mermaid.js diagram in real time by updating the Data in Mermaid.js Format field.
Example use cases:
- The user types Mermaid.js text into an input
- AI generates Mermaid.js syntax for the diagram
- A template diagram is loaded from your database
Workflow Example:
When Input A’s value is changed → Set State → Update the Textual Flowchart’s data.
sqlchart.update data = Input A's value
This instantly redraws the diagram.
4.2 Built-In Demonstration Categories
The demo includes several pre-configured examples.
You can replicate or generate these dynamically using workflows:
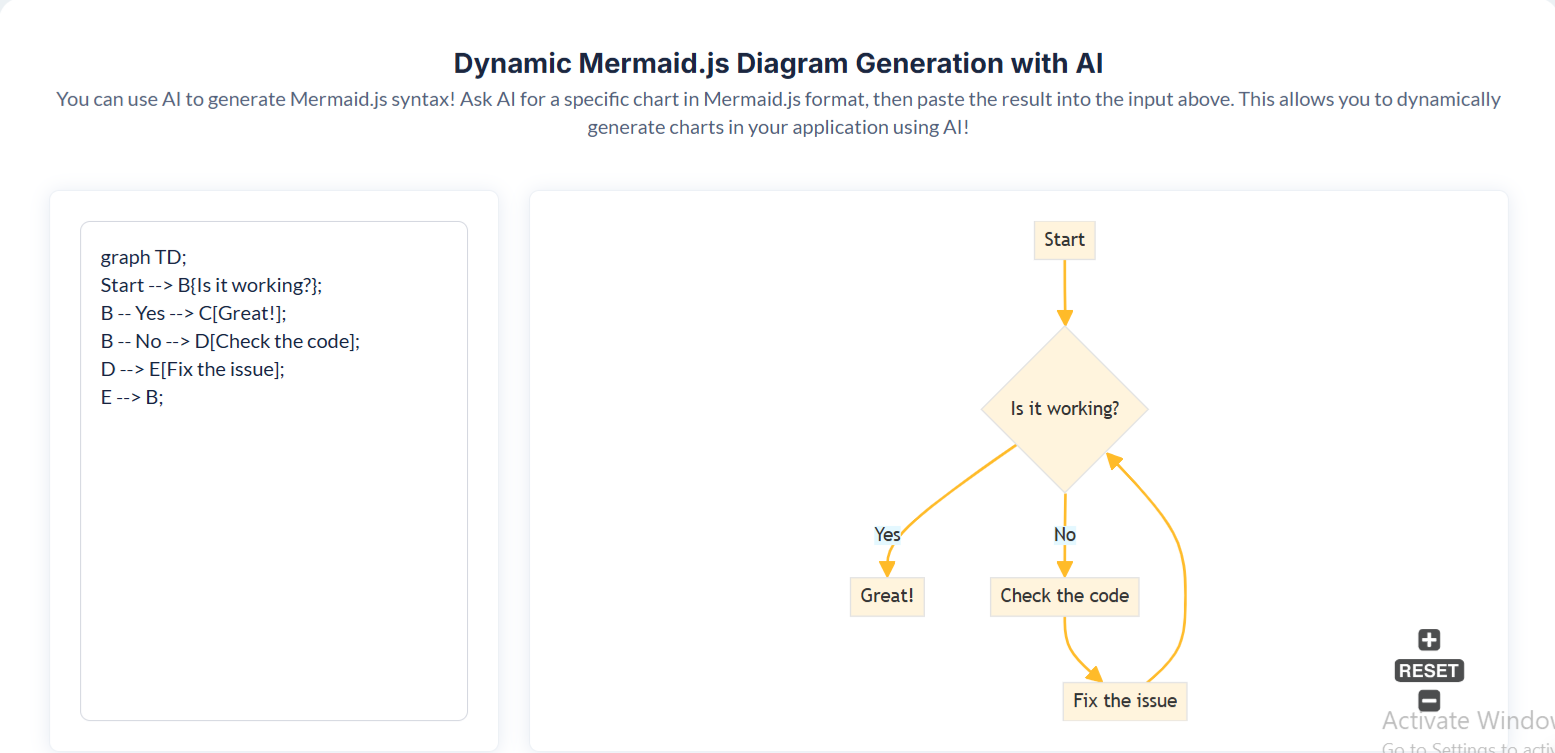
- Dynamic Mermaid (AI-Generated)
- Users paste AI-generated Mermaid.js text
- The diagram updates automatically
- Great for tools that accept prompts like:
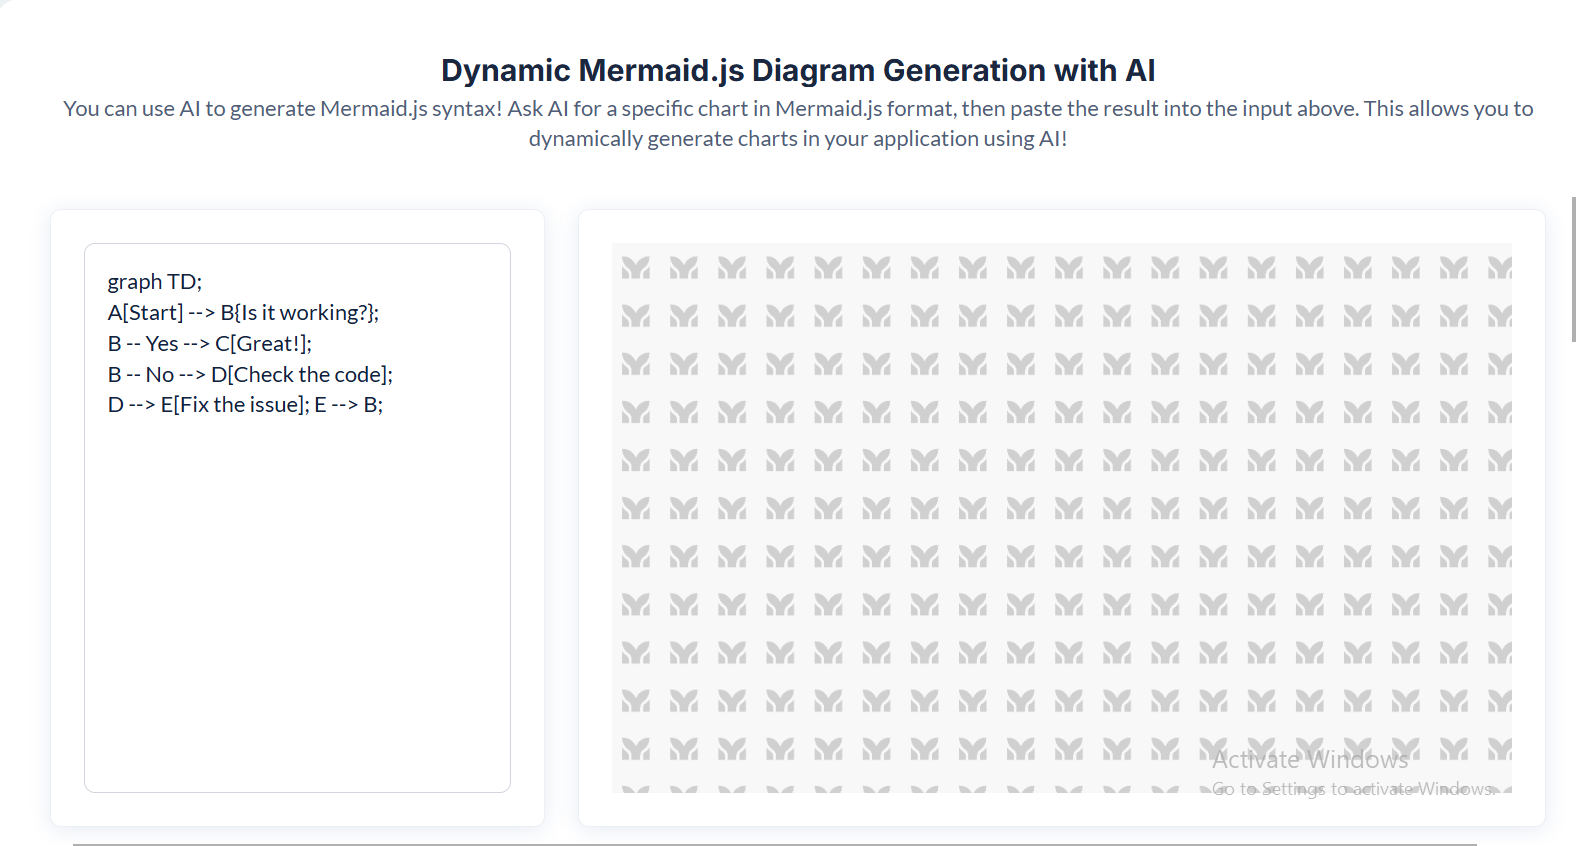
“Draw an approval workflow with 4 steps”
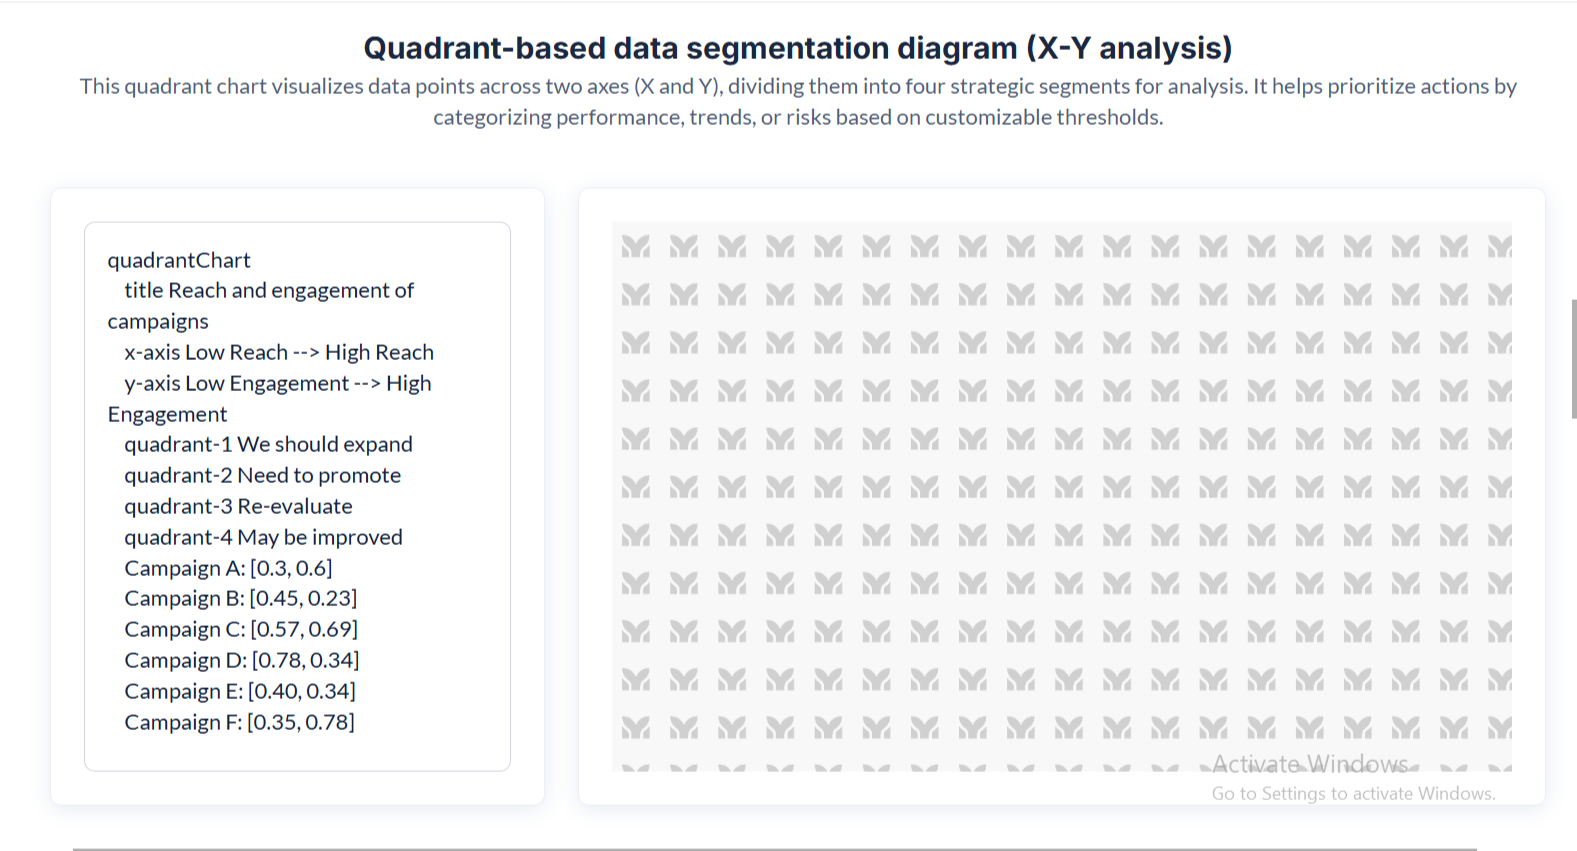
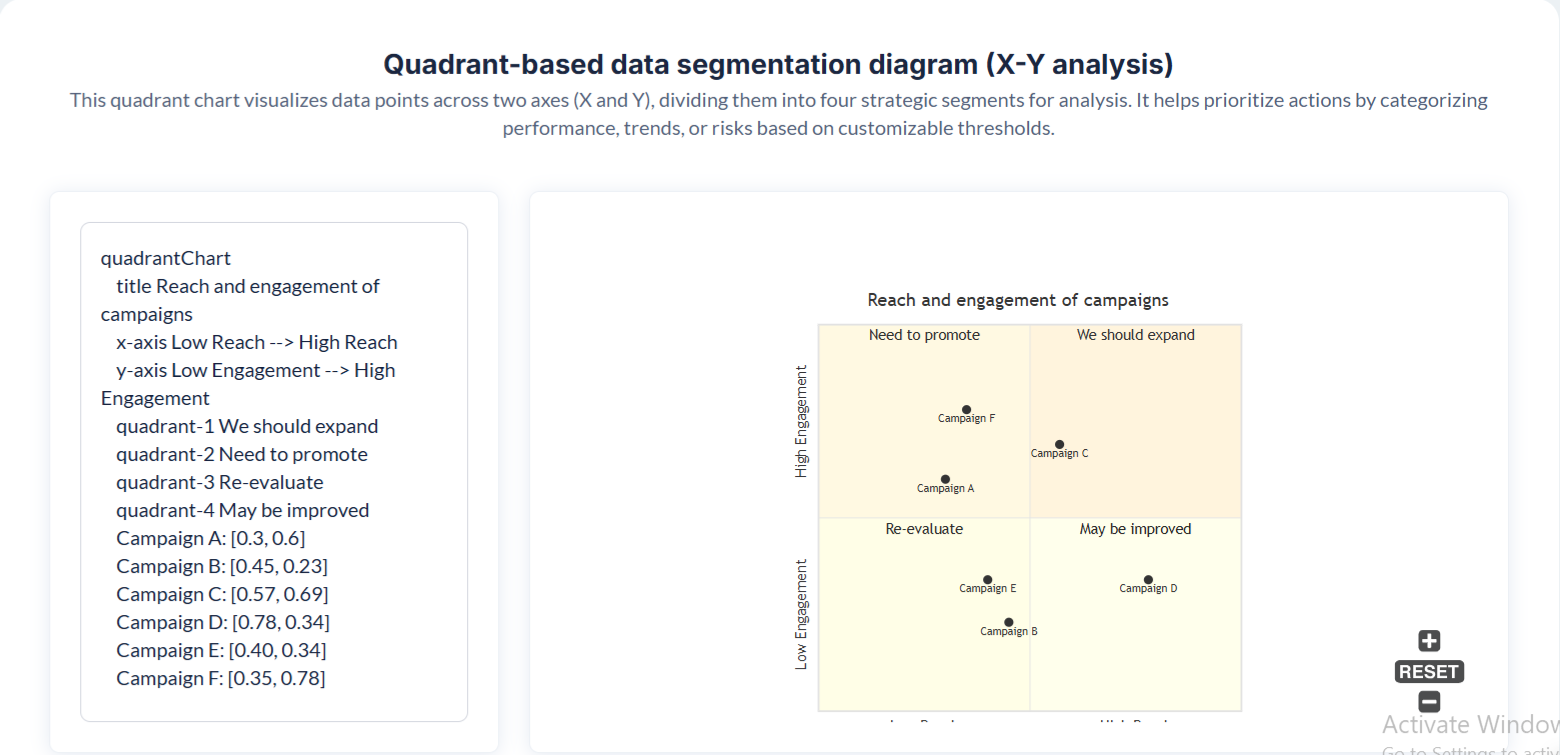
- Quadrant-Based Diagram
- Useful for strategy maps, business matrices, etc.
- Mermaid.js supports quadrant layouts via custom node positioning.
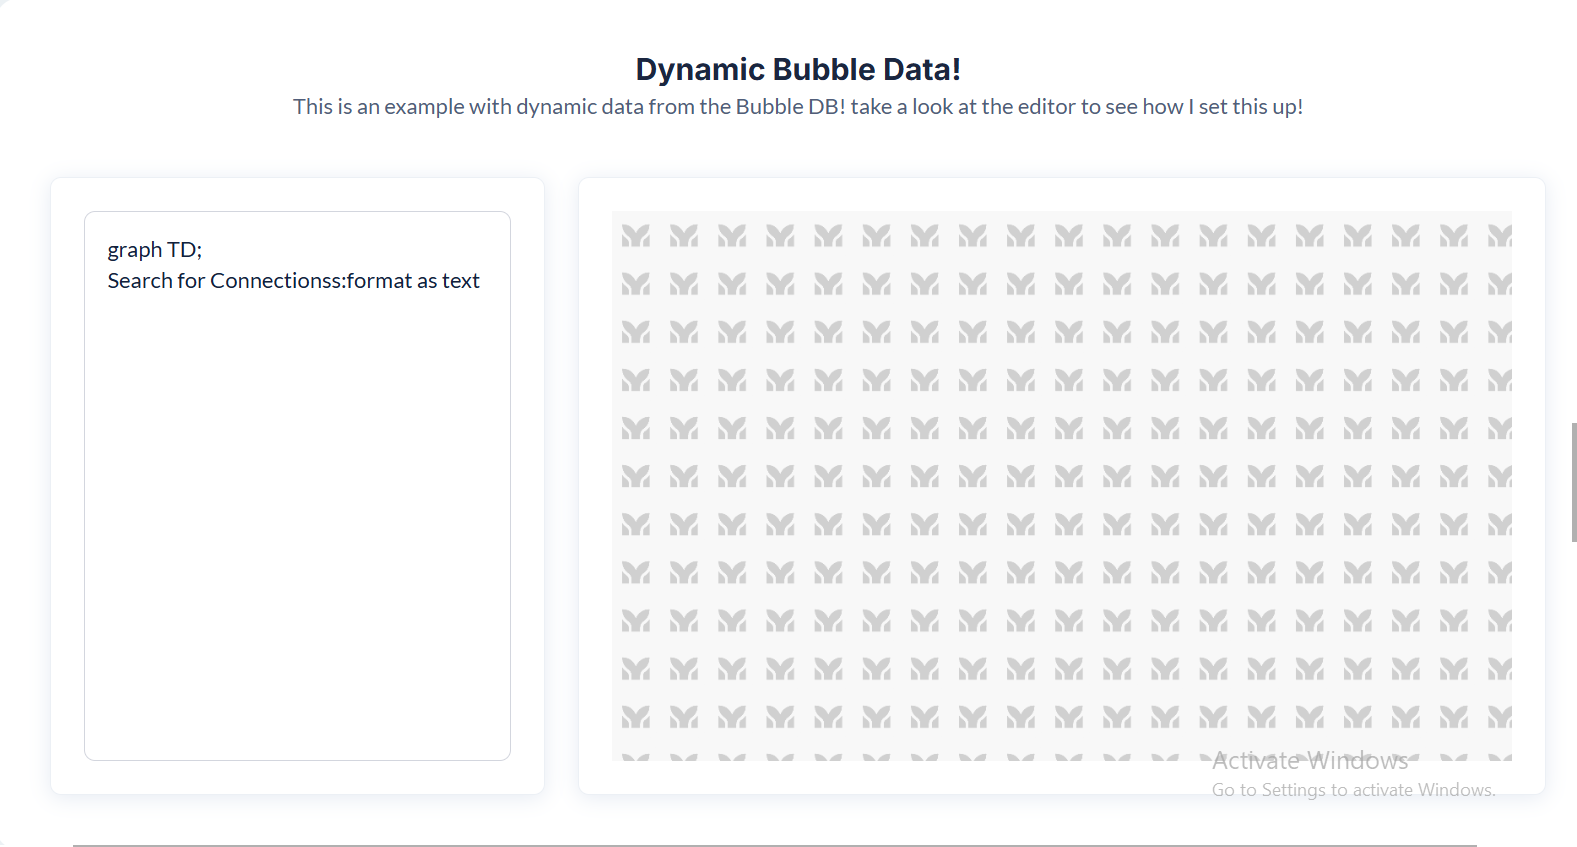
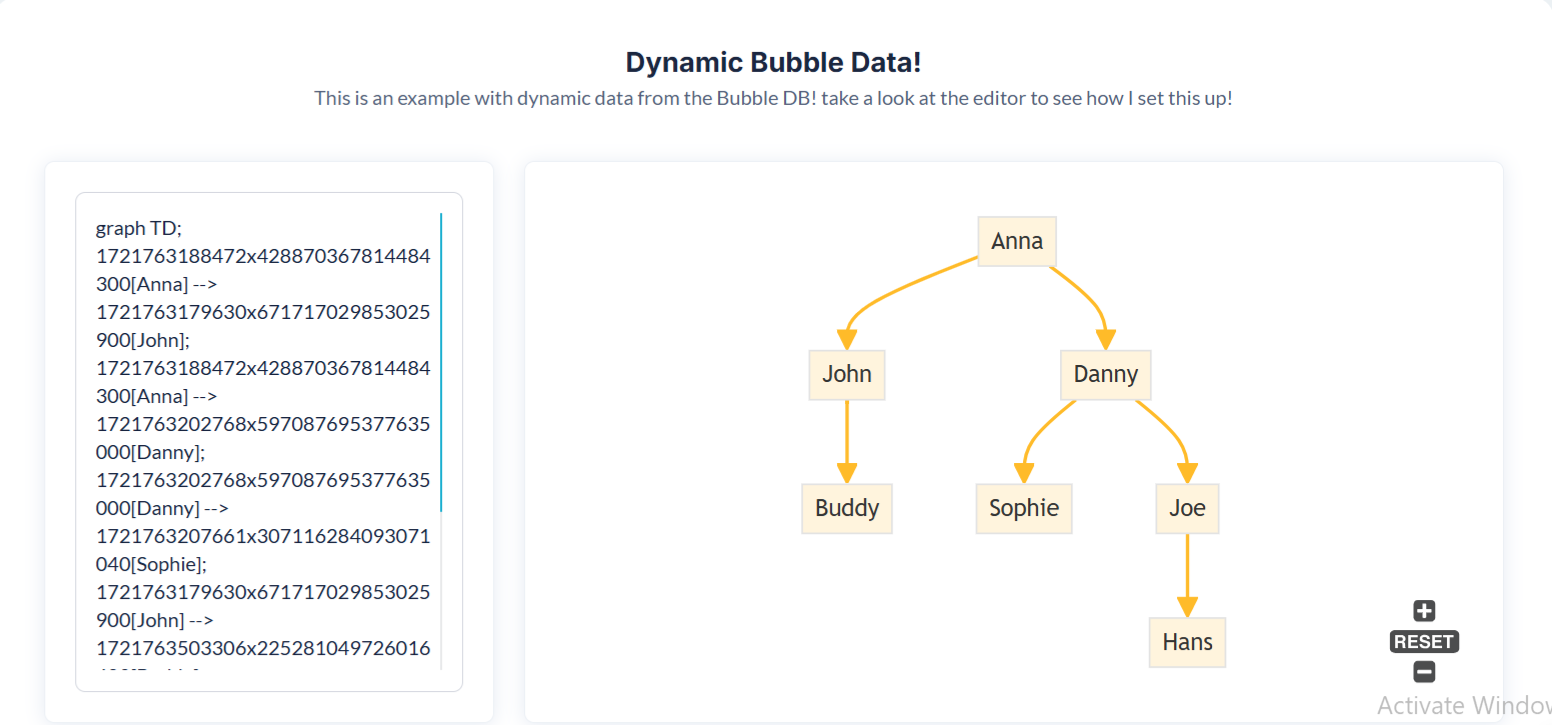
- Bubble Data Diagram
- Dynamically generate diagrams based on your app’s database structure.
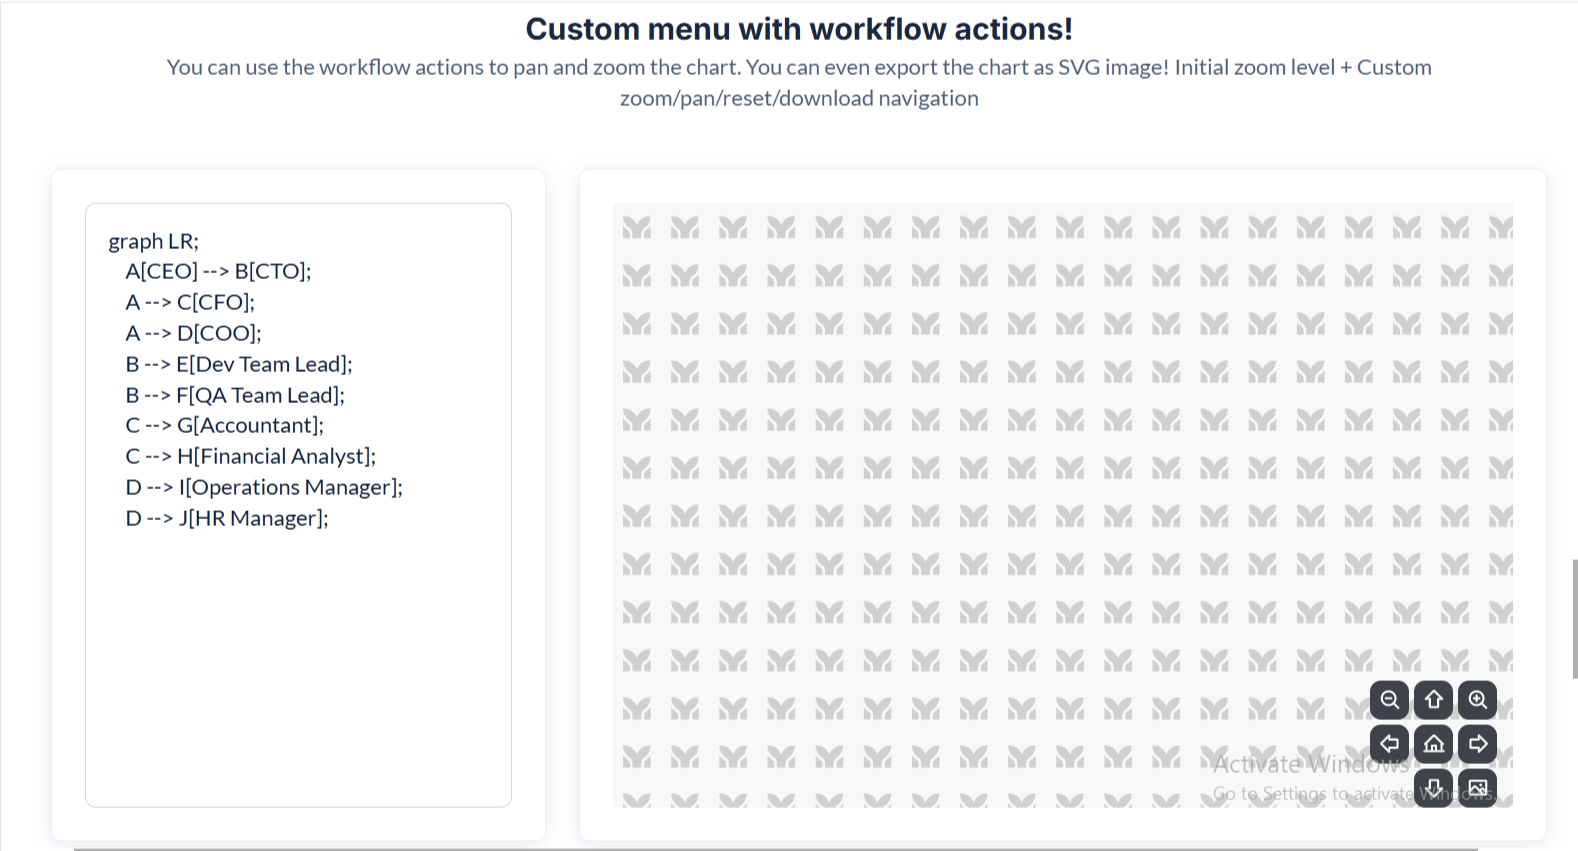
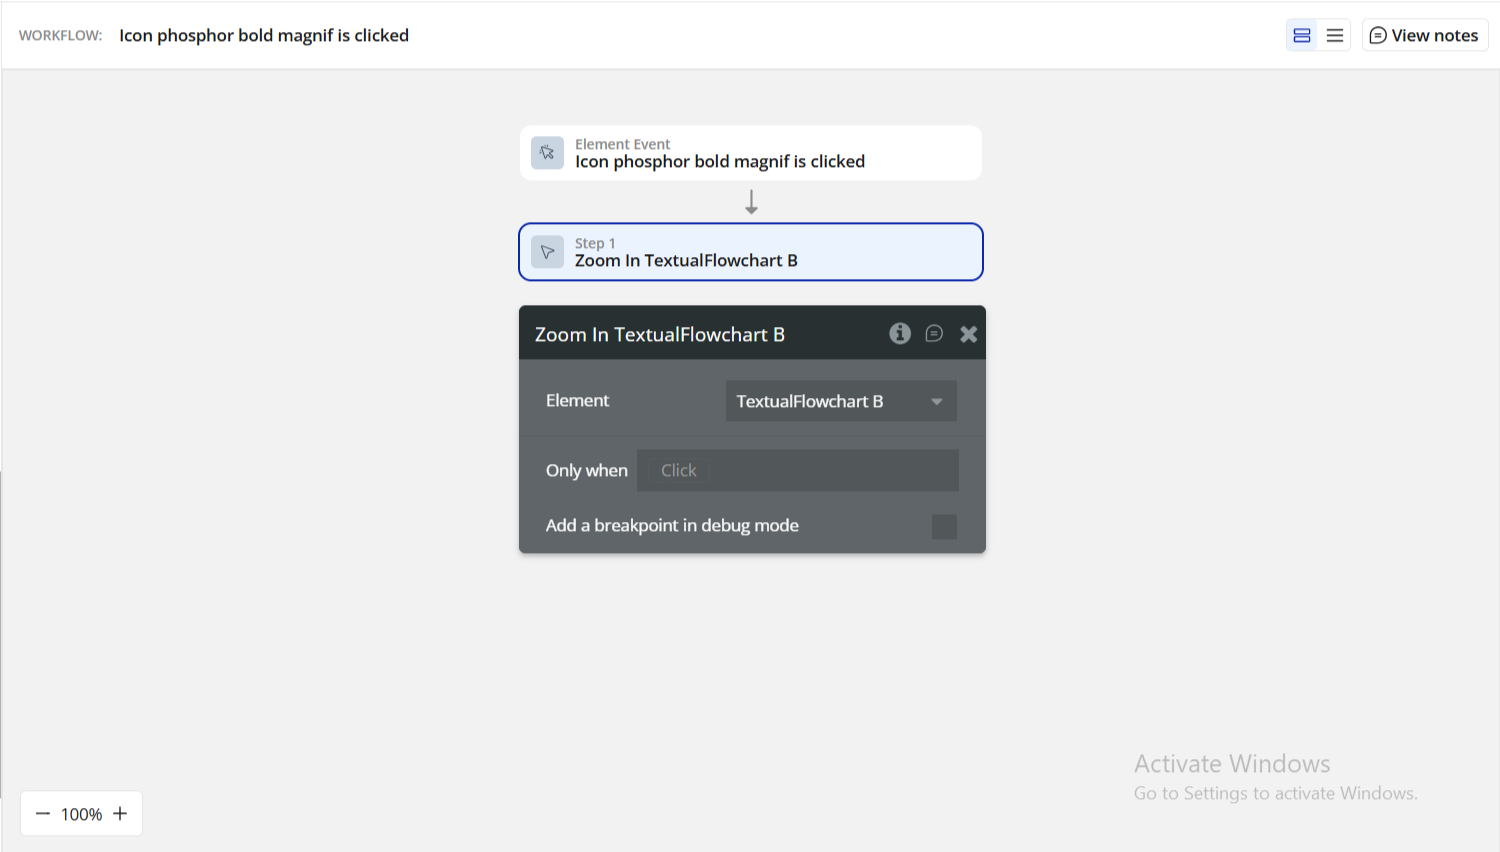
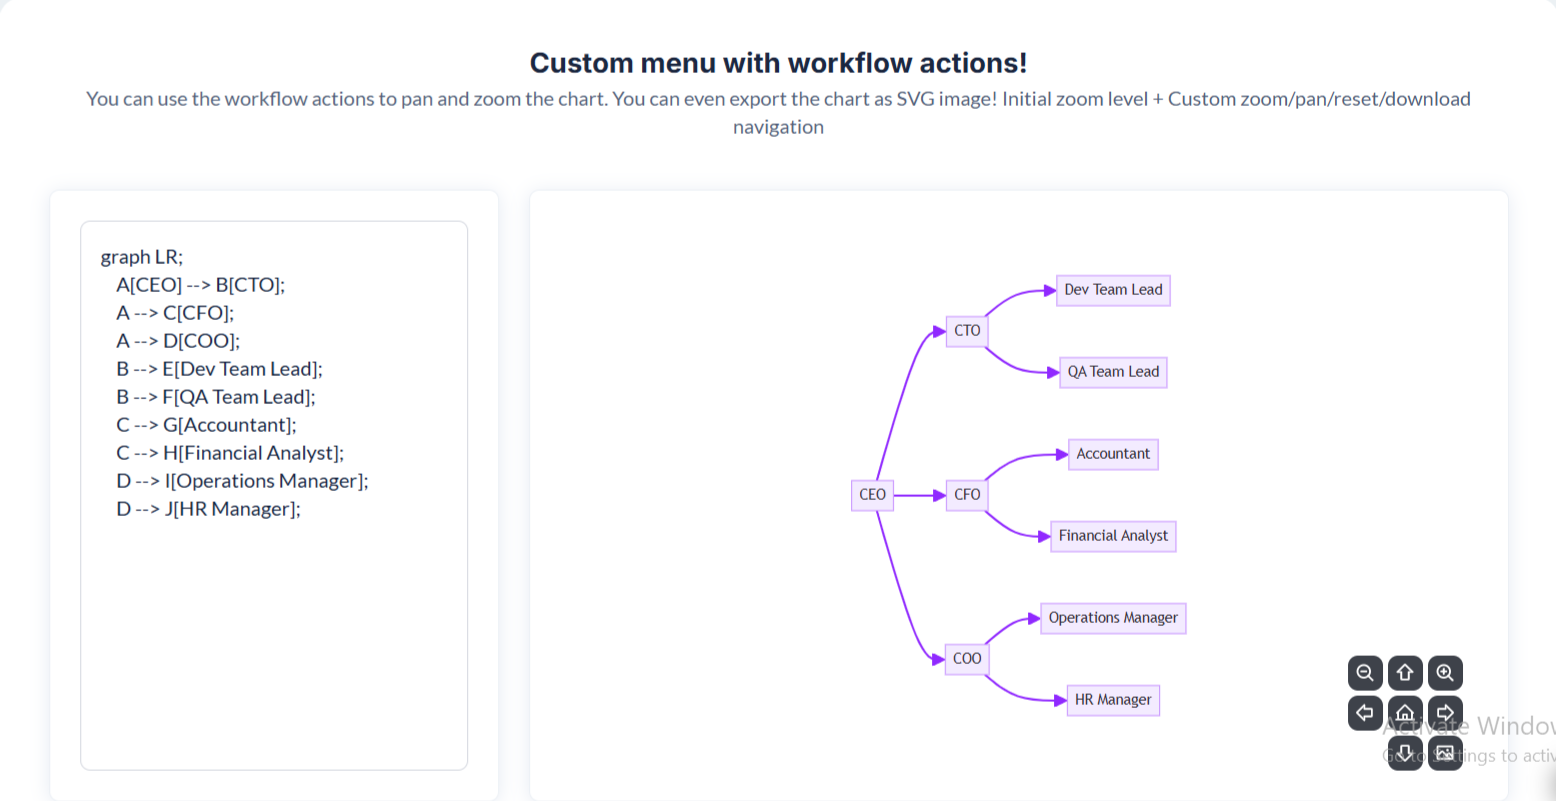
- Workflow Action Diagram
- Visualize Bubble workflows as Mermaid flowcharts.
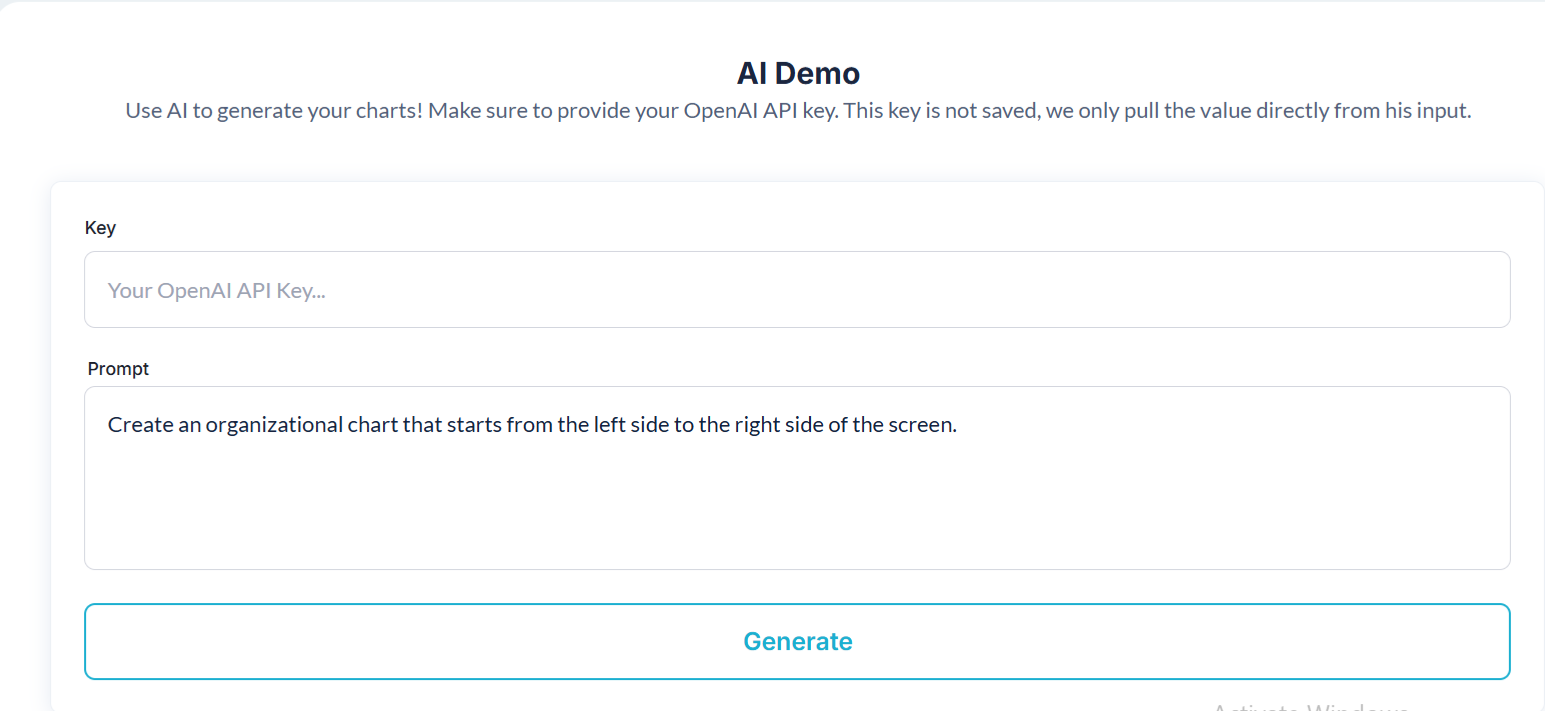
- AI Demo Charts
- Create diagrams such as:
- decision trees
- flow sequences
- process charts
- Perfect for no-code AI builders.
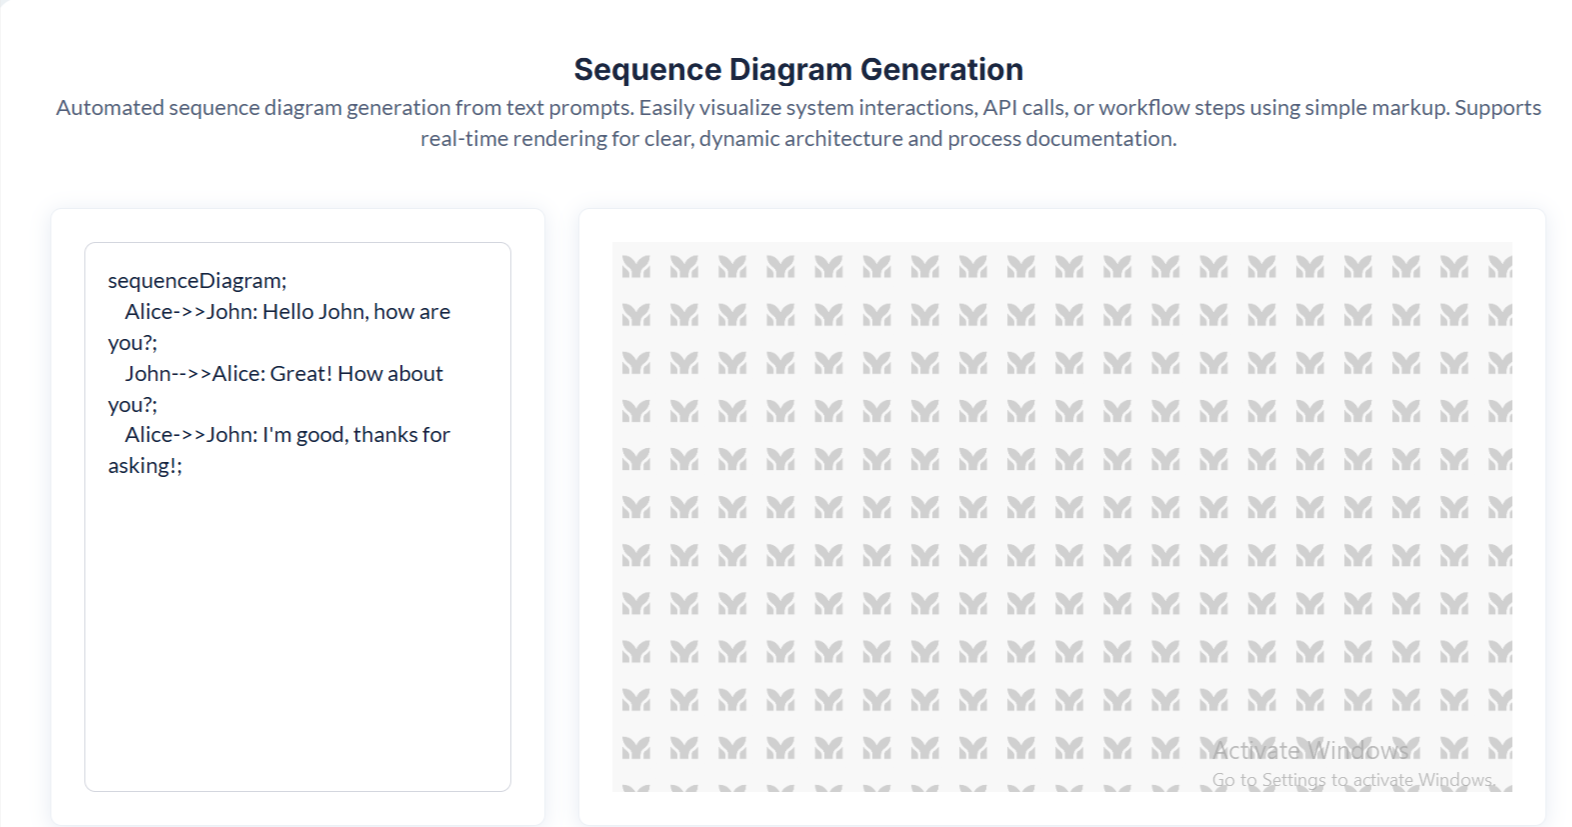
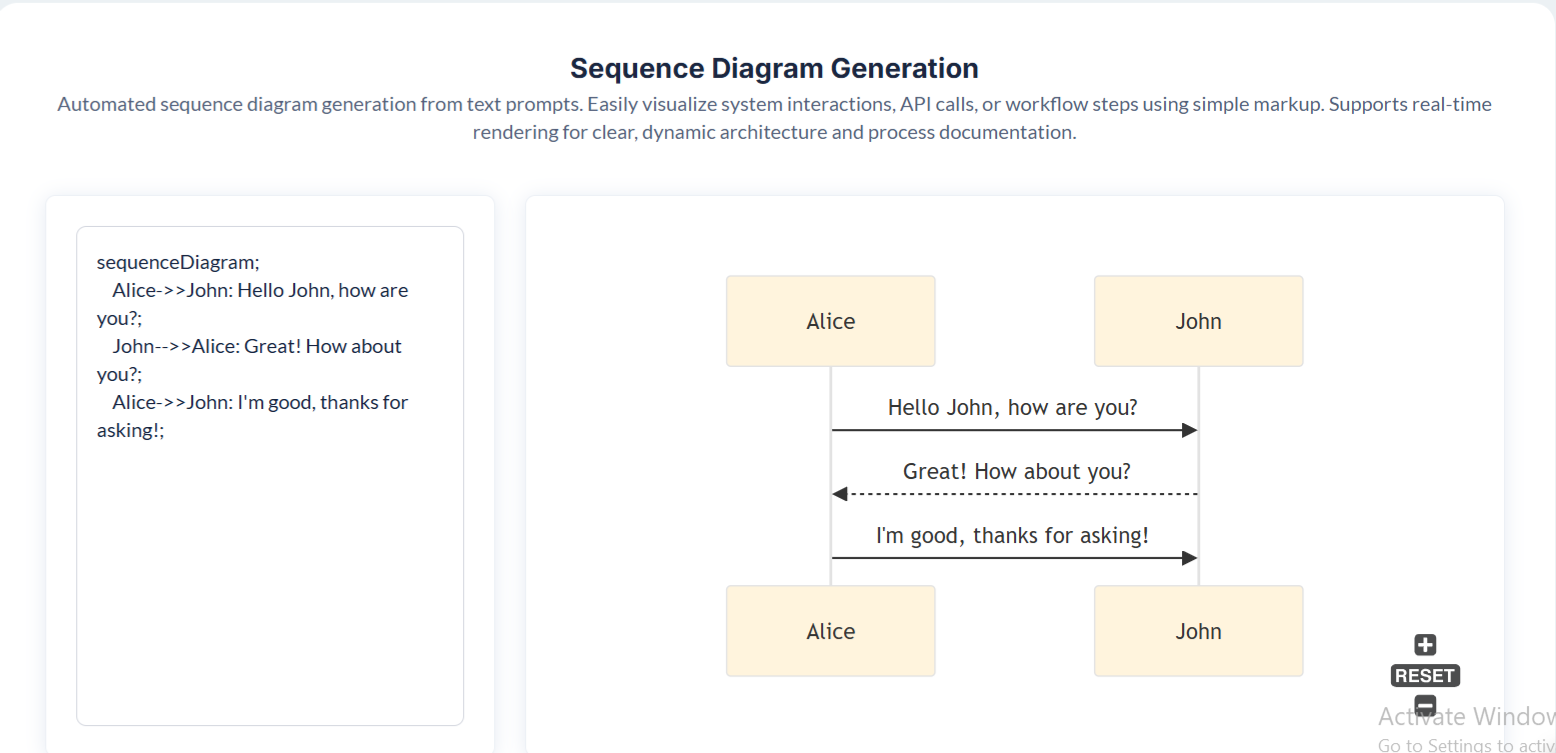
- Sequence Diagram
- Represent interactions between systems or users over time.
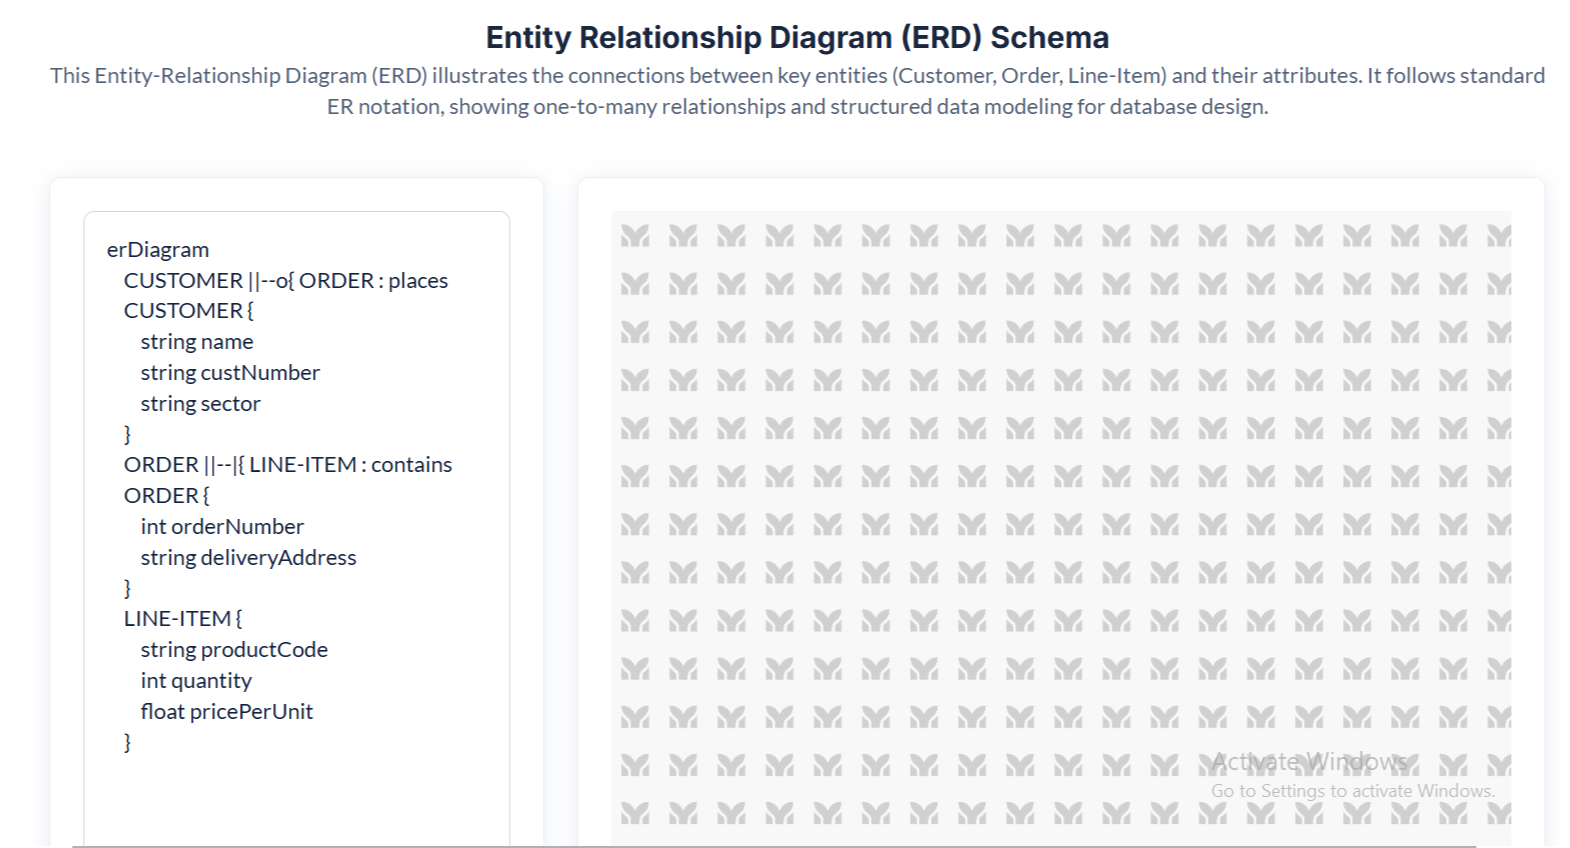
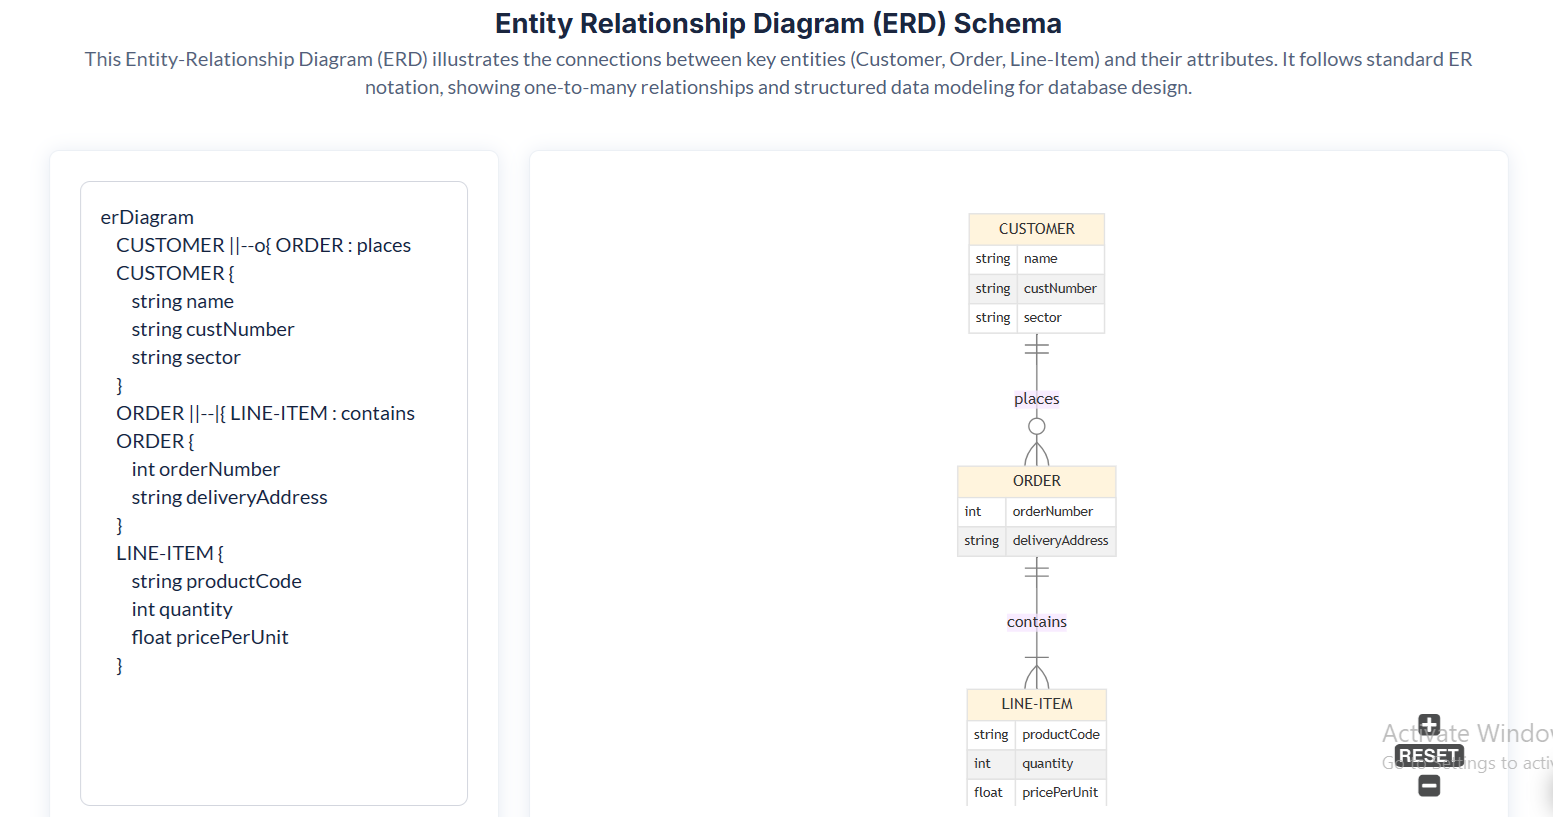
- ERD Diagram
- Mermaid.js supports Entity Relationship Diagrams (ERD) for database modeling.
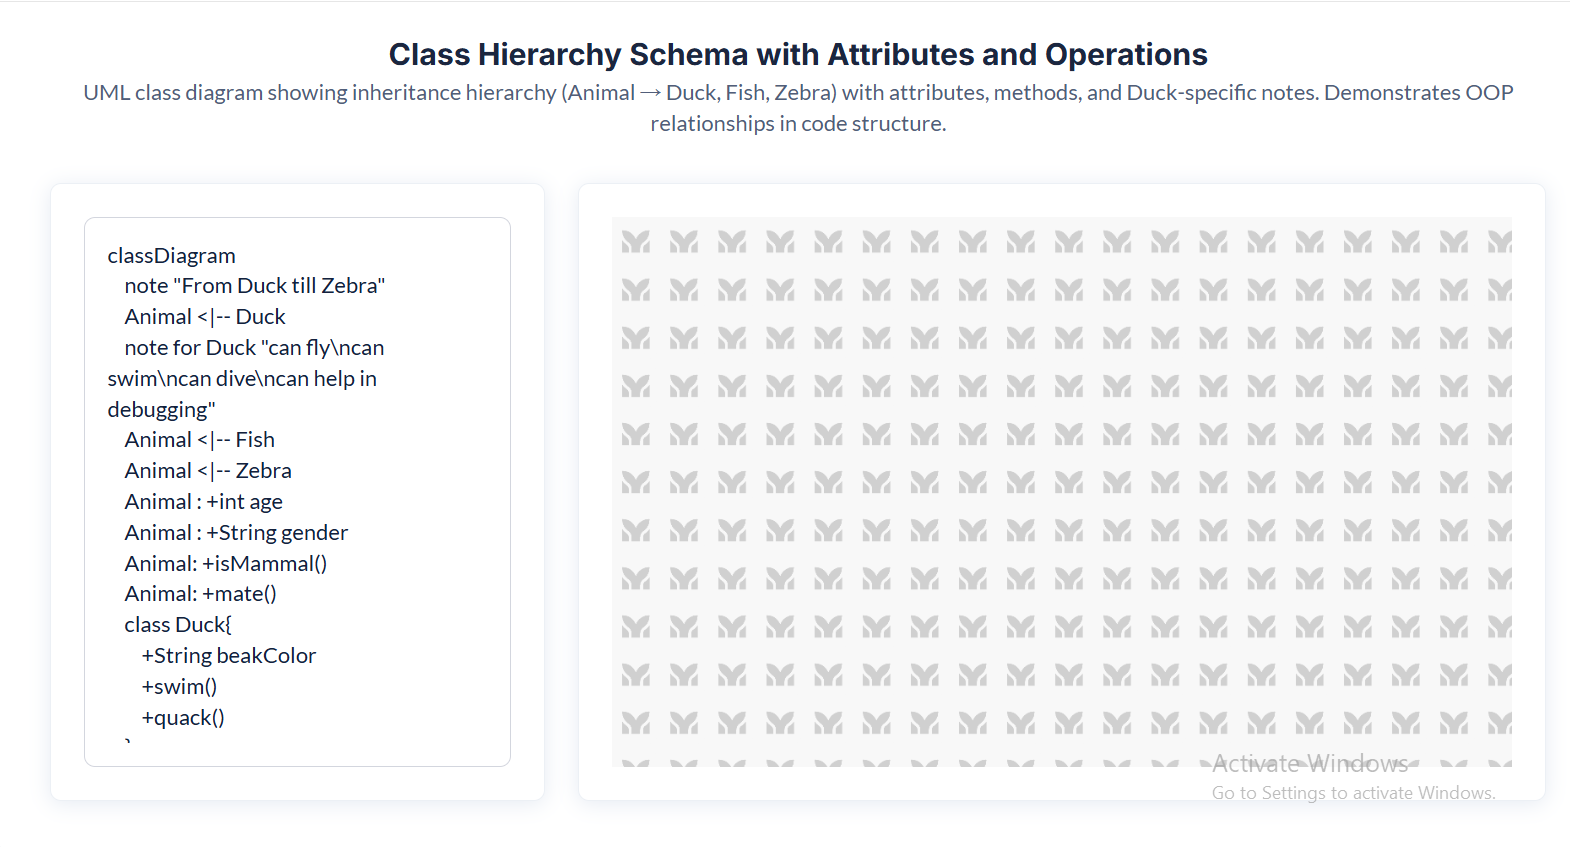
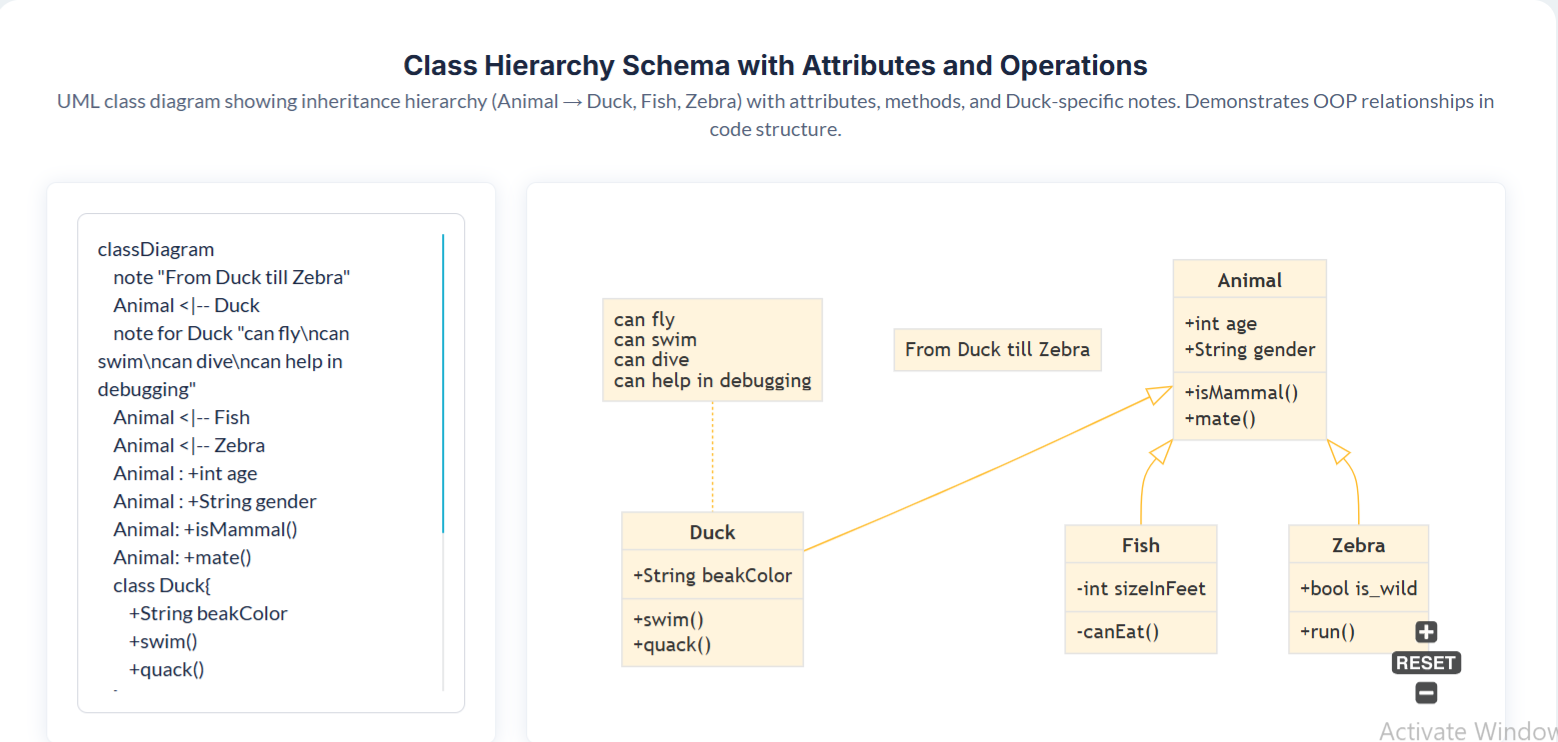
- Class Diagram
- Ideal for architecture visualization or software modeling.
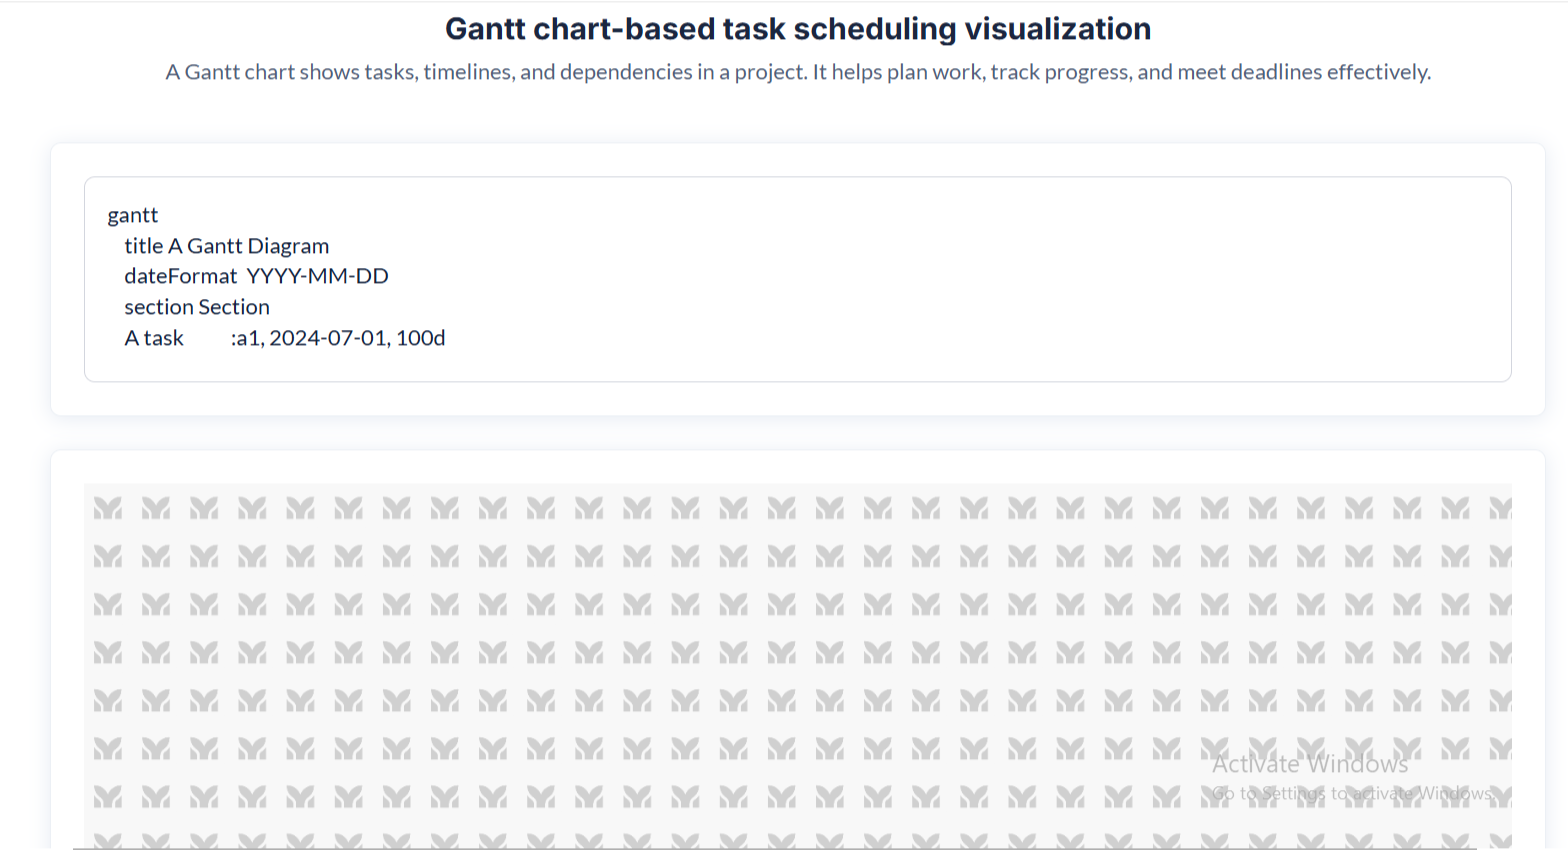
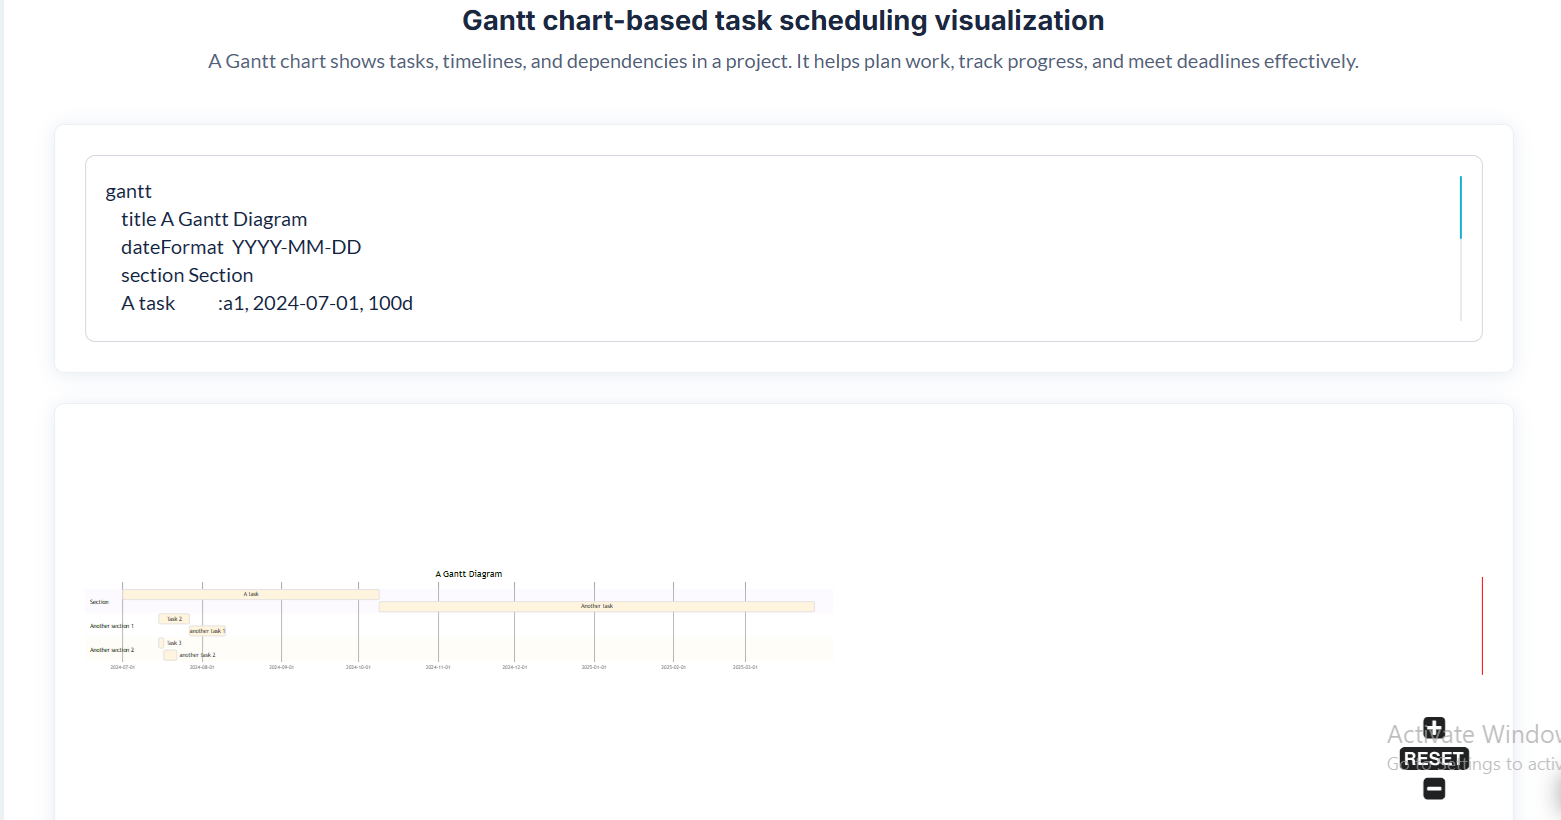
- Gantt Diagram
- Useful for project timelines, task dependencies, and sprints.
Each of these diagrams is powered by Mermaid.js syntax, meaning that updating a single text field can regenerate the entire chart dynamically.
4.3 Workflow Actions (Zoom, Pan, Save SVG)
The plugin comes with a full suite of workflow actions.
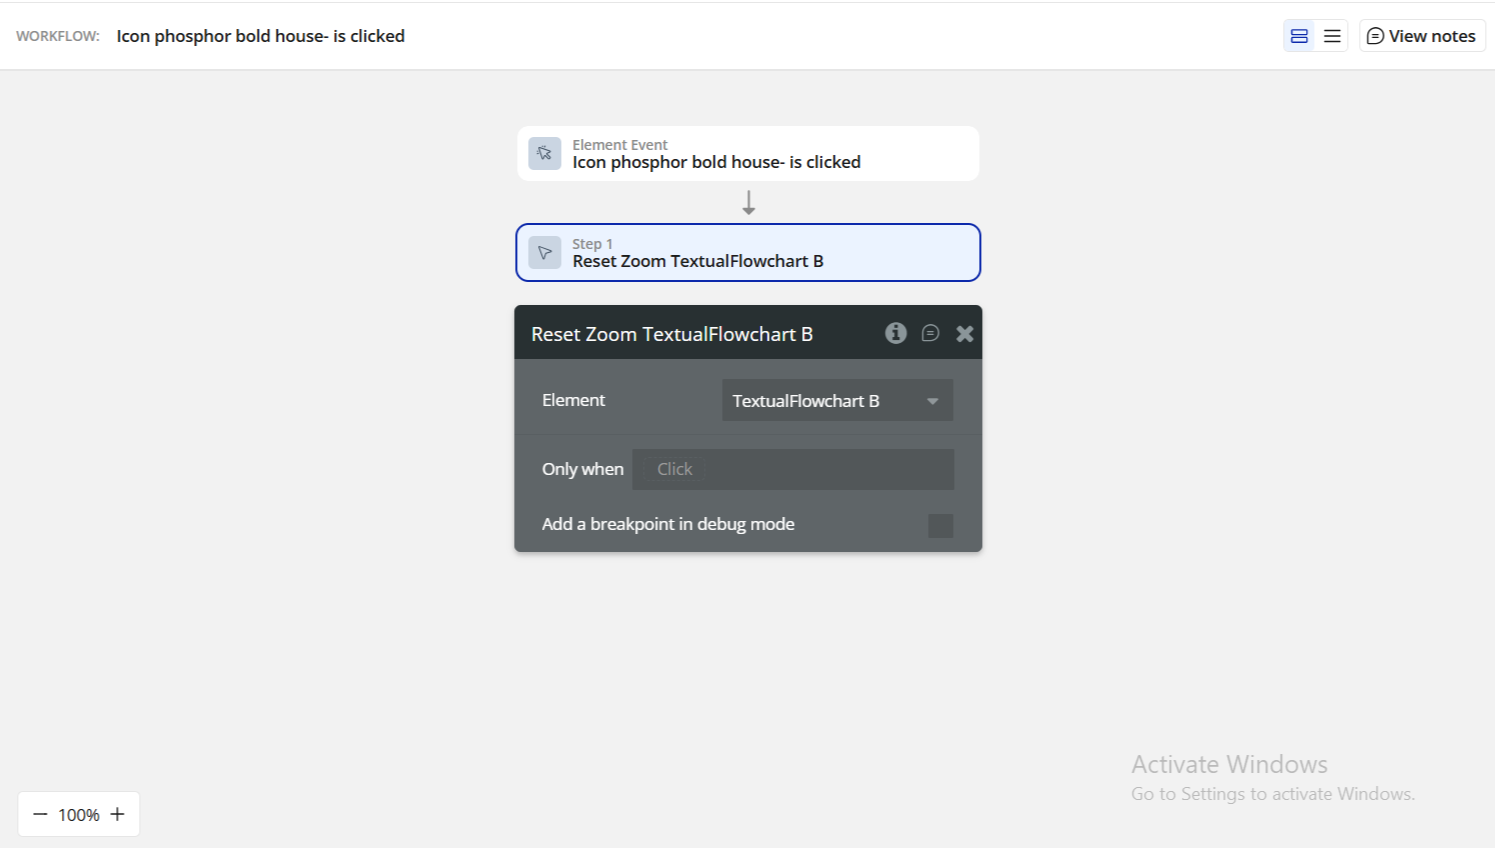
Zoom Controls
- Zoom In
- Zoom Out
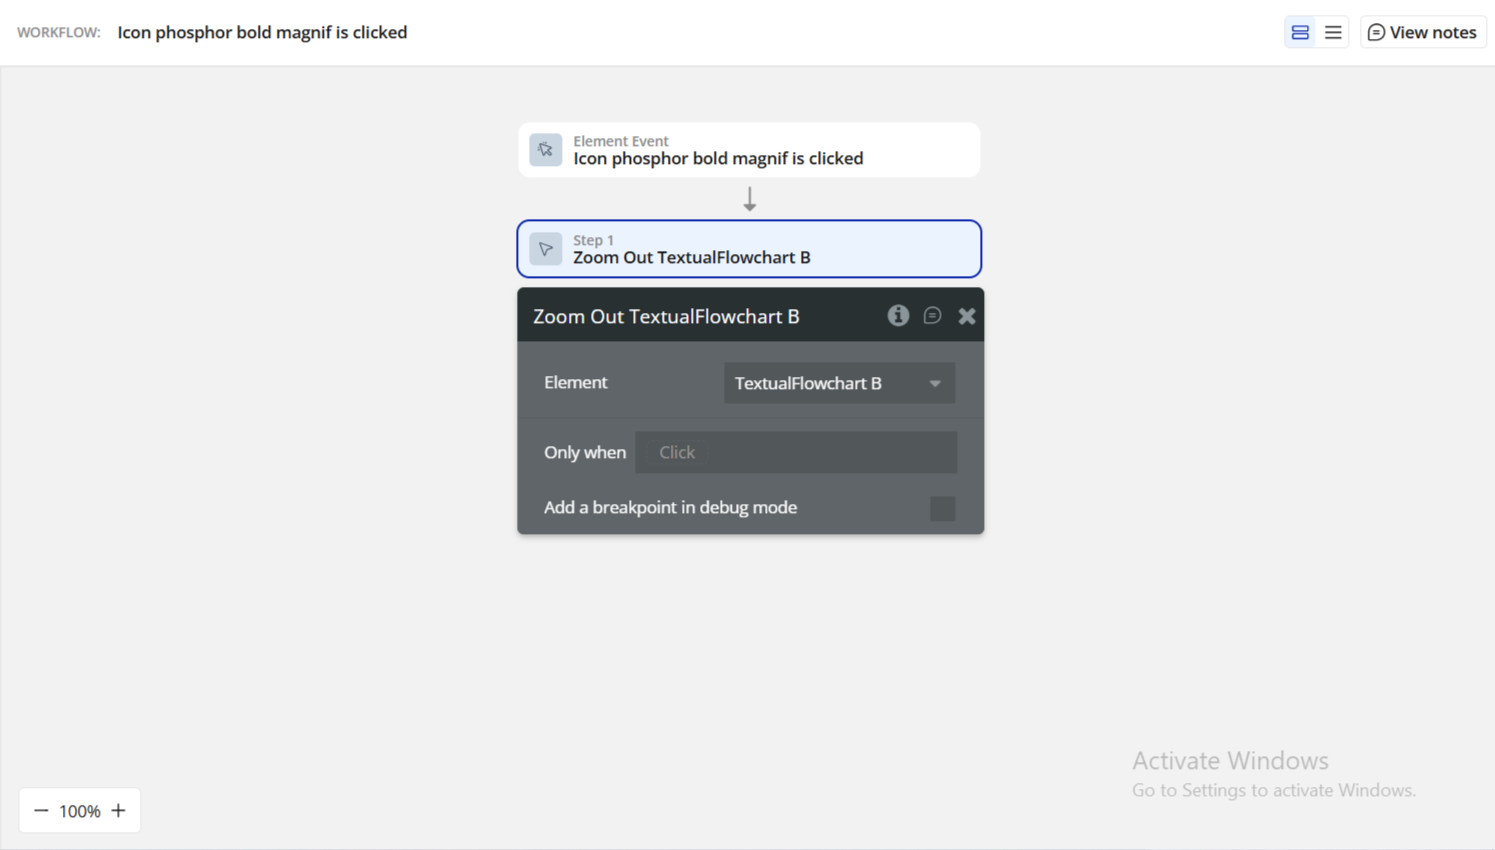
- Reset Zoom
These allow you to create UI buttons like:
“Center chart”“Zoom to fit”“Expand chart”
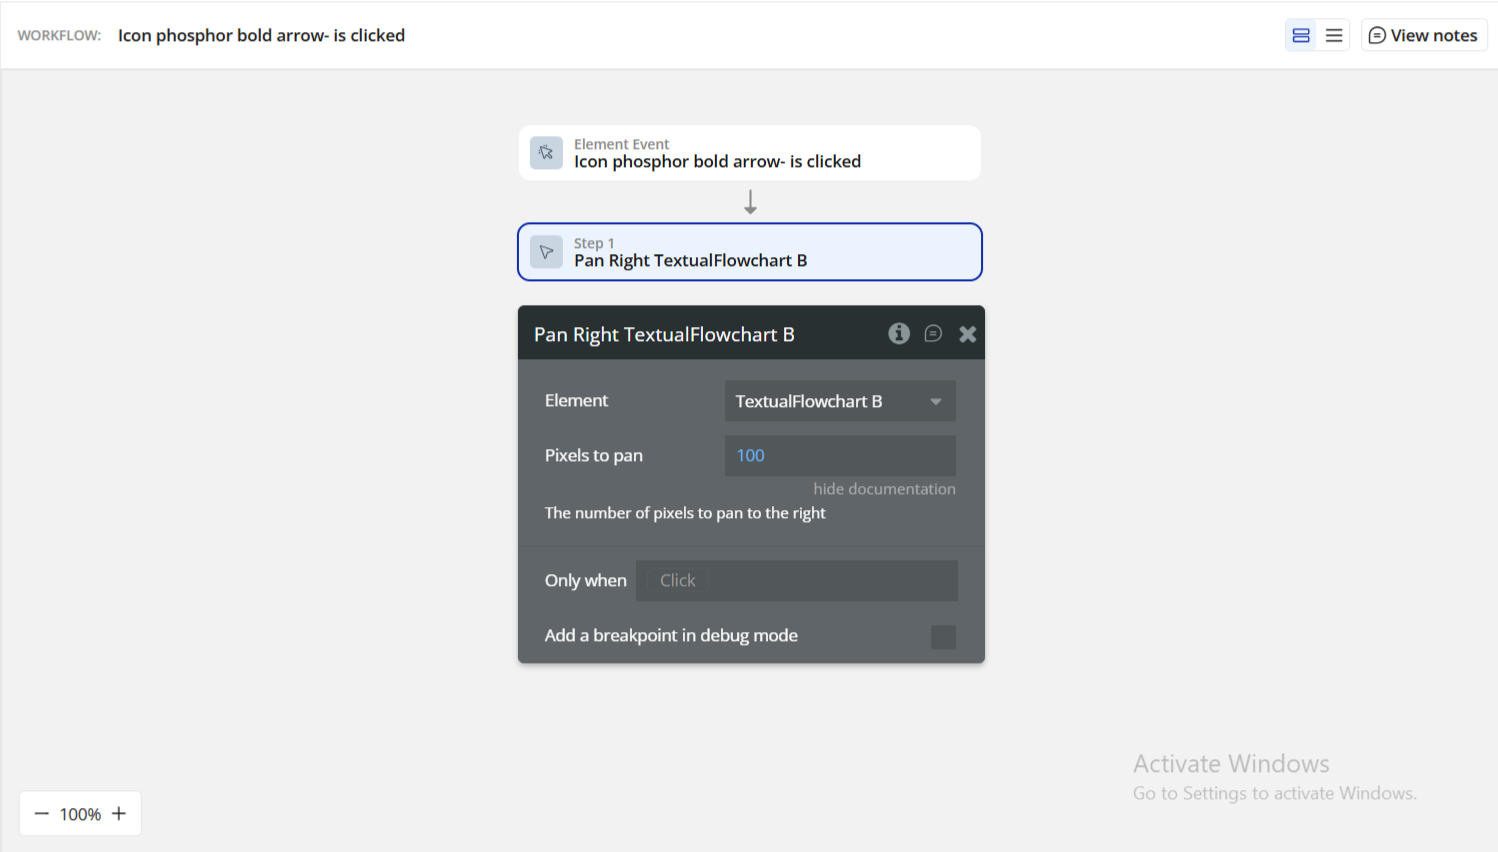
Pan Controls
Move the diagram programmatically:
- Pan Left

- Pan Right
- Pan Up

- Pan Down

Each takes a “Pixels to pan” parameter.
Great for large diagrams where automatic repositioning improves UX.
Save SVG to Bubble File Storage
This action exports the rendered flowchart as an SVG image, uploads it to Bubble’s File Manager, and exposes the file URL through the Uploaded SVG URL state.
Typical uses:
- Export user-created diagrams
- Save AI-generated charts as images
- Include diagrams in PDF reports
- Share diagrams via email
A corresponding event, "SVG is Uploaded", lets you trigger follow-up workflows like saving the file into your database or showing a success popup.
Step 5. Preview & Test
Once the Textual Flowcharts element and workflows are configured, you can now preview your diagrams in Bubble’s run mode and test how different Mermaid.js chart types render dynamically.
When you click Preview, you'll see a menu similar to the demo category selector:
This dropdown allows you to quickly test a variety of sample diagrams built with the plugin.
5.1 Select a Diagram Category
Use the dropdown to switch between the predefined chart types:
- Dynamic Mermaid
- Quadrant-based Diagram
- Bubble Data
- Workflow Action
- Sequence Diagram
- ERD Diagram
- Class Diagram
- Gantt Diagram
Each selection loads a different Mermaid.js template into the flowchart renderer.
5.2 Test Chart Navigation (Zoom, Pan, Reset)
Switch between diagrams and use your UI controls to verify:
- Zoom In / Zoom Out works properly
- Reset returns the diagram to default view
- Pan Left / Right / Up / Down moves larger diagrams smoothly
Try this on Class Diagram, Sequence Diagram, or Gantt Diagram, as these tend to be wide and benefit from navigation.
Plugin Element - Textual Flowchart
Fields
Title | Description | Type |
—————— Data —————— | ||
Data in Mermaid.js Format | The Mermaid.js-formatted text that defines the flowchart. This is the core content that the plugin renders. You can write Mermaid syntax manually or generate it using AI tools. | Text |
——— Zoom/Pan Options ——— | ||
Enable Zoom | Allows users to zoom in and out of the flowchart using buttons or scroll gestures. | Checkbox |
Enable Pan | Allows users to click and drag to navigate across large flowcharts. | Checkbox |
Show Zoom / Reset Icons | Displays zoom-in, zoom-out, and reset buttons on the flowchart interface. | Checkbox |
Zoom Scale Sensitivity | Controls how quickly the zoom level changes when users zoom via scroll or buttons. Higher values increase sensitivity. | Number |
Initial Zoom Level | Sets the starting zoom level when the flowchart first loads. Useful for fitting diagrams to screen. | Number |
Minimum Zoom Level | The lowest zoom value allowed. Prevents users from zooming out too far. | Number |
Maximum Zoom Level | The highest zoom value allowed. Prevents excessive zooming in that may distort diagrams. | Number |
Panning Speed | Adjusts how fast the chart moves when panned. Higher values cause faster movement. | Number |
Zoom / Reset Button Color | Sets the color of the zoom and reset UI buttons. | Color |
Zoom / Reset Button Opacity | Sets the transparency level of zoom/reset controls. | Number |
—————— Styling —————— | ||
Primary Color | Main color for primary nodes in the flowchart. | Color |
Primary Text Color | Text color applied to primary nodes. | Color |
Primary Border Color | Border color used for primary flowchart elements. | Color |
Line Color | Color applied to connectors, arrows, and relationships between nodes. | Color |
Secondary Color | Background color for secondary node types. | Color |
Tertiary Color | Optional additional accent color for custom themes. | Color |
Note BG Color | Background color for Mermaid “note” blocks. | Color |
Note Text Color | Text color for Mermaid “note” blocks. | Color |
Dark Mode | Enables dark mode rendering logic. When true, the plugin adjusts color interpretation for dark UI environments. | Checkbox |
Element Actions
Below are the workflow actions available to interact with the flowchart element.
Zoom In
Zooms the flowchart in by one increment based on the defined zoom sensitivity.
Zoom Out
Zooms the flowchart out by one decrement based on the defined zoom sensitivity.
Reset Zoom
Resets the flowchart to the initial zoom level, returning it to the default view.
Pan Left
Moves the flowchart left by the specified number of pixels.
Title | Description | Type |
Pixels to pan | Number of pixels the diagram moves left. | Number |
Save SVG to Bubble File Storage
Exports the current flowchart as an SVG image and uploads it to Bubble’s File Manager.
This action also triggers the SVG is Uploaded event.
Pan Right
Moves the flowchart right by the specified number of pixels.
Title | Description | Type |
Pixels to pan | Number of pixels the diagram moves right. | Number |
Pan Up
Moves the flowchart upward by the specified number of pixels.
Title | Description | Type |
Pixels to pan | Number of pixels the diagram moves up. | Number |
Pan Down
Moves the flowchart downward by the specified number of pixels.
Title | Description | Type |
Pixels to pan | Number of pixels the diagram moves down. | Number |
Exposed States
Title | Description | Type |
Uploaded SVG URL | The URL of the SVG file generated by the Save SVG action. This becomes available immediately after upload and can be used to display, download, or save the image. | Text |
Element Events
Title | Description |
SVG is Uploaded | Triggered after the SVG export completes successfully. Use this event to show success messages, save the file to a database, or trigger additional workflows. |

Changelogs
Update 27.01.26 - Version 3.0.0
- Bubble Plugin Page Update (Docs).
Update 02.07.25 - Version 2.2.0
- Bubble Plugin Page Update (Logo).
Update 10.06.25 - Version 2.1.0
- Marketing update (minor change).
Update 05.06.25 - Version 2.0.0
- Marketing update.
Update 16.11.24 - Version 1.2.0
- Minor update (Marketing update).
Update 10.10.24 - Version 1.1.0
- Acquired by Zeroqode.
Update 24.07.24 - Version 1.0.4
- Added better handling of empty data.
Update 23.07.24 - Version 1.0.3
- Improvements for resizing.
Update 23.07.24 - Version 1.0.2
- Improvements.
Update 23.07.24 - Version 1.0.1
- Improvements for dynamic data.
Update 23.07.24 - Version 1.0.0
- Launch.
Update 21.07.24 - Version 0.0.8
- Fixed error in console.
Update 21.07.24 - Version 0.0.7
- Fix for panning workflow actions.
Update 21.07.24 - Version 0.0.6
- Update for reset action.
Update 21.07.24 - Version 0.0.5
- Update.
Update 21.07.24 - Version 0.0.4
- Fix for multiple charts on one page.
Update 21.07.24 - Version 0.0.3
- Updated in editor design.
Update 21.07.24 - Version 0.0.2
- Improvements.
Update 21.07.24 - Version 0.0.1
- Pre-launch.