
Audio visualizations are graphical representations or animations that accompany audio playback to provide a visual experience that complements the audio.
Variants of visualization
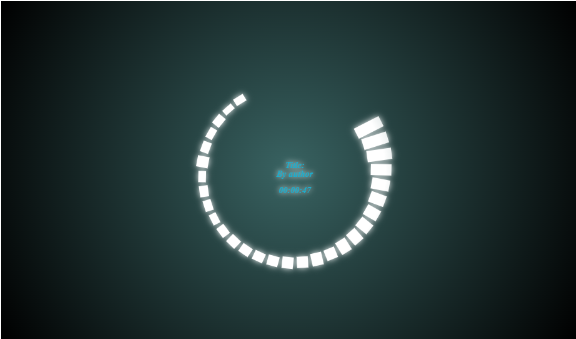
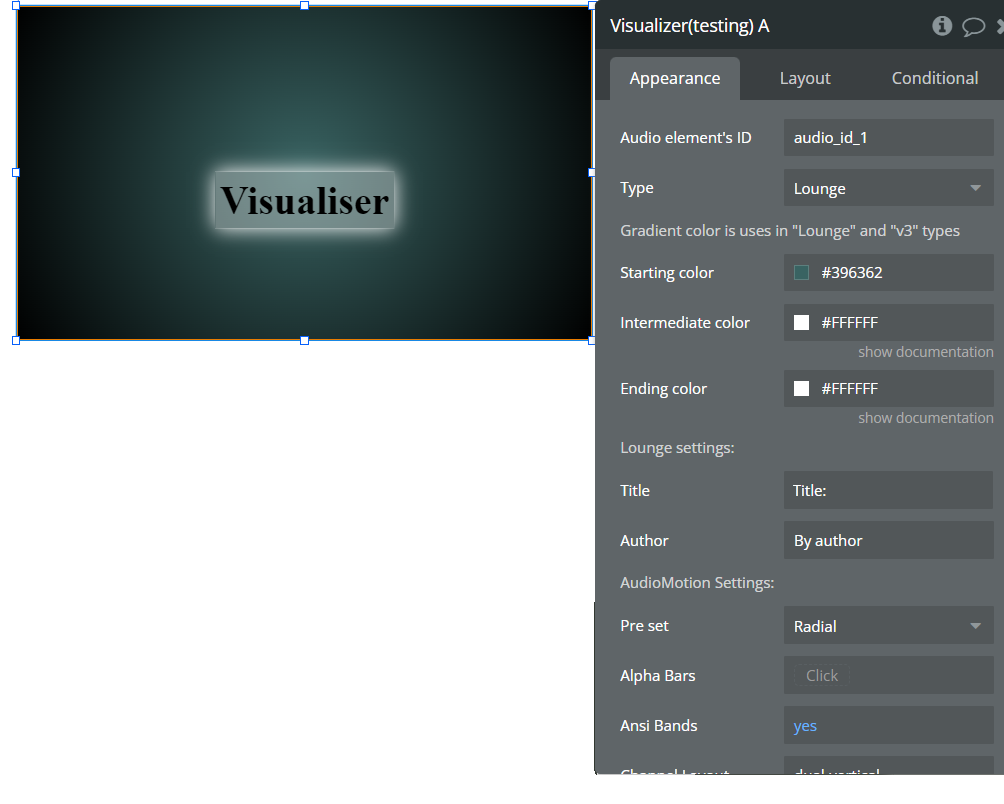
Type: Lounge.
Shows 2 custom text lines, current playback time and frequency.
Background, Font and color can be set in style’s section.
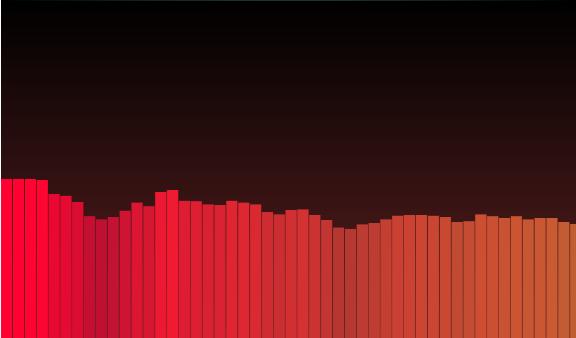
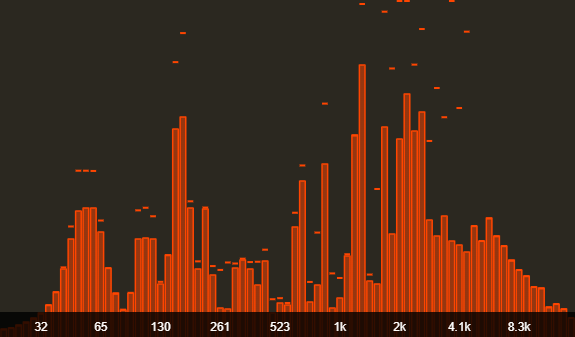
Type: Spectrum.
Shows audio signal's frequency content as a bar graph.
Background can be set in style’s section.
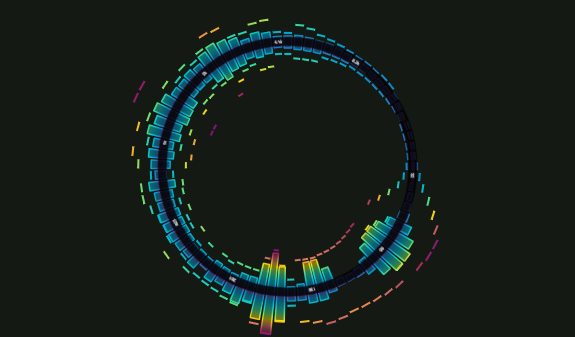
Type: Power.

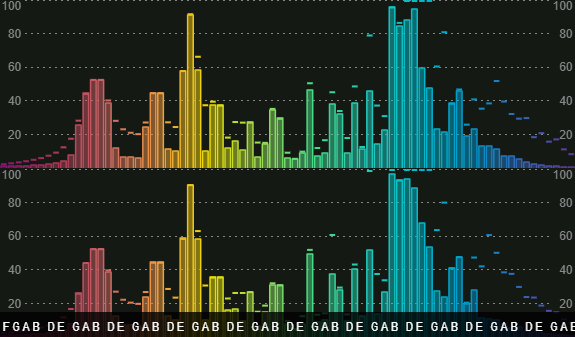
Type: AudioMotion.
A high-resolution real-time audio spectrum analyzer.
Features
- Dual-channel high-resolution real-time audio spectrum analyzer
- Logarithmic, linear and perceptual (Bark and Mel) frequency scales, with customizable range
- Visualization of discrete FFT frequencies or up to 240 frequency bands (supports ANSI and equal-tempered octave bands)
- Decibel and linear amplitude scales, with customizable sensitivity
- Optional A, B, C, D and ITU-R 468 weighting filters
- Additional effects: LED bars, luminance bars, mirroring and reflection, radial spectrum
- Choose from 5 built-in color gradients.
Plugin Elements’ Properties
**Title ** | Description | Type |
Media Element's ID | ID Attribute of Audio-Video Player. | String |
Type | Type of visualizer. | Dropdown options |
Lounge settings | ||
Title | First dynamic text line on the visualizer. | String |
Author | Second dynamic text line on the visualizer. | String |
Gradient color settings | ||
Starting color | Adds a new color on the beginning of the gradient. | Color |
Intermediate color | Adds a new color in the middle of gradient | Color (Optional) |
Ending color | Adds a new color on the end of the gradient | Color (Optional) |
AudioMotion Settings | ||
Pre set | Available values: Defaults, Classic LEDs, Mirror wave, Radial, Reflex Bars
Preset can be overwritten by the fields below. | Dropdown options |
Alpha Bars | When set to "yes" each bar's amplitude affects its opacity, i.e., higher bars are rendered more opaque while shorter bars are more transparent. | Boolean (yes/no) |
Ansi Bands | When set to "yes", ANSI/IEC preferred frequencies are used to generate the bands for octave bands modes.
When "no", bands are based on the equal-tempered scale, so that in 1/12 octave bands the center of each band is perfectly tuned to a musical note. | Boolean (yes/no) |
Channel Layout | Available values: 'single', 'dual-combined', 'dual-vertical'. | Dropdown options |
Color Mode | Available values: 'gradient', 'bar-index', 'bar-level'.
Mode 0 provides the highest resolution, allowing you to visualize individual frequencies as provided by the FFT computation;
Modes 1 - 8 divide the frequency spectrum in bands; when using the default logarithmic Frequency Scale, each band represents the nth part of an octave; otherwise, a fixed number of bands is used for each mode;
Mode 10 uses the discrete FFT data points to draw a continuous line and/or a filled area graph. | Dropdown options |
Fft size | Valid values are: 32, 64, 128, 256, 512, 1024, 2048, 4096, 8192, 16384, and 32768. Higher values provide more detail in the frequency domain, but less detail in the time domain (slower response), so you may need to adjust smoothing accordingly. | Number |
Smoothing | It must be a number between 0 and 1. Lower values make the analyzer respond faster to changes. | Number |
Gradient | Available values: 'classic', 'orangered', 'prism', 'rainbow', 'steelblue'. | Dropdown options |
Mirror | Horizontal mirroring effect.
Valid values are: -1 or 0 or 1
-1: Mirrors the analyzer to the left (low frequencies at the center of the screen).
0: Disables mirror effect (default).
1: Mirrors the analyzer to the right (high frequencies at the center of the screen). | Number |
Mode | Available values: from 0 to 8 and 10. | Number |
Note Labels | When is "yes" displays musical note labels instead of frequency values. | Boolean (yes/no) |
Radial | When is "yes", the analyzer is rendered in a circular shape, with radial frequency bars spreading from its center.
When Channel Layout is set to 'dual-vertical', a larger diameter is used and the right channel bars are rendered towards the center of the analyzer. | Boolean (yes/no) |
Show FPS | When is "yes", the current frame rate is displayed. | Boolean (yes/no) |
Show Peaks | When is "yes", the amplitude peaks are shown. | Boolean (yes/no) |
Show Scale X | When is "yes", scale labels are displayed on the X axis. | Boolean (yes/no) |
Show Scale Y | When is "yes", displayed the level/amplitude scale on the Y axis. | Boolean (yes/no) |
Spin Speed | This property defines the analyzer rotation speed, in revolutions per minute. Positive values will make the analyzer rotate clockwise, while negative values will make it rotate counterclockwise. A value of 0 results in no rotation. | |
Overlay: | ||
Enable overlay | Allows the analyzer to be displayed over other Audio-Video Player, | Boolean (yes/no) |
Transparent on hover | Changes opacity to 50% when hover overlay. | Boolean (yes/no) |
Old responsive: | ||
Height old responsive | Height of the element in pixels. Fill in this field if you are using the old responsive engine. | Number |
Style Elements’ Properties
Font family, color and size are used in Lounge visualizer.
Background is used in Lounge, Spectrum and AudioMotion visualizers.
If visualizer is set as overlay, background will be ignored.