
✅
Demo to preview
✅
Introduction
Using this plugin, you have the capability to effortlessly generate dynamic Gantt charts and timelines. This enables you to efficiently strategize and monitor project tasks and milestones. Furthermore, it includes a funnel chart function, ideal for visually representing data, especially when analyzing sales pipelines and conversion rates.

How to setup
This plugin combines 4 different charts that simplify data visualization and project management. Each chart exists as a separate visual element independently from the rest. The charts consume data via the properties and return parameters back into the page as exposed states.
- Install the plugin in your project.
- Pick the desired element from the toolbar and drag it onto the page.
- Open the element's properties and fill in the required fields with data.
The plugin has five elements:
Funnel 1D Chart
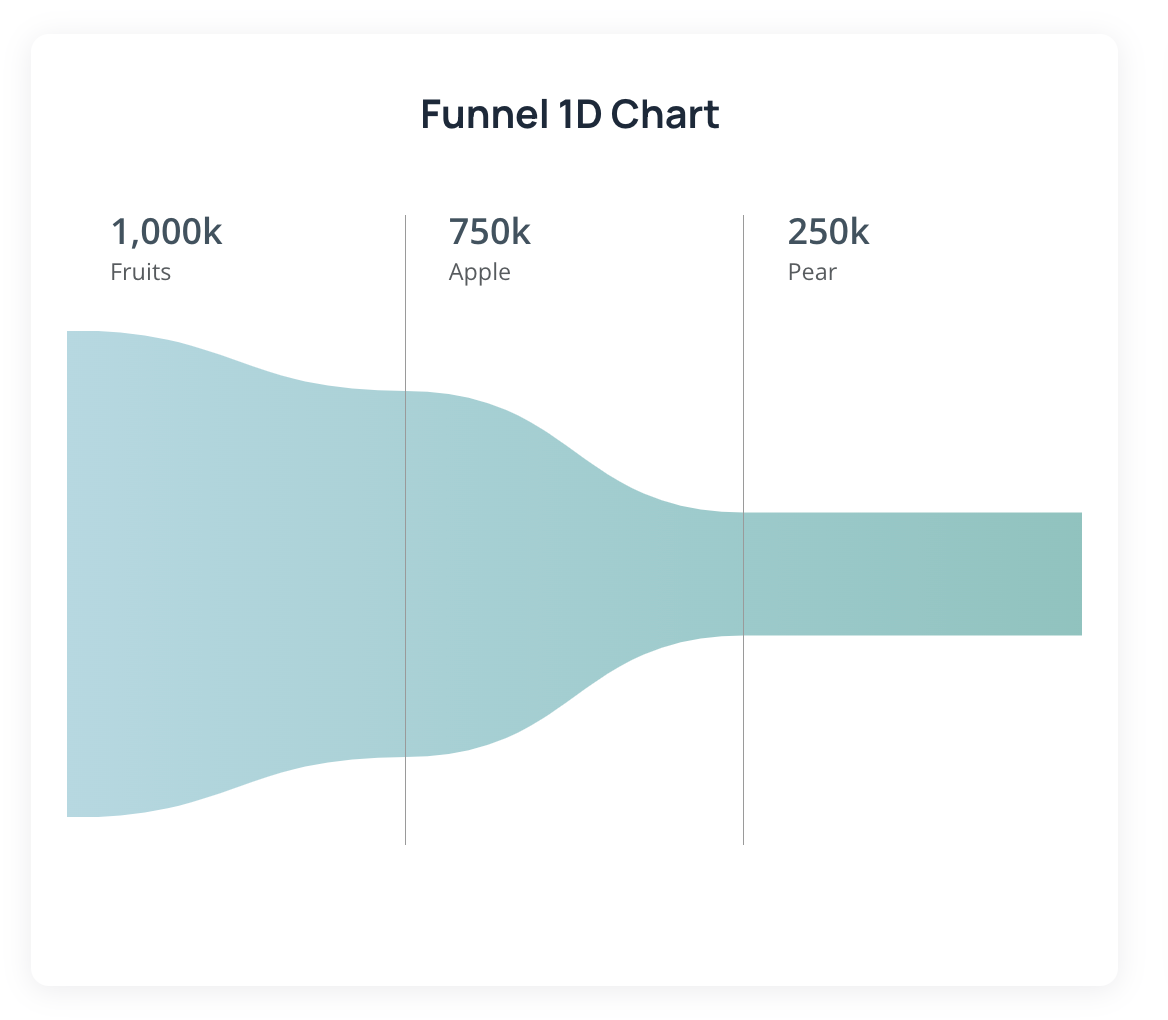
A 1D chart represents data along a single dimension. It’s simpler and usually used to show the distribution of one variable. Element is fully customizable. We can choose labels, values, colors, size, font size and even orientation. We can also enable displays in percentages. We're gonna go over every field in the element.
Example:
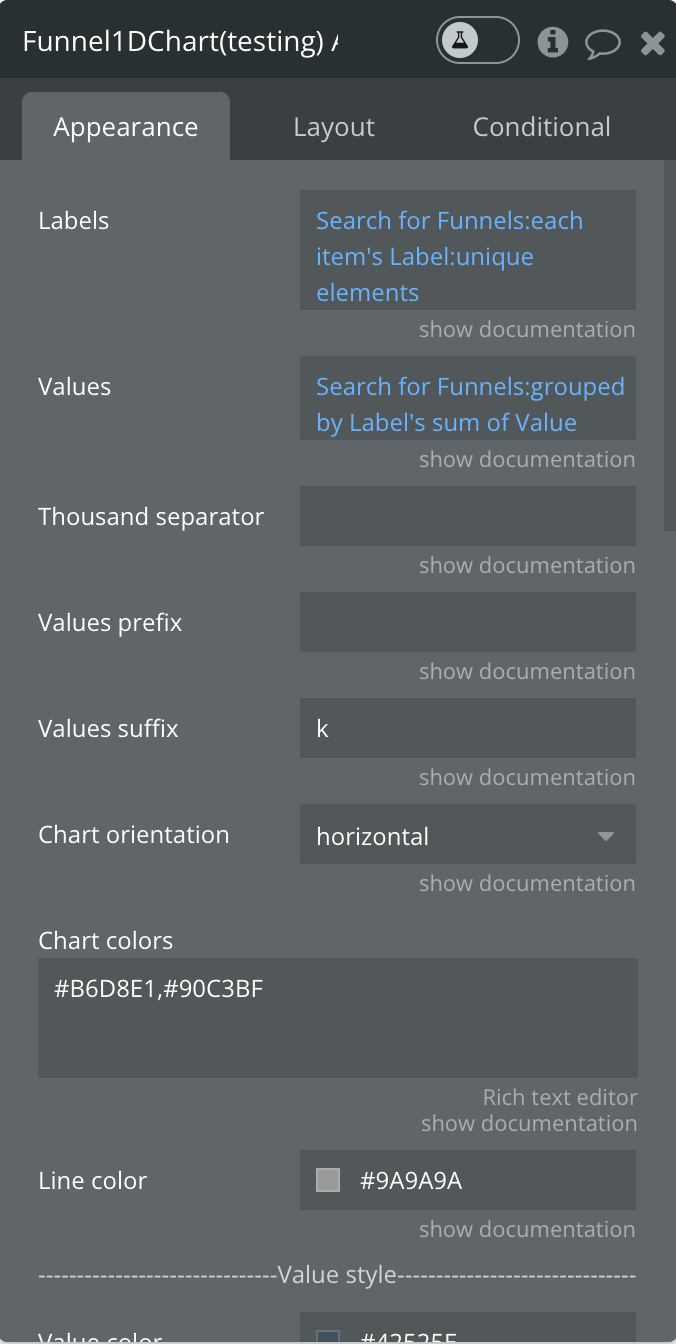
Fields:
Title | Description | Type |
Labels | The labels for provided data. | list of texts |
Values | The total values for every label. | list of numbers |
Thousand separator | The symbol that separates a thousand value from the rest of the number. | text (optional) |
Values prefix | Prefix for the raw values. | text (optional) |
Values suffix | Suffix for the raw values. | text (optional) |
Chart orientation | The orientation for the chart. (horizontal or vertical) | dropdown |
Chart colors | The comma-separated colors for the chart. If not provided, will be assigned the default colors. If it is provided just one color then the whole chart will be the same. If it is provided more colors then the chart will be colored as a gradient. | text (optional) |
Line color | The color for the separation lines. | color |
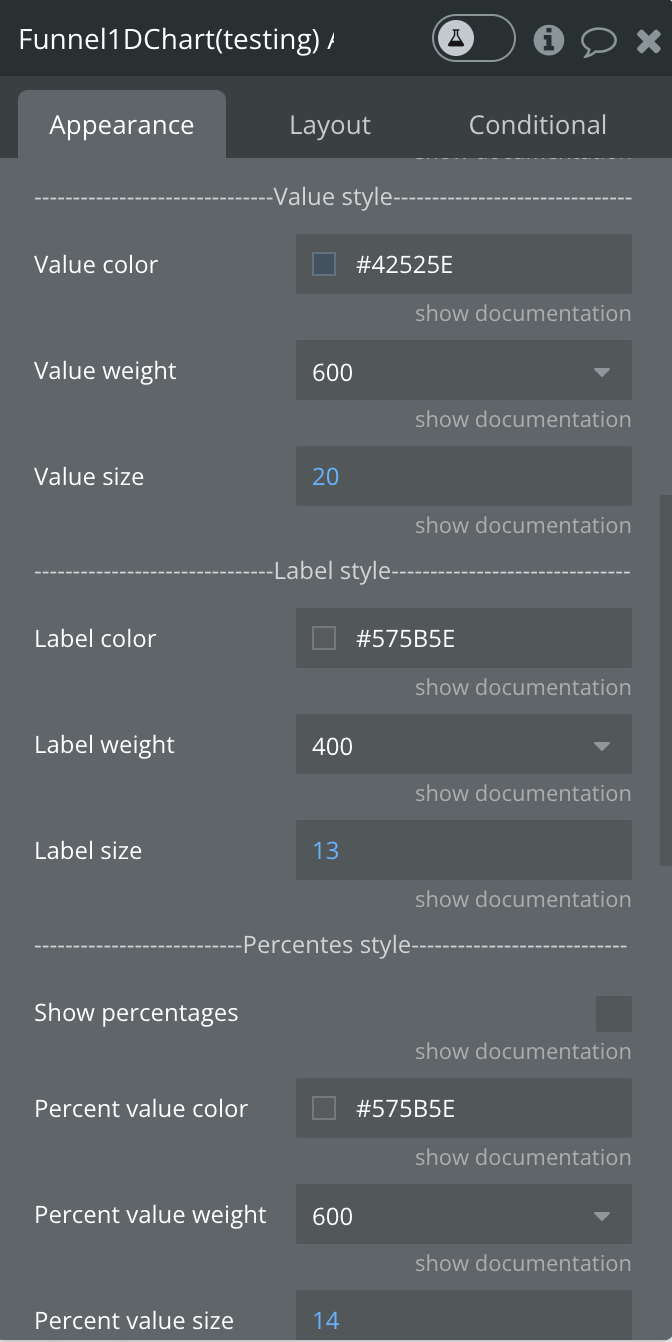
Value style | ||
Value color | The color for provided values is displayed on the chart. | color |
Value weight | The weight for provided values is displayed on the chart. | dropdown |
Value size | The size for provided values is displayed on the chart. | number |
Label style | ||
Label color | The color for provided labels is displayed on the chart. | color |
Label weight | The weight for provided labels is displayed on the chart. | dropdown |
Label size | The size for provided labels is displayed on the chart. | number |
Percentage style | ||
Show percentages | This option allows to representation of provided values in percentages on the chart. | checkbox |
Percent value color | The color for percentages on the chart. | color |
Percent value weight | The weight for percentages on the chart. | dropdown |
Percent value size | The size for percentages on the chart. | number |
💡
Tip: The best practice is to create a separate type for data in Bubble DB, for example, “Funnel”.
Bubble DB:
You will need at least two fields: Labels, Values


Funnel 2D Chart
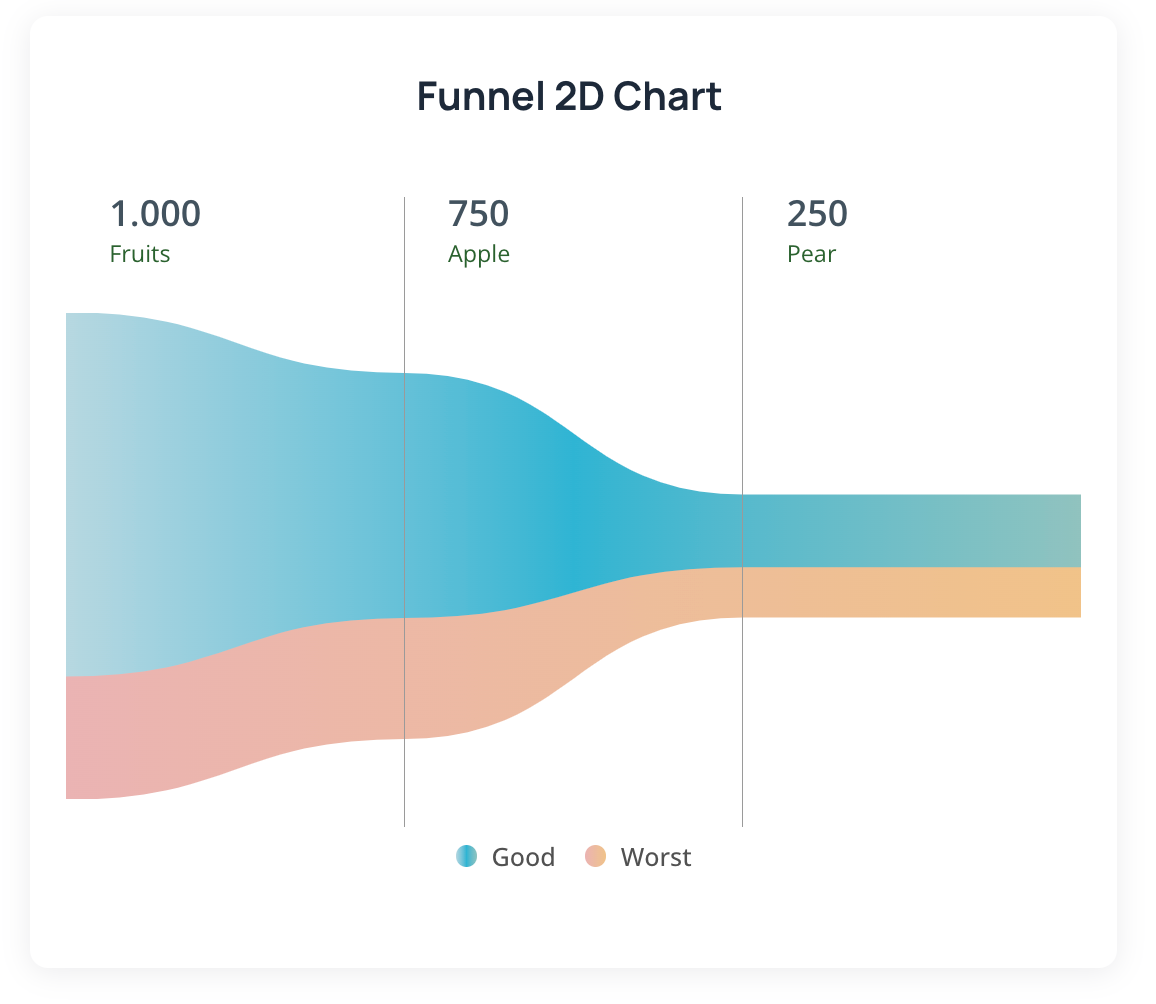
A 2D chart represents data along two dimensions, allowing for a more complex understanding of relationships between variables. Element is fully customizable. We can choose labels, values, colors, size, font size and even orientation. We can also enable displays in percentages. We're gonna go over every field in the element.
Example:
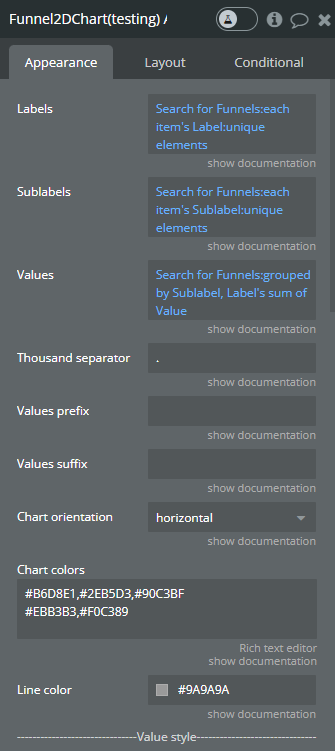
Fields:
Title | Description | Type |
Labels | The labels for provided data. | list of texts |
Sublabels | The sub-labels for provided data | list of texts |
Values | The total values for every label. | list of numbers |
Thousand separator | The symbol that separates a thousand value from the rest of the number. | text (optional) |
Values prefix | Prefix for the raw values. | text (optional) |
Values suffix | Suffix for the raw values. | text (optional) |
Chart orientation | The orientation for the chart. (horizontal or vertical) | dropdown |
Chart colors | The comma-separated colors for the chart. If not provided, will be assigned the default colors. If it is provided just one color then the whole chart will be the same. If it is provided more colors then the chart will be colored as a gradient. | text (optional) |
Line color | The color for the separation lines. | color |
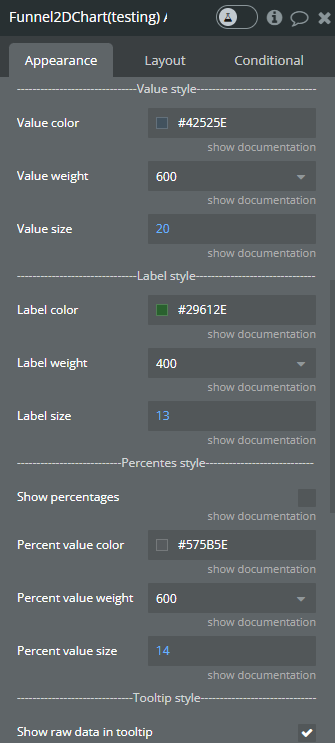
Value style | ||
Value color | The color for provided values is displayed on the chart. | color |
Value weight | The weight for provided values is displayed on the chart. | dropdown |
Value size | The size for provided values is displayed on the chart. | number |
Label style | ||
Label color | The color for provided labels is displayed on the chart. | color |
Label weight | The weight for provided labels is displayed on the chart. | dropdown |
Label size | The size for provided labels is displayed on the chart. | number |
Percentage style | ||
Show percentages | This option allows to representation of provided values in percentages on the chart. | checkbox |
Percent value color | The color for percentages on the chart. | color |
Percent value weight | The weight for percentages on the chart. | dropdown |
Percent value size | The size for percentages on the chart. | number |
Tooltip style | ||
Show raw data in tooltip | When checked shows raw number values, when unchecked shows percentages. | checkbox |
Background color | The background color of the tooltip box | color |
Sublabel color | The color of the tooltip labels | color |
Legend style | ||
Legend title color | The color of text of the legend | color |
Legend title weight | The thickness of text of the legend | dropdown |
Legend title size | The size of the text of the legend | number |
💡
Tip: The best practice is to create a separate type for data in Bubble DB, for example, “Funnel”.
Bubble DB:
You will need at least two fields: Labels, Values


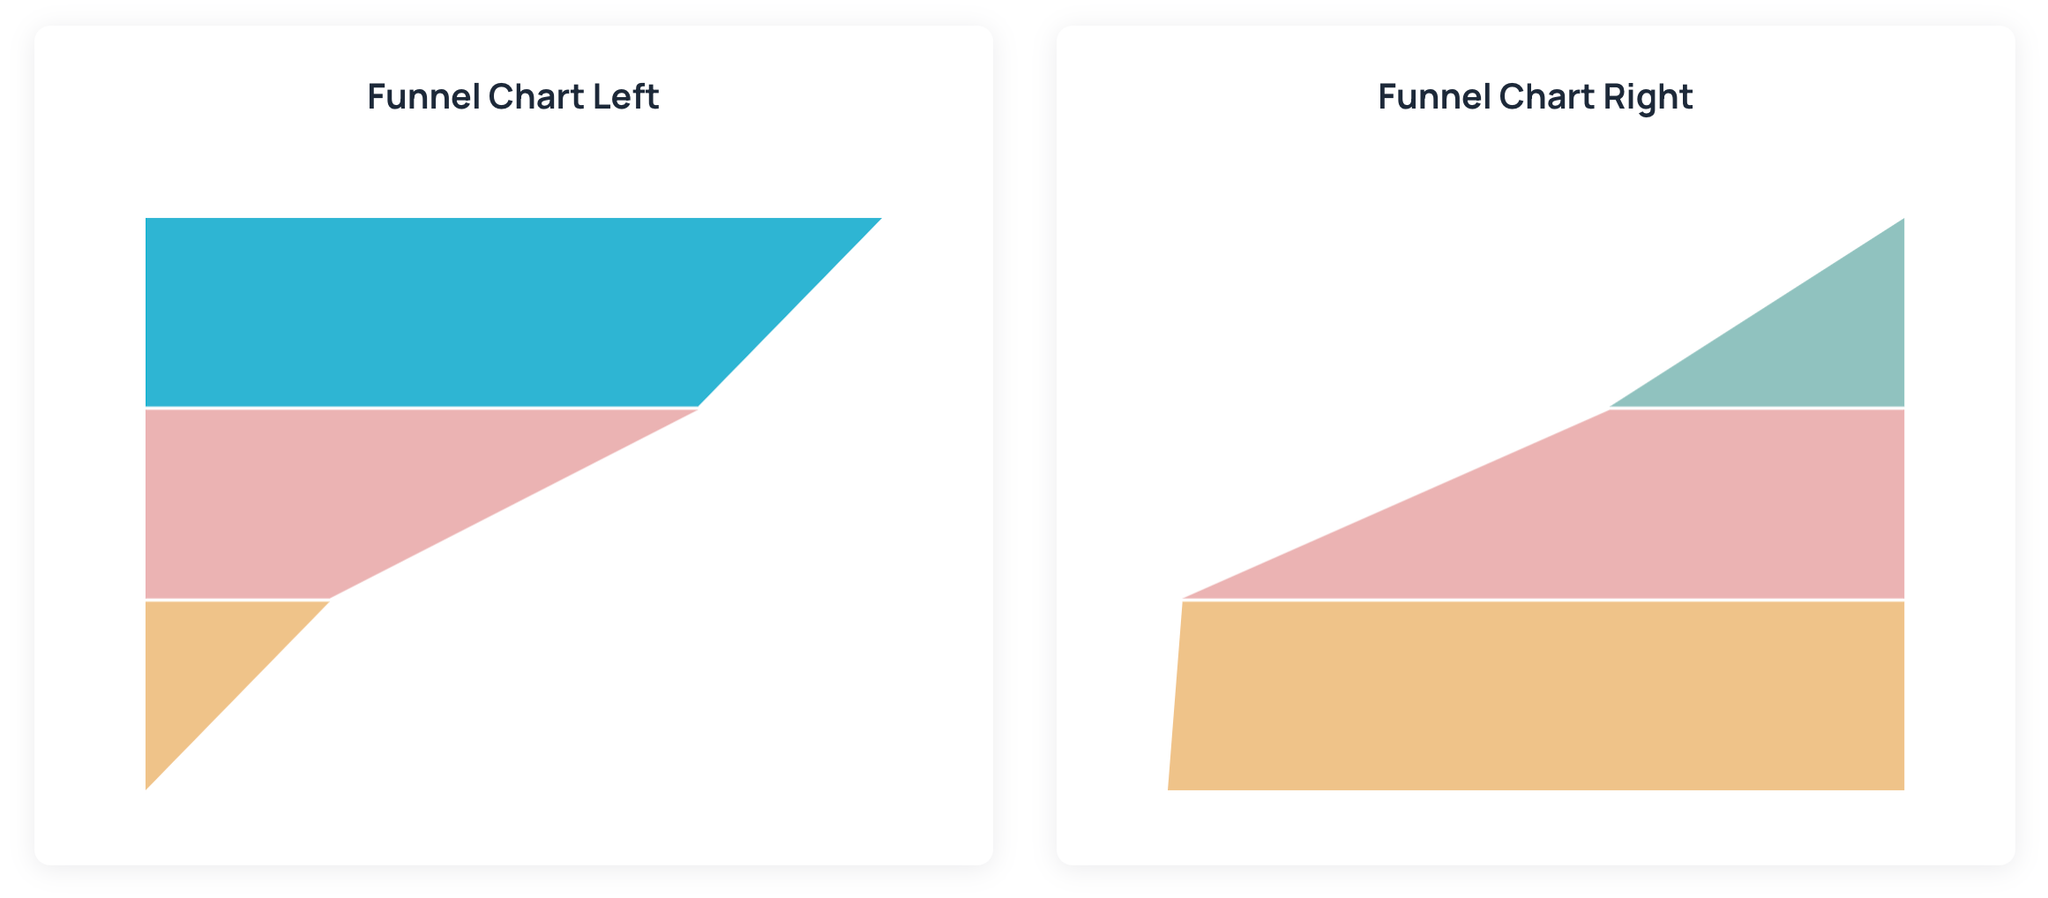
Funnel chart
A Funnel chart represents data along a single dimension. It’s simpler and usually used to show the distribution of one variable. it works almost like funnel 1d chart, but uses another library and displays data differently.
Fields:
Example:
Fields:
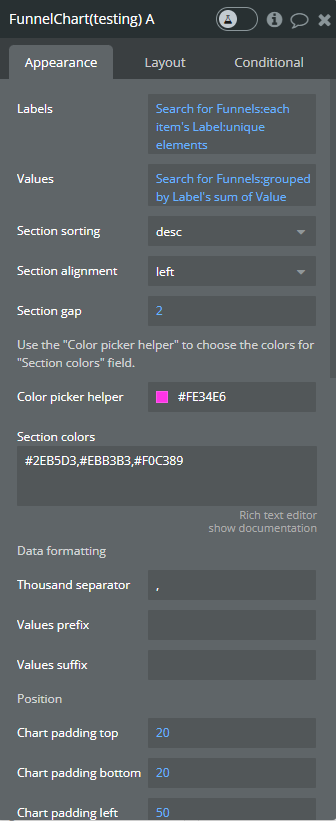
Title | Description | Type |
Labels | The labels for provided data. | list of texts |
Values | The total values for every label. | list of numbers |
Section sorting | Determines if the peak will be at top or bottom | dropdown |
Section alignment | Determines if the data starts from the left or right | dropdown |
Section gap | The space between the layers | number |
Color picker helper | Is there to make it easier for you to choose the colors. It is not displayed on the page. | color |
Section color | The comma-separated colors for the chart. For example: #2EB5D3,#EBB3B3,#F0C389 | text (optional) |
Data formatting | ||
Thousand separator | Custom separator for easier visualization of big values | text (optional) |
Values prefix | Text to prepend to the values | text (optional) |
Values suffix | Text to append to the values | text (optional) |
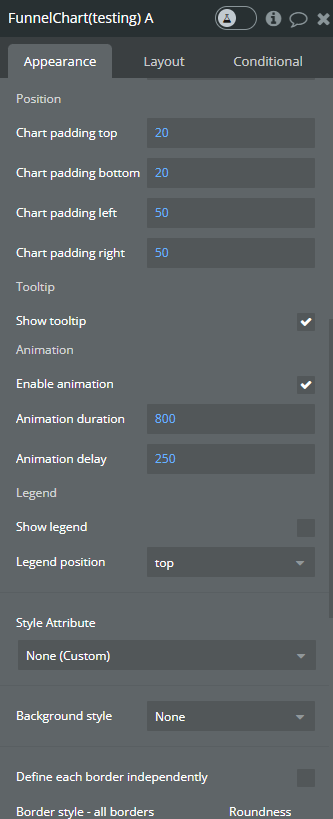
Position | ||
Chart padding top | The indent of the chart from the top | number |
Chart padding bottom | The indent of the chart from the bottom | number |
Chart padding left | The indent of the chart from the left | number |
Chart padding right | The indent of the chart from the right | number |
Tooltip | ||
Show tooltip | Enables or disable tooltip on hover | checkbox |
Animation | ||
Enable animation | Enable or disable animation on initial load or data change | checkbox |
Animation duration | The speed of animation | number |
Animation delay | The delay before the animation starts | number |
Legend | ||
Show legend | Turn the legend on or off | checkbox |
Legend position | Top, bottom, left, right | dropdown |
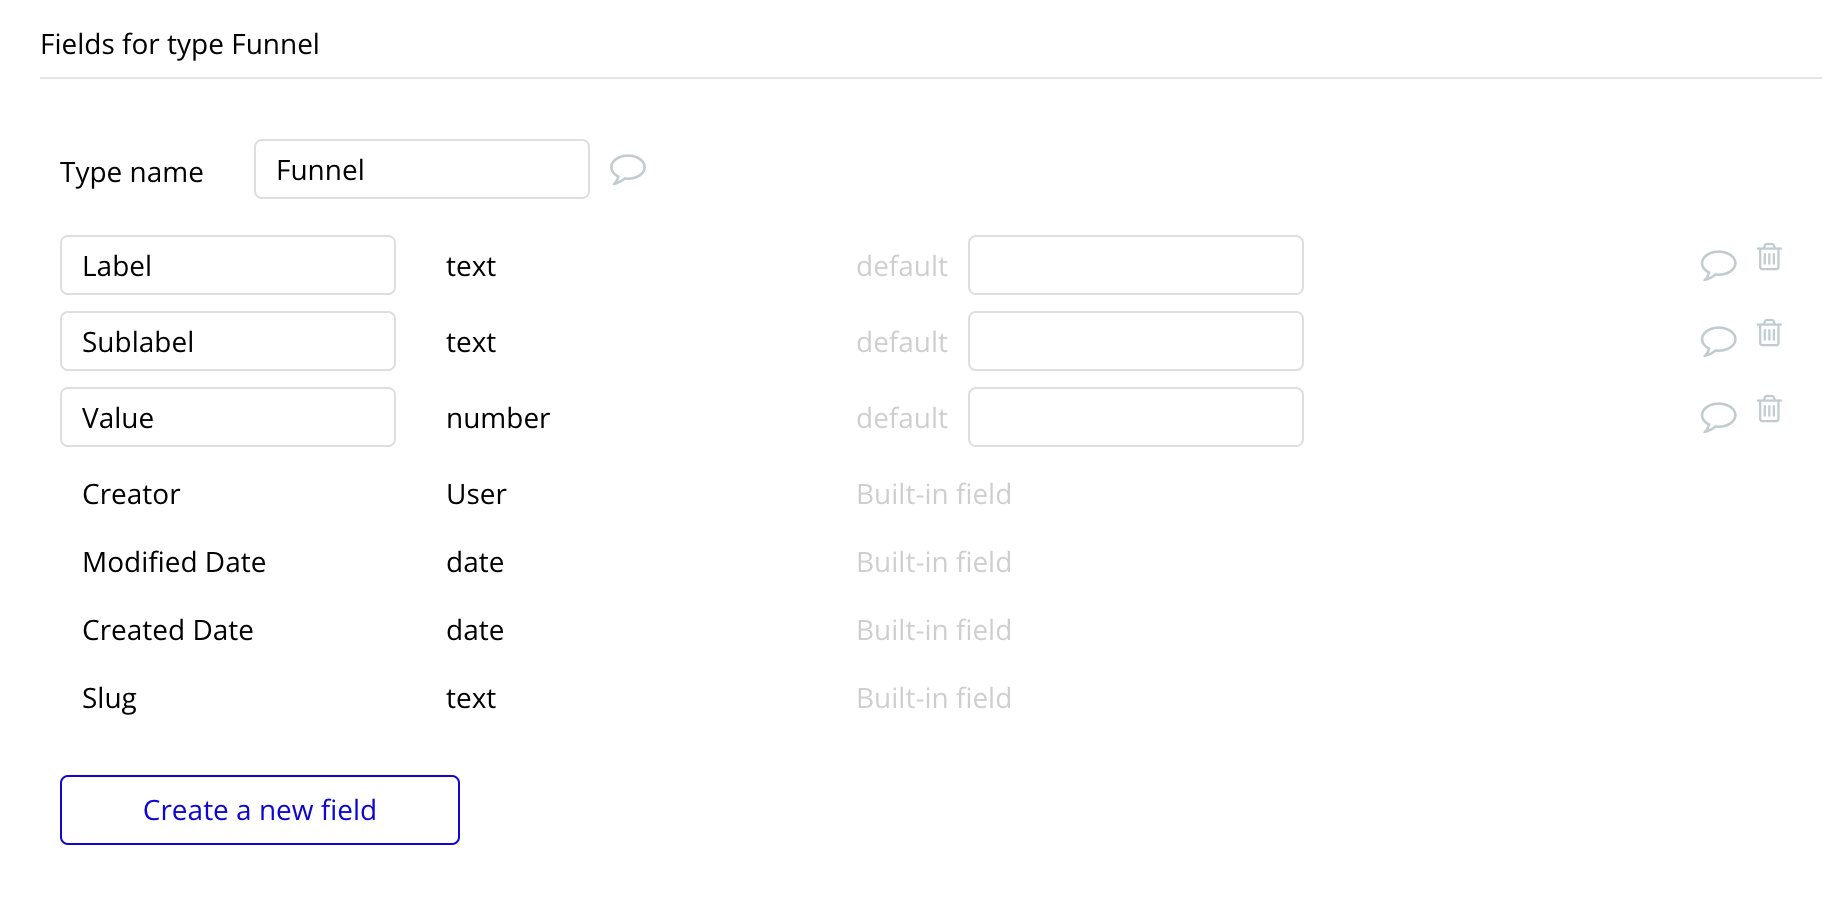
💡
Tip: The best practice is to create a separate type for data in Bubble DB, for example, “Funnel”.
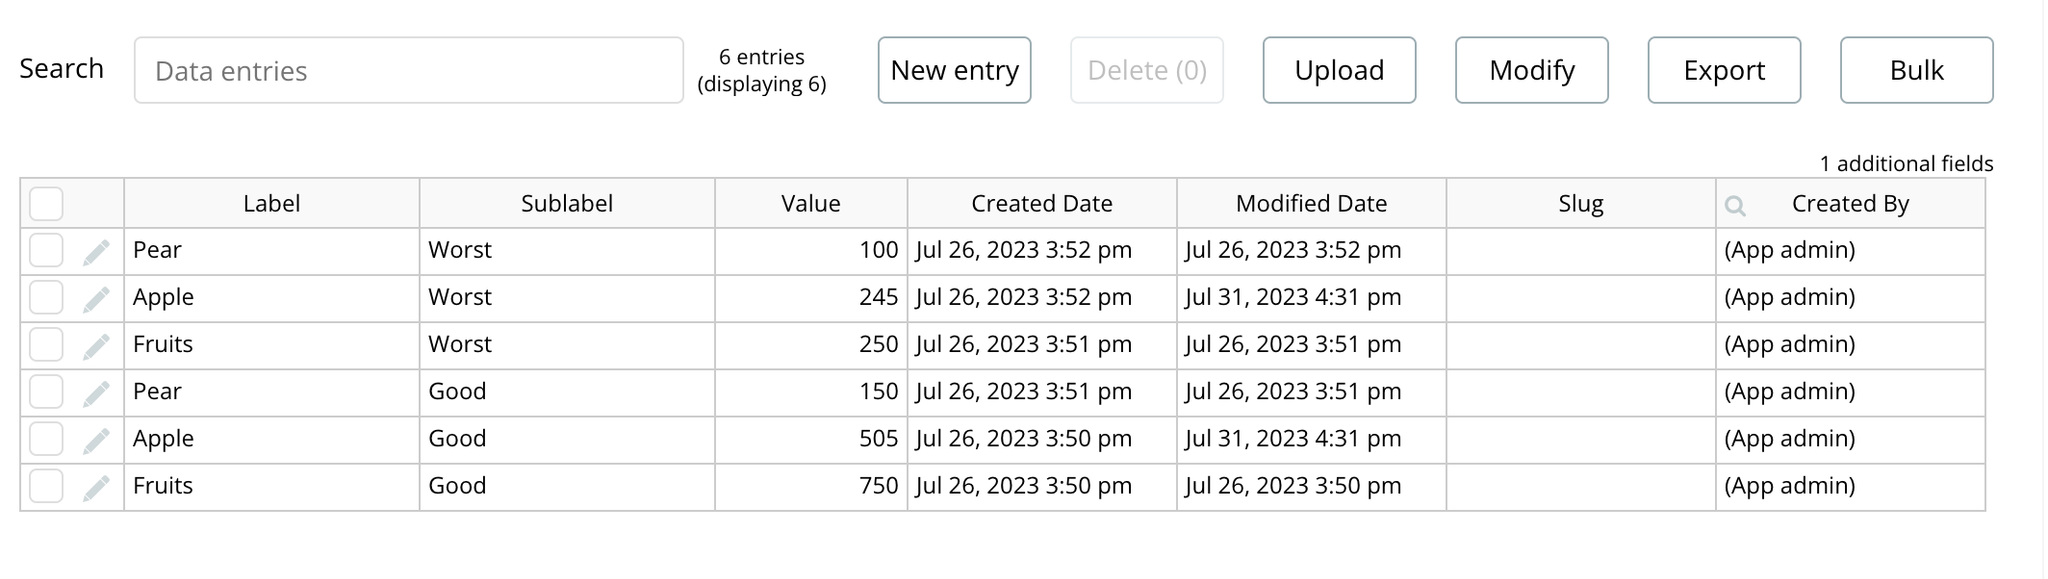
Bubble DB:
You will need at least two fields: Labels, Values
Exposed states
- label on hover - stores the label of the last element the user hovered over.
- value on hover - stores the value of the last element the user hovered over.
- label on click - stores the label of the last element the user clicked at.
- value on click - stores the value of the last element the user clicked at.
Events
- is clicked - an element of the chart was clicked and it’s value was published in the value_on_click and label_on_click.
- has hovered - the element of the chart was hovered over and it’s value was published in the label_on_hover and value_on_hover.
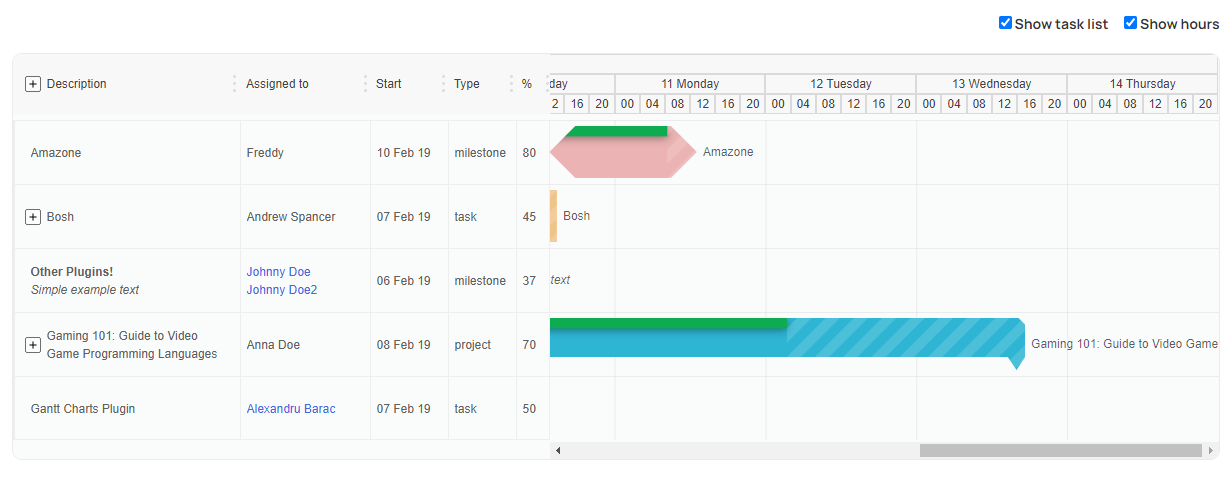
Gantt Chart
A Gantt chart is a type of bar chart that represents a project schedule. It is a tool used in project management for planning, scheduling, and tracking specific tasks and resources in a project.
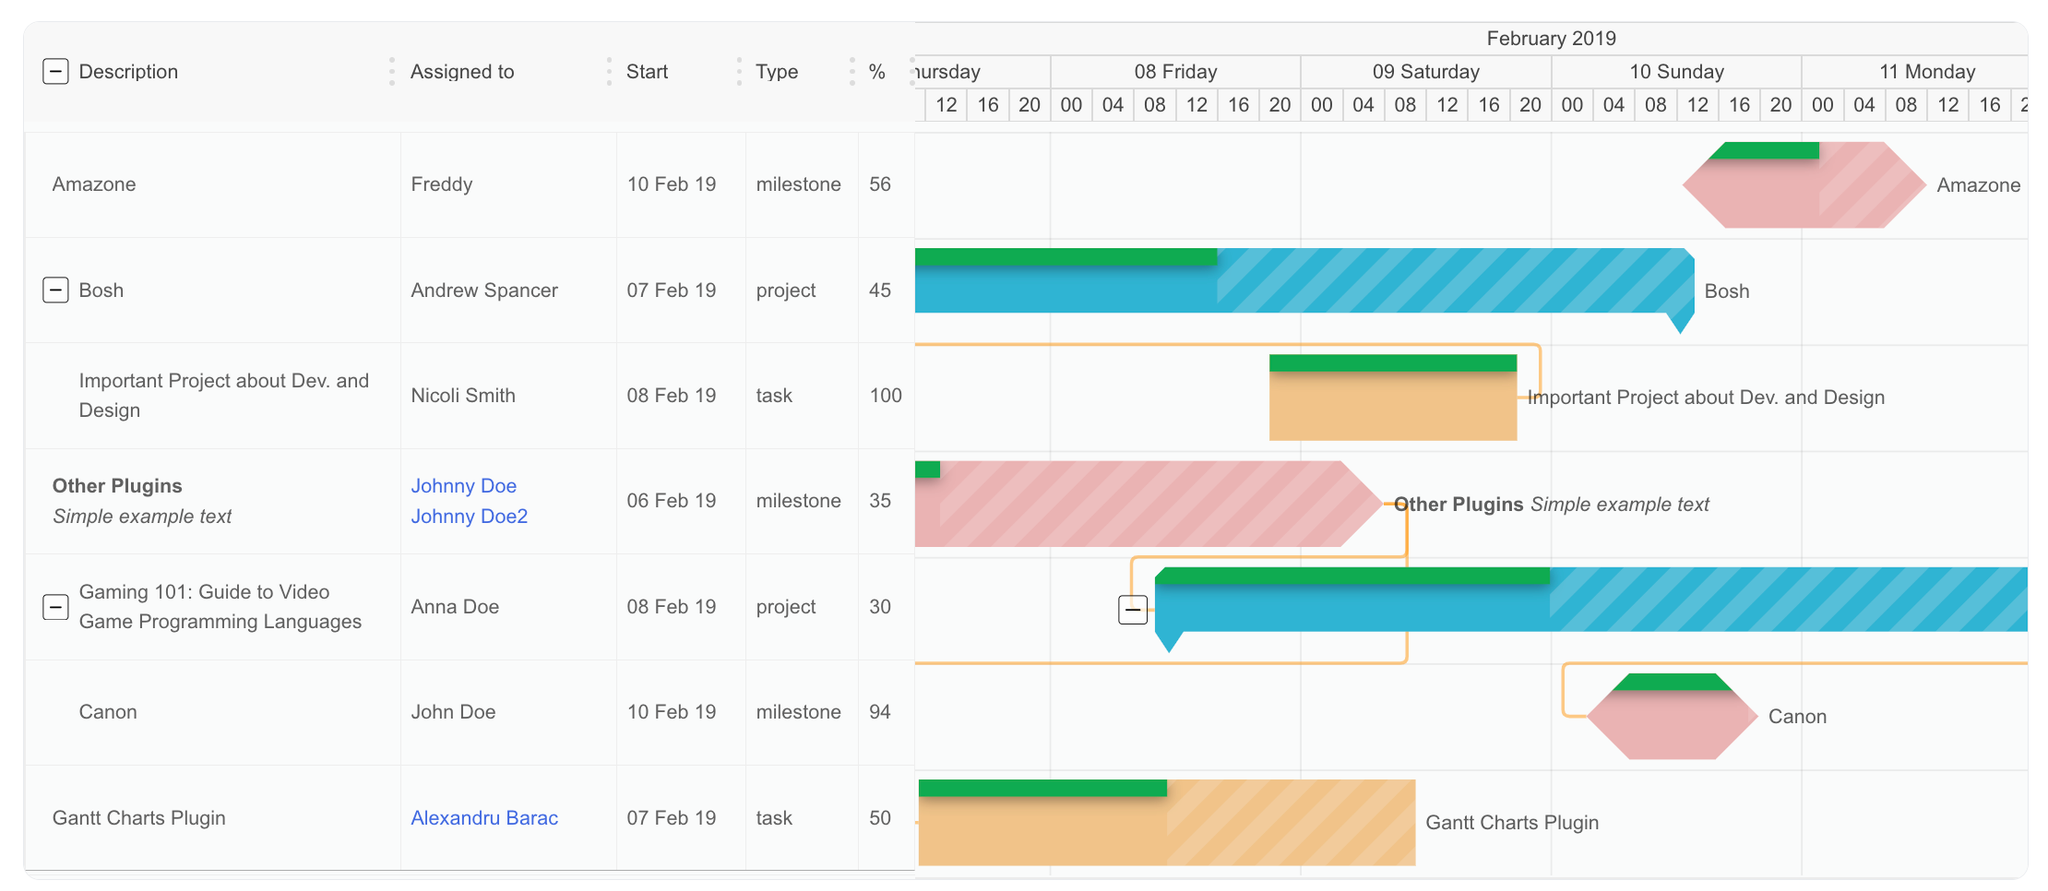
Example:
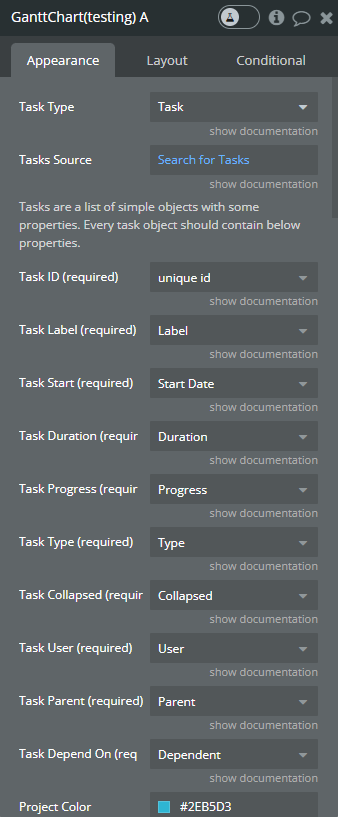
Fields:
Title | Description | Type |
Task Type | Select a task type from your database types. | App Type |
Tasks Source | A task list from Bubble. | list of Task Type |
Task ID (required) | The unique id of the task. It can be a custom ID, or a bubble-unique ID. | text field of Task Type |
Task Label (required) | The field from the task type object that serves as a label on the chart. | text field of Task Type |
Task Start (required) | The time when the task started. There must be a “bubble date” field from the type object. | date field of Task Type |
Task Duration (required) | The expected duration of the task is in milliseconds. It must be a numeric field from the type object. | numeric field of Task Type |
Task Progress (required) | The progress of the task from 0 to 100. It must be a numeric field from the type object. | numeric field of Task Type |
Task Type (required) | The type of the task assigned. It must be a value from the type object. The value can be either “task”, ”milestone”, or “project” (without quotes). | text field of Task Type |
Task Color (optional) | Task color. It must be a text field from the type object that contains the HEX color. If this field is empty, the task color will be assigned based on task type. | text field of Task Type (optional) |
Task Collapsed (required) | Can the task be collapsed if it has children? It must be a value from the task-type object. The value is a yes/no. | boolean field of Task Type |
Task User (required) | The user that this task is assigned to. This field can be written in DB like a simple name “John Doe” or it can be written like an HTML link, ex: “<a href=’url_here’>John Doe</a>”. | text field of Task Type |
Task Parent (required) | The id of the task that is a parent of this task. It must be a value from the task-type object. | text field of Task Type |
Task Depend On (required) | The list of IDs of other tasks that this task depends on. It must be a value from the task-type object. The value is a list of text. | list of text fields of Task Type |
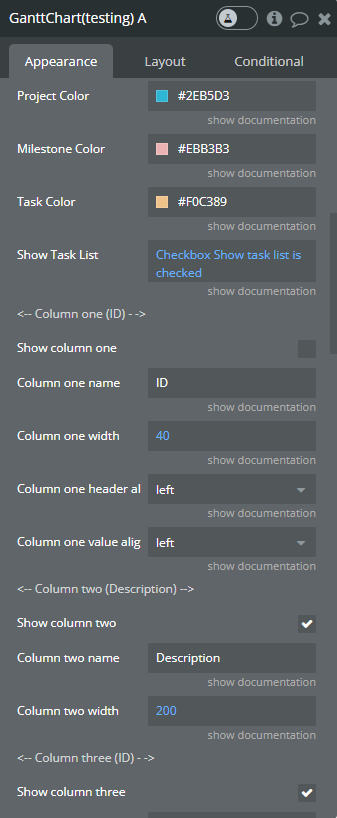
Project Type Color | The project type color of task on the chart. The default color is #F95C4C. | Color (optional) |
Milestone Type Color | The milestone type color of task on the chart. The default color is #0287D0. | Color (optional) |
Task Type Color | The task type color of task on the chart. The default color is #8E44AD. | Color (optional) |
Show Task List | Show or hide the list of tasks to the left of the chart. | yes/no |
Column one (ID) | Displays the id of each item | |
Show column one | Add/remove an additional ID column from/to the list. | Checkbox |
Column one name | The label of the column. | text |
Column one width | The width of the column. | number |
Column one header alignment | The alignment for the header cell of the first column. | Dropdown |
Column one value alignment | The alignment for the value cell of the first column. | Dropdown |
Column two (Description) | ||
Show column two | Add/remove an additional Description column from/to the list. | Checkbox |
Column two name | The label of the column. | text |
Column two width | The width of the column. | number |
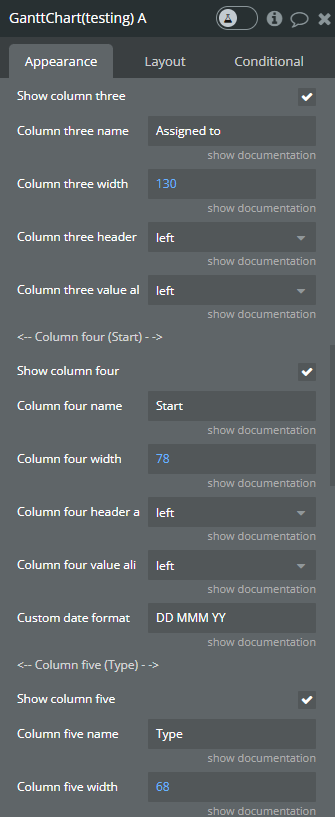
Column three (Assigned to) | ||
Show column three | Add/remove an additional Assigned to column from/to the list. | Checkbox |
Column three name | The label of the column. | text |
Column three width | The width of the column. | number |
Column three header alignment | The alignment for the header cell of the third column. | Dropdown |
Column three value alignment | The alignment for the value cell of the third column. | Dropdown |
Column four (Type) | ||
Show column four | Add/remove an additional Type column from/to the list. | Checkbox |
Column four name | The label of the column. | text |
Column four width | The width of the column. | number |
Column four header alignment | The alignment for the header cell of the fourth column. | Dropdown |
Column four value alignment | The alignment for the value cell of the fourth column. | Dropdown |
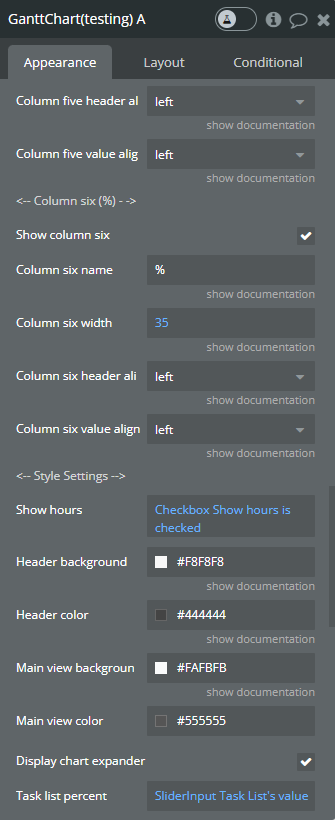
Column five (%) | ||
Show column five | Add/remove an additional % column from/to the list. | Checkbox |
Column five name | The label of the column. | text |
Column five width | The width of the column. | number |
Column five header alignment | The alignment for the header cell of the fifth column. | Dropdown |
Column five value alignment | The alignment for the value cell of the fifth column. | Dropdown |
Column six (Start) | ||
Show column six | Add/remove an additional Start column from/to the list. | Checkbox |
Column six name | The label of the column. | text |
Column six width | The width of the column. | number |
Column six header alignment | The alignment for the header cell of the sixth column. | Dropdown |
Column six value alignment | The alignment for the value cell of the sixth column. | Dropdown |
Column seven (End) | ||
Show column seven | Add/remove an additional End column from/to the list. | Checkbox |
Column seven name | The label of the column. | text |
Column seven width | The width of the column. | number |
Column seven header alignment | The alignment for the header cell of the seventh column. | Dropdown |
Column seven value alignment | The alignment for the value cell of the seventh column. | Dropdown |
Custom date format | Please consult this doc to create the right date format: "https://day.js.org/docs/en/display/format". Default format: YYYY-MM-DD | text |
Style Settings | ||
Show Hours | Show or hide the hours from the header of the chart. | yes/no |
Header Background | Set up the background color for the header of the chart. | Color (optional) |
Header Color | Set up the text color for the header of the chart. | Color (optional) |
Main View Background | Set up the background color for the main view of the chart. | Color (optional) |
Main View Color | Set up the text color for the main view of the chart. | Color (optional) |
Weekend Days Color | Set up the text color for the weekends of the chart. | Color (optional) |
Display Chart Expander | It displays a +/- button for collapsible tasks. | Checkbox |
Task List Percent | Set up the size of the task list in percentages. | number |
Scale X | Set up the main view scale on the X-axis. Accepted values from 2 to 22. | number |
Scale Y | Set up the main view scale on the Y-axis. Accepted values from 10 to 100. | number |
Show Progress Linear | It displays a green line on the top of each task that expresses the progress. | Checkbox |
Language | Set up the language of the chart. Supports: en, jp, fr, pl | Text, Optional |
💡
Tip: All the properties marked with REQUIRED are essential for rendering in the Gantt chart. If a REQUIRED field is empty, the Gantt chart on the page preview will ignore the task. The simplest way to get the Gantt chart working is to prepare your data according to our documentation.
💡
Tip: The best practice is to create a separate type for tasks in Bubble DB, for example, “Task”.
Bubble DB:
You will need at least ten fields: Collapsed, Depends on (Dependent), Duration, Label, Parent, Progress, Start date, Type, User, Unique id.
An example of data from Bubble Task type:

An example of Task type in Bubble:

Exposed states
- Clicked Task ID - the id of the latest clicked task (text).
- Clicked Task Label - the label of the latest clicked task (text).
- Clicked Task Start - the task start time of the latest clicked task (text).
- Clicked Task Duration - the duration of the latest clicked task (number).
- Clicked Task Progress - the progress of the latest clicked task (number).
- Clicked Task Type - the type of the latest clicked task (text).
- Clicked Task Parent- the parent of the latest clicked task (text).
- Clicked Task Dependent on - the dependent on the latest clicked task (text).
- Hovered Taks ID - the ID of the latest hovered at task (text).
- Hovered Task Label - the label of the latest hovered-at task (text).
- Hovered Task Start - the task start time of the latest hovered at task (text).
- Hovered Task Duration - the task duration time of the latest hovered-at task (text).
- Hovered Task Progress - the progress of the latest hovered at task (text).
- Hovered Task Type - the type of the latest hovered task (text).
- Hovered Task Parents - the parents of the latest hovered at task (text).
- Hovered Task Dependent - the dependent of the latest hovered at task (text).
Events
- Item Clicked - a task has been clicked and the states related to the click event have been populated.
- Item Hovered - a task has been hovered over and the states related to the hover event have been populated.
Element Actions
- Center Chart - will centre the chart on the current date/time.
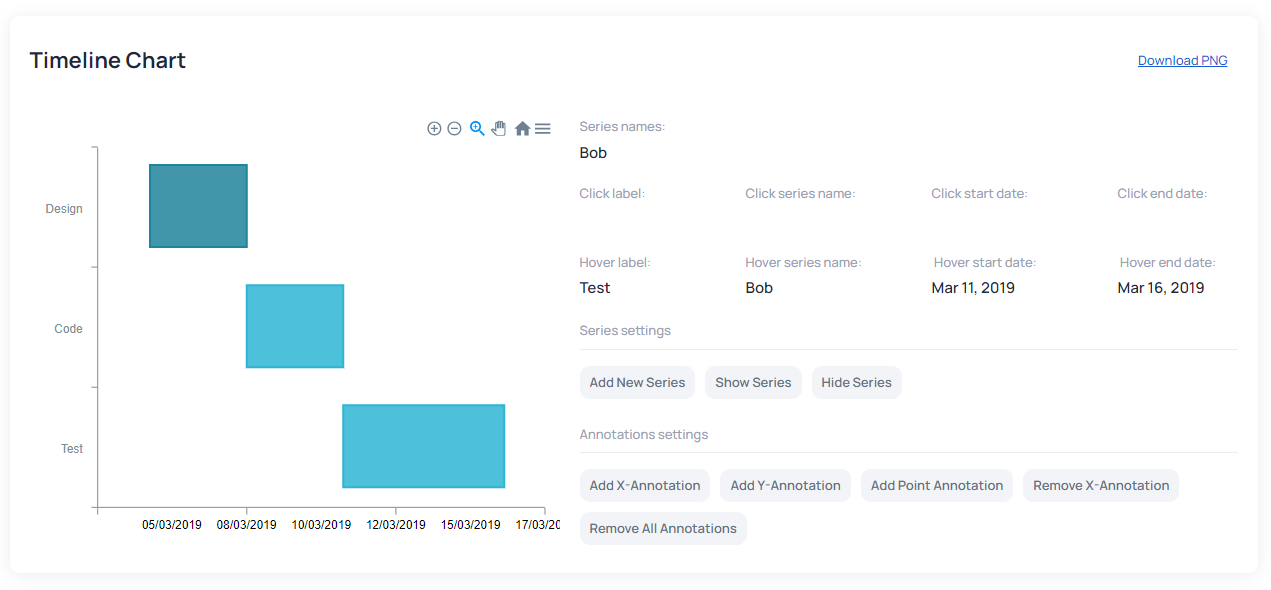
Timeline Chart
A timeline chart is a visual representation of a sequence of events in chronological order. It's used to display the progression of time, helping to illustrate when specific events occurred or are expected to occur. Timeline charts are widely used in project management, history education, and business planning.
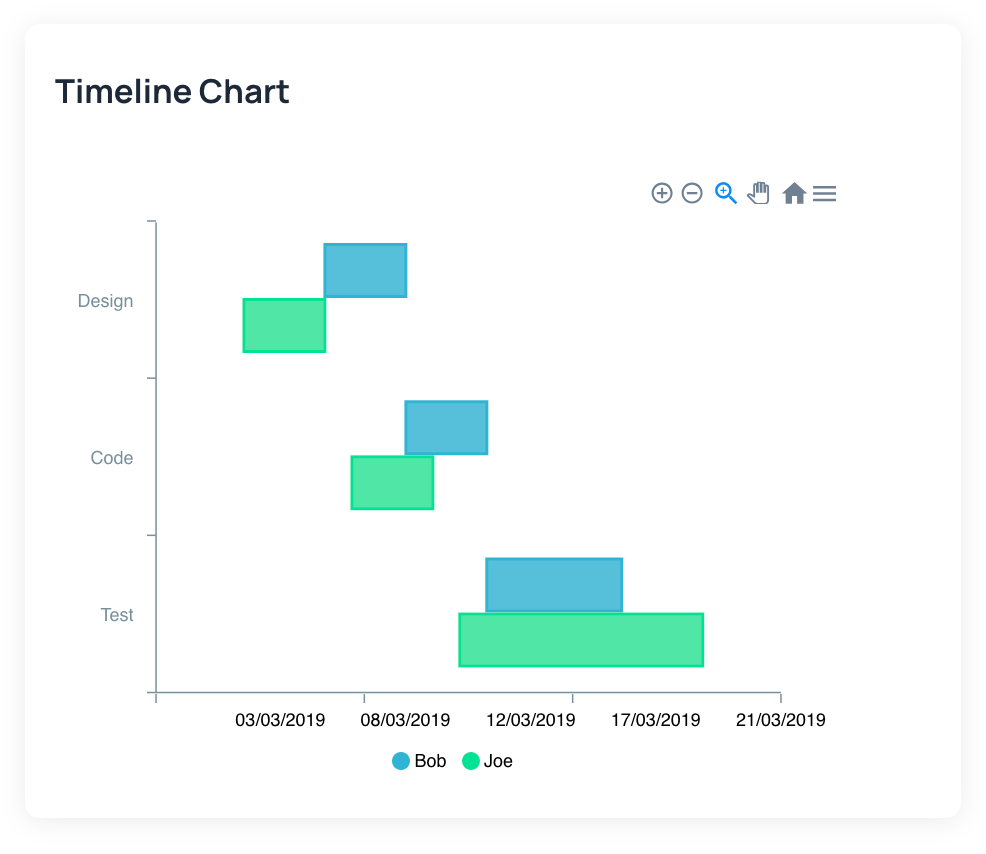
Examples:
Fields:
Title | Description | Type |
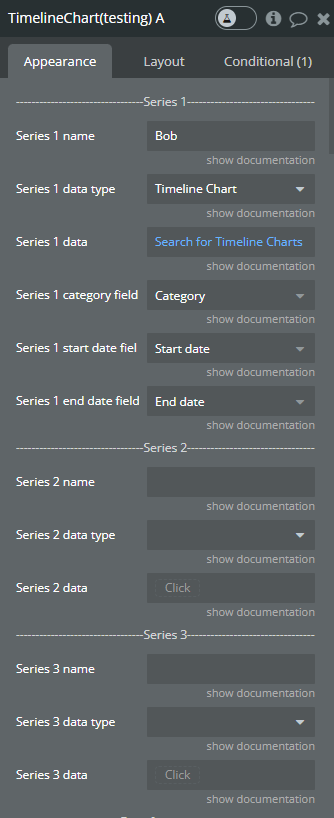
Series 1 | ||
Series 1 name | Unique name of the 1st series | text |
Series 1 data type | The data type with “category”, “start date”, and “end date” | dropdown |
Series 1 data | The source of the data from the DB | dynamic field |
Series 1 category field | The field from the data type that represents the category | dropdown |
Series 1 start date field | The field from the data type that represents the start date | dropdown |
Series 1 end date field | The field from the data type that represents the end date | dropdown |
Series 2 (Optional) | ||
Series 2 name | Unique name of the 2nd series | text |
Series 2 data type | The data type with “category”, “start date”, and “end date” | dropdown |
Series 2 data | The source of the data from the DB | dynamic field |
Series 3 (Optional) | ||
Series 3 name | Unique name of the 3rd series | text |
Series 3 data type | The data type with “category”, “start date”, and “end date” | dropdown |
Series 3 data | The source of the data from the DB | dynamic field |
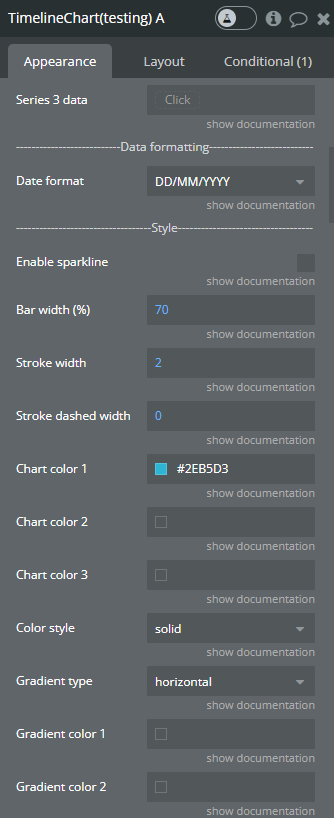
Data formatting | ||
Date format | The format of the date on chart | dropdown |
Style | ||
Enable sparkline | Hides all the elements of the chart other than the primary paths. Helps visualize data in small areas. | checkbox |
Bar width | The size of the bar in percentages related to the grid size | number |
Stroke width | The size of the stroke on the bar | number |
Stoke dashed width | If this value is more than 0 the stroke will be dashed | number |
Chart color 1 | The color of the 1st series | color |
Chart color 2 | The color of the 2nd series | color |
Chart color 3 | The color of the 3rd series | color |
Color style | Solid or gradient | dropdown |
Gradient type | Horizontal or vertical | dropdown |
Gradient color 1 | The 2nd color for the gradient for the 1st series | color |
Gradient color 2 | The 2nd color for the gradient for the 2nd series | color |
Gradient color 3 | The 2nd color for the gradient for the 3rd series | color |
Gradient opacity from | The opacity of the first gradient color | number |
Gradient opacity to | The opacity of the second gradient color | number |
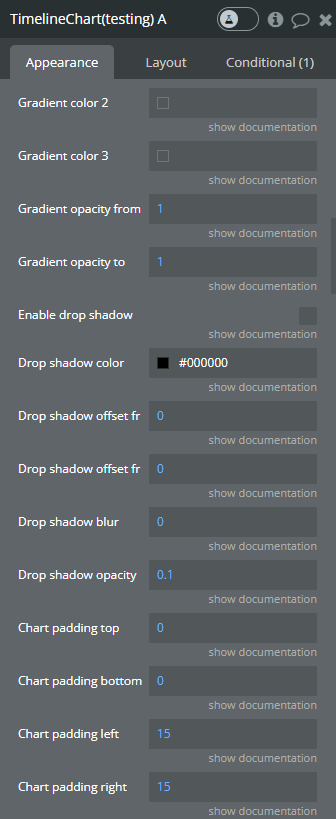
Enable drop shadow | Draws a drop shadow for the series | checkbox |
Drop shadow color | The color of the shadow | color |
Drop shadow offset from the top | The offset of the shadow from top | number |
Drop shadow offset from the left | The offset of the shadow from left | number |
Drop shadow blur | The blur distance of the shadow | number |
Chart padding top | The indent of the chart from top | number |
Chart padding bottom | The indent of the chart from bottom | number |
Chart padding left | The indent of the chart from left | number |
Chart padding right | The indent of the chart from right | number |
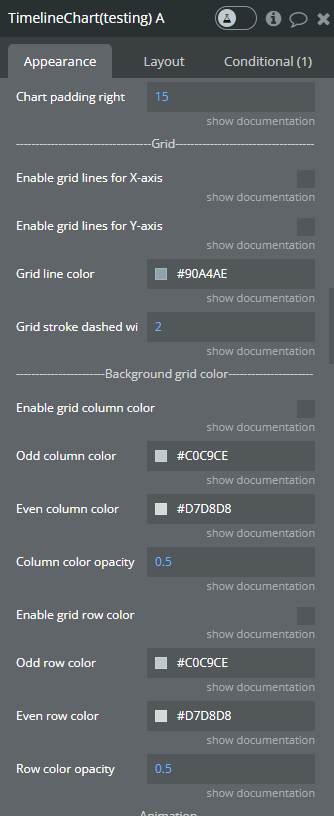
Grid | ||
Enable grid lines for the X axis | Display vertical grid lines | checkbox |
Enable grid lines for the Y axis | Display horizontal grid lines | checkbox |
Grid line color | The color of grid lines | color |
Grid stroke dashed width | If this value is greater than 0 the line will be dashed | number |
Background grid color | ||
Enable grid column color | Adds background color to the vertical grid spaces | checkbox |
Odd column color | The color of the odd grid columns | color |
Even column color | The color of the even grid columns | color |
Column color opacity | The opacity of the grid column color | number |
Enable grid row color | Adds background color to the horizontal grid spaces | checkbox |
Odd row color | The color of the odd grid rows | color |
Even row color | The color of the even grid rows | color |
Row color opacity | The opacity of the grid row color | number |
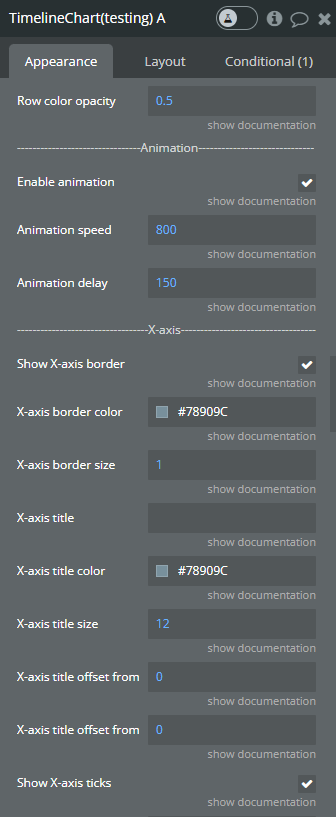
Animation | ||
Enable animation | Animate the chart on change | checkbox |
Animation speed | How fast the animation should end | number |
Animation delay | How much the animation should wait before starting | number |
X-axis | ||
Show X-axis border | Show or hide the X axis | checkbox |
X-axis border size | The thickness of the X axis | number |
X-axis title | X-axis title | text |
X-axis title color | X-axis title color | color |
X-axis title size | The font size of the X-axis title | number |
X-axis title offset from the top | The top indent of the X-axis title | number |
X-axis title offset from the left | The left indent of the X-axis title | number |
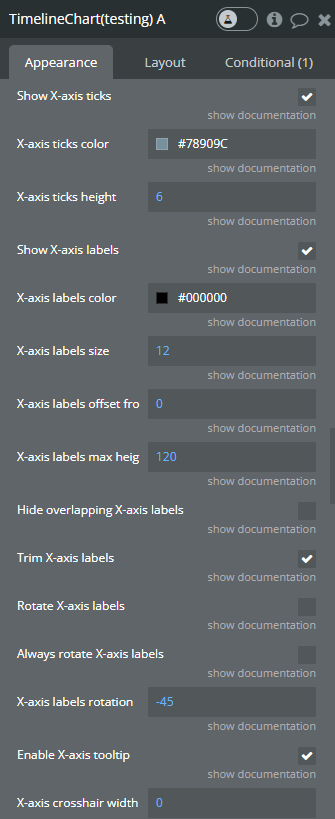
Show X-axis ticks | Show or hide ticks on the X-axis | checkbox |
X-axis ticks color | The color of the X-axis ticks | color |
X-axis ticks height | The height of the X-axis ticks | number |
Show X-axis labels | Show or hide X-axis labels | checkbox |
X-axis label count | The count of X-axis labels. Using a value that is less than half of the count of initial labels is recommended for displaying fewer values. | number (optional) |
X-axis label color | The color of the X-axis labels | color |
X-axis label size | The text size of the X-axis label | number |
X-axis labels offset from the top | The indent from top of the X-axis label | number |
X-axis labels max height | The max height of the X-axis labels | number |
Hide overlapping X-axis labels | Hide some of the X-axis labels if they overlap each other | checkbox |
Trim X-axis labels | Trim X-axis labels adding … to them | checkbox |
Rotate X-axis labels | Rotate X-axis labels if they are too long | checkbox |
Always rotate X-axis labels | Rotates X-axis labels by default | checkbox |
X-axis labels rotation | The angle of rotation of the labels | number |
Enable X-axis tooltip | Shows a tooltip on the x-axis on hover | checkbox |
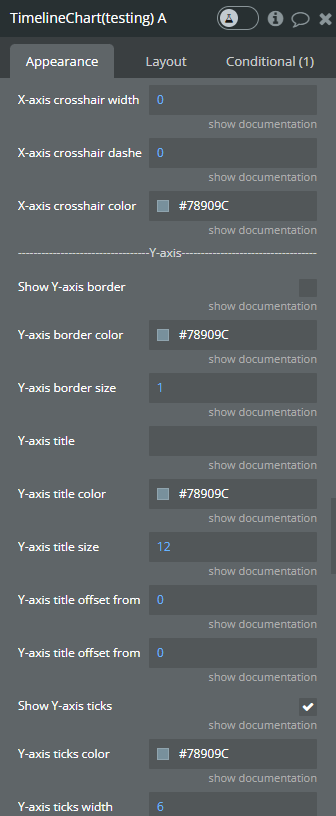
X-axis crosshair width | The size of the crosshair. If the value is greater than 0, the crosshair will be displayed. | number |
X-axis crosshair dashed width | If this value is greater than 0 the crosshair will be dashed | number |
X-axis crosshair color | The color of the crosshair line | color |
Y-axis | ||
Show Y-axis border | Show or hide the Y-axis | checkbox |
Y-axis border color | The color of the Y-axis border | color |
Y-axis border size | The thickness of the Y-axis | number |
Y-axis title | The title of the Y-axis | text |
Y-axis title color | The color of the title of the Y-axis | color |
Y-axis title size | The size of the text of the Y-axis | number |
Y-axis title offset from the top | The top indent of the Y-axis title | number |
Y-axis title offset from the left | The left indent of the Y-axis title | number |
Show Y-axis ticks | Show or hide ticks on the Y-axis | checkbox |
Y-axis ticks color | The color of the Y-axis ticks | color |
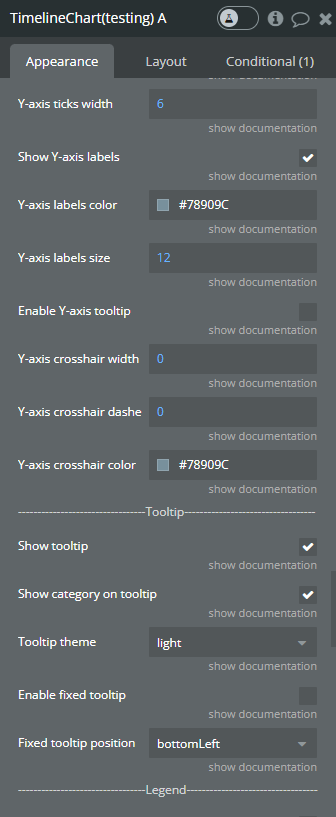
Y-axis ticks width | The size of the Y-axis ticks | number |
Show Y-axis labels | Show or hide Y-axis labels | checkbox |
Y-axis labels color | The color of the Y-axis label | color |
Y-axis labels size | The size of the Y-axis text | number |
Enable Y-axis tooltip | Enable or disable Y-axis tooltip | checkbox |
Y-axis crosshair width | The size of the crosshair. If the value is greater than 0 the crosshair will be displayed. | number |
Y-axis crosshair dashed width | If this value is greater than 0 the crosshair will be dashed. | number |
Y-axis crosshair color | The color of the Y-axis crosshair | color |
Tooltip | ||
Show tooltip | Show / hide tooltip on the chart on hover | checkbox |
Show category on tooltip | Show / hide the category of the element that’s being hovered over in the tooltip | checkbox |
Tooltip theme | The theme of the tooltip | dropdown |
Enable fixed tooltip | Show tooltip in a specified place | checkbox |
Fixed tooltip position | Selects the place where the fixed tooltip will be shown | dropdown |
Legend | ||
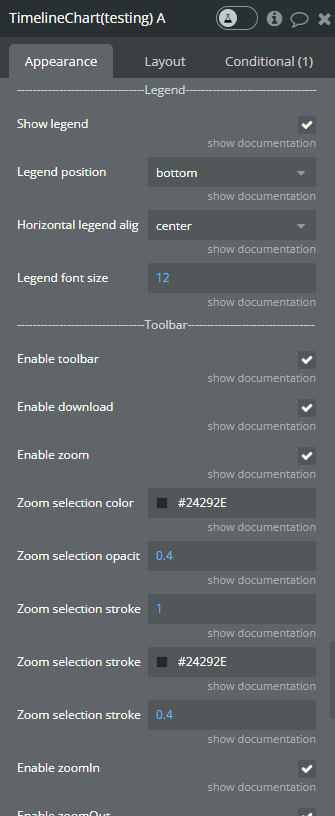
Show legend | Show / hide the legend. Needs at least 2 series to be on chart. | checkbox |
Legend position | The position of the legend | dropdown |
Horizontal legend alignment | Horizontal legend alignment | dropdown |
Legend font size | The size of the text on legend | number |
Toolbar | ||
Enable toolbar | Show / hide the toolbar in the top right corner | checkbox |
Enable download | Add a download option to the toolbar | checkbox |
Enable zoom | Add a zoom option to the toolbar | checkbox |
Zoom selection color | The color of the zoom rectangle | color |
Zoom selection opacity | The transparency of the zoom rectangle | number |
Zoom selection stroke width | The size of the zoom square stroke | number |
Zoom selection stroke color | The color of the zoom rectangle stroke | color |
Zoom selection stroke opacity | The opacity of zoom square stroke | number |
Enable zoomIn | Adds a zoom in chart option to the toolbar | checkbox |
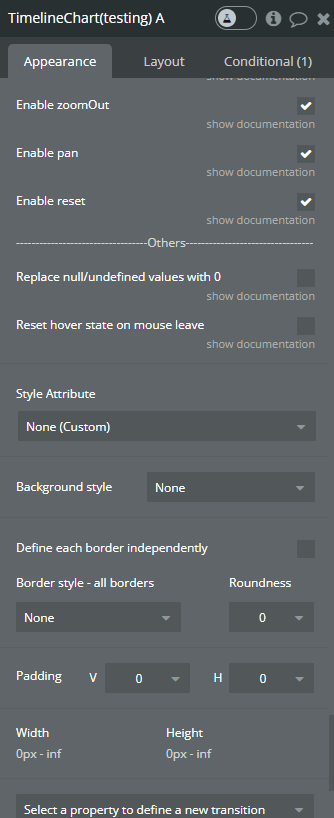
Enable zoomOut | Adds a zoom out chart option to the toolbar | checkbox |
Enable pan | Adds a pan option to the chart toolbar | checkbox |
Enable reset | Adds a reset option to the chart toolbar | checkbox |
Others | ||
Replace null / undefined values with 0 | Replaces null / undefined values with 0 | checkbox |
Reset hover state on mouse leave | Resets the element state when the mouse leaves the hovered area | checkbox |
💡
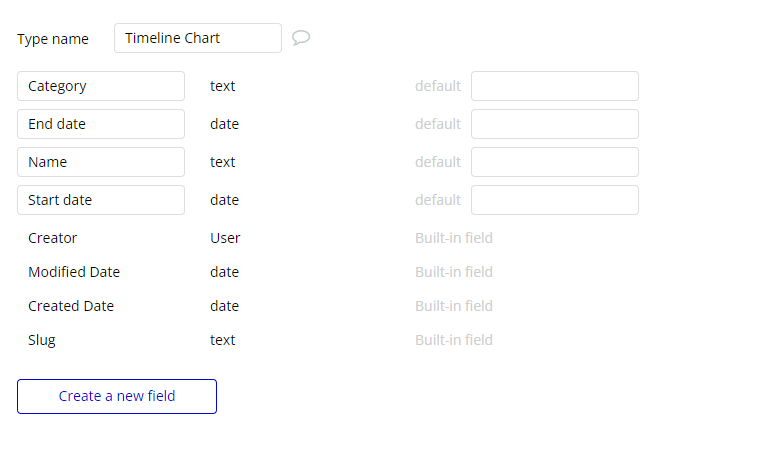
Tip: The best practice is to create a separate type for tasks in Bubble DB, for example, “Timeline Chart”.
Bubble DB:
You will need at least four fields: Category, End date, Name, Start date.
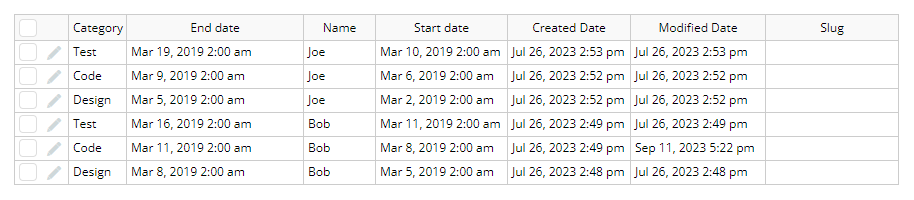
An example of data from Bubble Timeline Chart type:
Exposed states
- Series name on click - (text) Returns the clicked series name.
- Label on click - (text) Returns the Y-axis label when the chart is clicked.
- Start date on click - (date) Returns the start date for the clicked item.
- End date on click - (date) Returns the end date for the clicked item.
- Series name on hover - (text) Returns the hovered series name.
- Label on hover - (text) Returns the Y-axis label when the chart has hovered.
- Start date on hover - (date) Returns the start date for the hovered item.
- End date on hover - (date) Returns the end date for the hovered item.
- PNG url - (text) Returns the generated PNG url after execution of the "Generate PNG Url" action.
- Series names - (list of texts) Returns the list of all series names that are present on the chart.
Events
- Chart is drawn - This event is triggered when the chart is completely drawn.
- Chart is clicked - This event is triggered when the chart is clicked.
- Chart has hovered - This event is triggered when the chart was hovered over.
- PNG Url is available - This event is triggered when the PNG URL is available.
Element Actions
- Append new serie - This action is used to add new serie.
- Show series - This action is used to show specific series on the chart.
- Hide series - This action is used to hide specific series on the chart.
- Add X-Axis annotation - This action is used to add the X-axis annotation on the chart.
- Add Y-Axis annotation - This action is used to add the Y-axis annotation on chart.
- Add Point annotation - This action is used to add the point annotation on the chart.
- Remove annotation - This action is used to remove an annotation from the chart.
- Clear All annotations - This action is used to remove all annotations from the chart.
- Generate PNG Url - This action is used to generate the PNG URL for the chart.

Changelogs
Update 09.09.25 - Version 1.20.0
- Bubble Plugin Page Update (Forum).
Update 03.07.25 - Version 1.19.0
- Bubble Plugin Page Update (Logo).
Update 10.06.25 - Version 1.18.0
- Marketing update (minor change).
Update 09.06.25 - Version 1.17.0
- Marketing update (minor change).
Update 22.08.24 - Version 1.16.0
- New Weekend days color & Language fields.
Update 25.07.24 - Version 1.15.0
- Minor update .
Update 16.07.24 - Version 1.14.0
- Minor update (Marketing update).
Update 24.06.24 - Version 1.13.0
- Updated demo/service links.
Update 06.06.24 - Version 1.12.0
- Minor update.
Update 29.05.24 - Version 1.11.0
- Fixed "Task Depend On" field for empty values.
Update 20.05.24 - Version 1.10.0
- Added field "Task Color" for "Gantt Chart".
Update 17.05.24 - Version 1.9.0
- minor update.
Update 03.04.24 - Version 1.8.0
- updated description.
Update 21.03.24 - Version 1.7.0
- Added "X-axis label count" field for Timeline Chart.
Update 13.03.24 - Version 1.6.0
- Removed redundant fields for Timeline element & fixed console warning..
Update 30.01.24 - Version 1.5.0
- updated description.
Update 29.01.24 - Version 1.4.0
- Added the seventh column & support for mouse wheel & touchpad scroll.
Update 24.01.24 - Version 1.3.0
- updated description.
Update 24.01.24 - Version 1.2.0
- updated description.
Update 26.10.23 - Version 1.1.0
- Improved type assignment for tasks (Gantt Chart).
Update 19.10.23 - Version 1.0.0
- Initial Release.